

The Efficacy and Safety of Roxadustat for Anemia in Hemodialysis Patients with Chronic Kidney Disease: A Meta-Analysis of Randomized Controlled Trials
- PMID: 39771061
- PMCID: PMC11679264
- DOI: 10.3390/toxics12120846
The Efficacy and Safety of Roxadustat for Anemia in Hemodialysis Patients with Chronic Kidney Disease: A Meta-Analysis of Randomized Controlled Trials
Abstract
Background: Patients undergoing hemodialysis (HD) for chronic kidney disease (CKD) often encounter anemia. Roxadustat has not only undergone phase II-III clinical trials in patients suffering from CKD and undergoing HD; a number of post-marketing clinical studies have been conducted using the drug. This article was to assess the effectiveness and safety of roxadustat in managing anemia among patients with CKD undergoing HD.
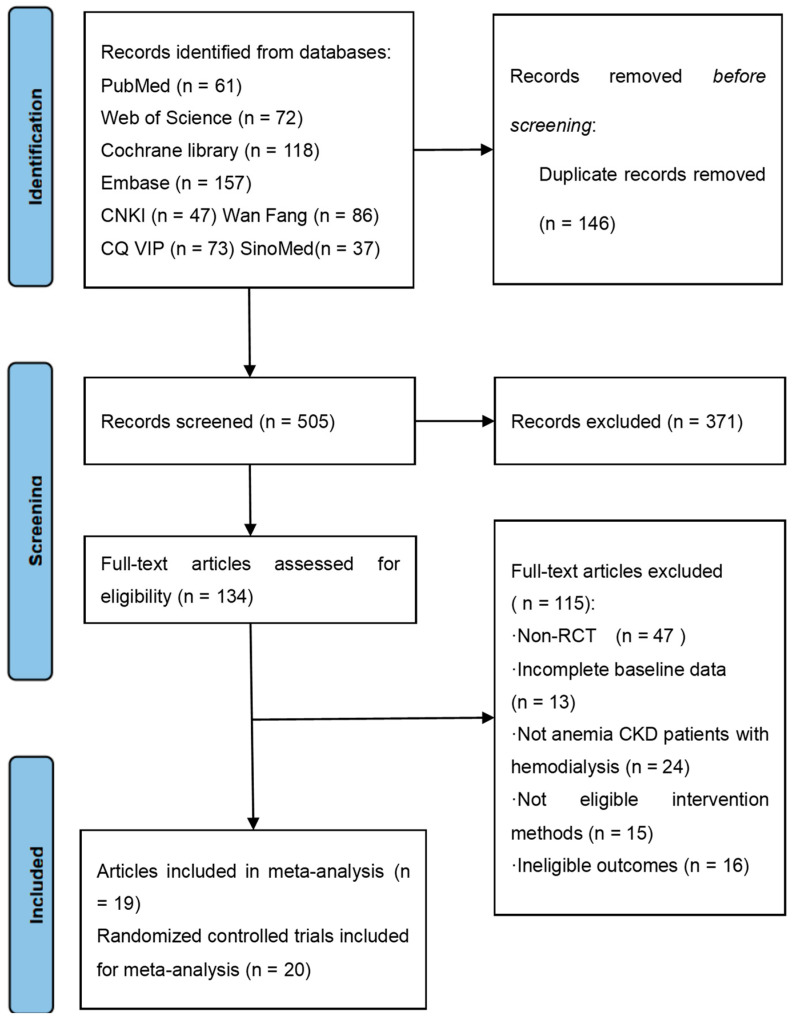
Methods: A thorough search was performed across eight databases, including PubMed, Web of Science, Cochrane Library, Embase, Wan Fang, China National Knowledge Infrastructure (CNKI), Chongqing VIP (CQ VIP), and SinoMed to identify randomized clinical trials (RCTs) examining the effectiveness and safety of roxadustat in managing anemia among individuals suffering from CKD and undergoing HD. This search included studies from the inception of these databases to April 2023.
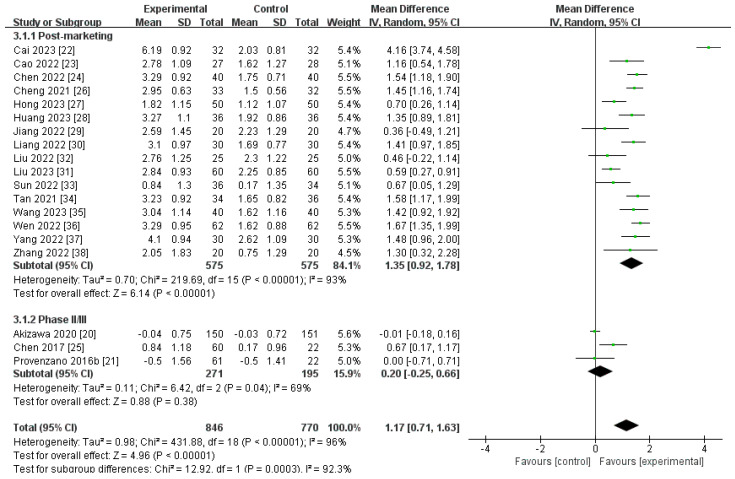
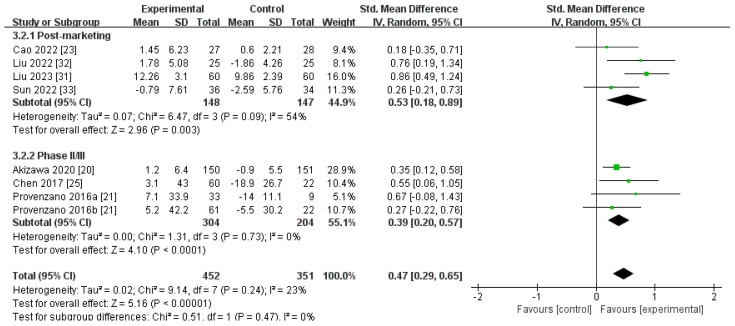
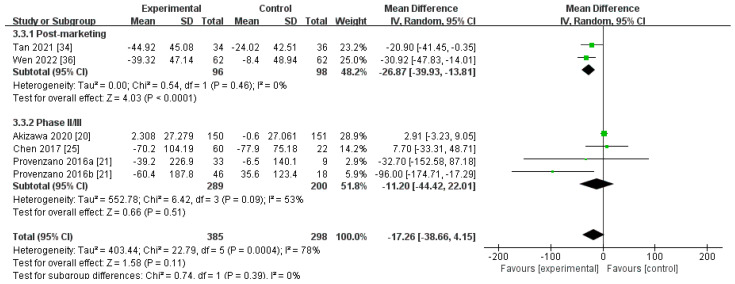
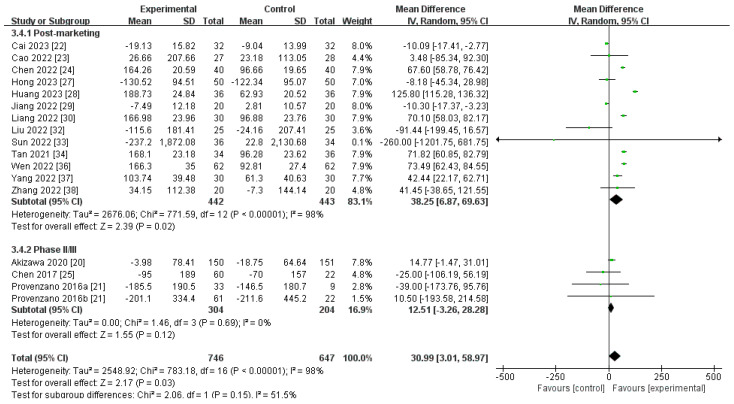
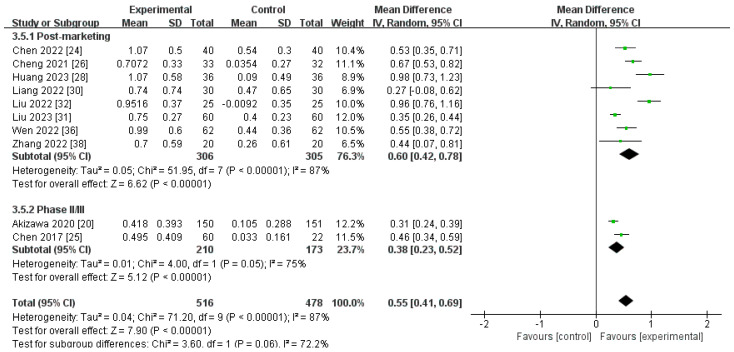
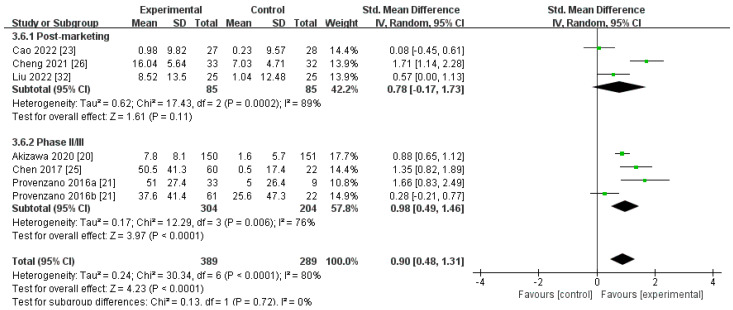
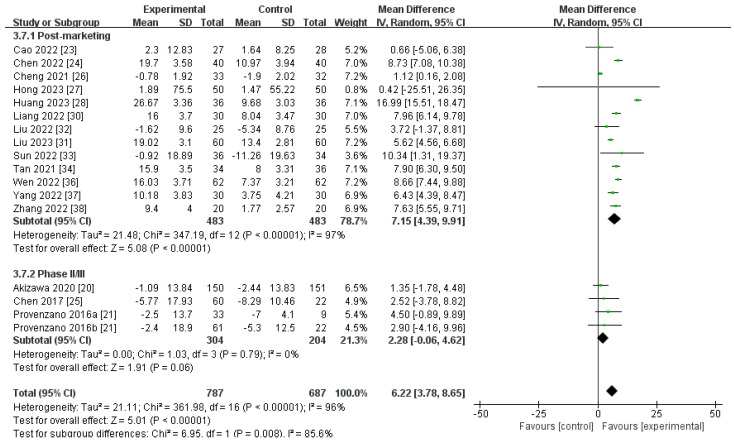
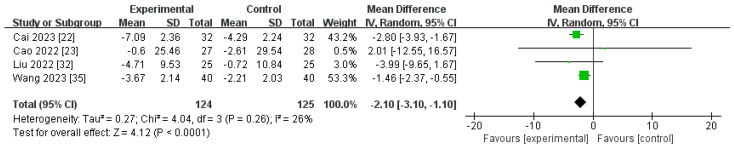
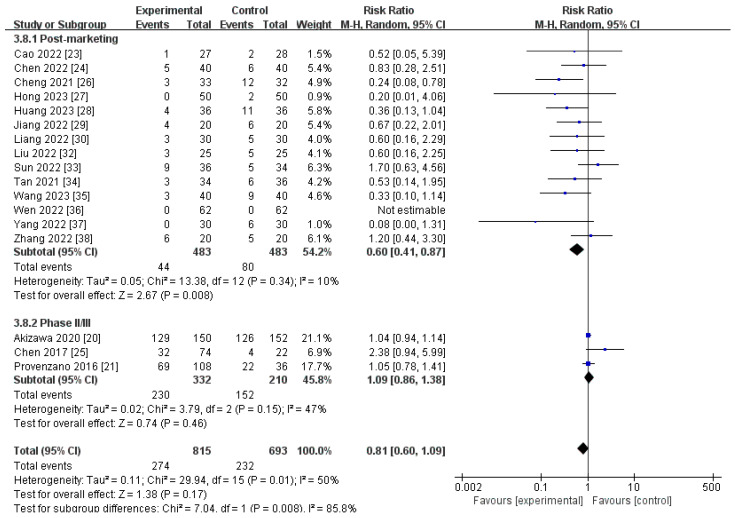
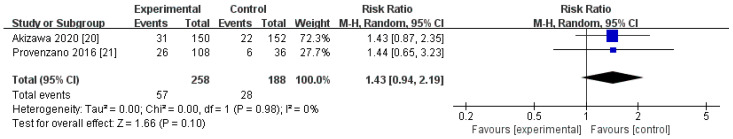
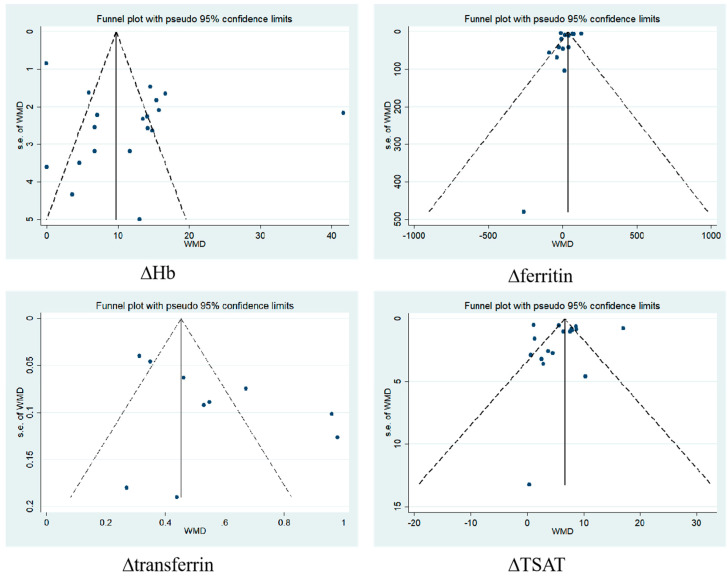
Results: Two phase II, one phase III, and 16 post-marketing studies with 1688 participants were included. Serum iron (SI), transferrin, and total iron-binding capacity (TIBC) levels changed from baseline (∆SI, ∆transferrin, and ∆TIBC) and were significantly more increased for roxadustat than for erythropoiesis-stimulating agents (ESAs): MD 2.55, (95% CI 1.51 to 3.60), p < 0.00001; MD 0.55, (95% CI 0.41 to 0.69), p < 0.00001; and MD 6.54, (95% CI 4.50 to 8.59), p < 0.00001, respectively. Roxadustat was not inferior to ESAs with regard to increasing Hb (∆Hb) levels [MD 1.17 (95% CI 0.71 to 1.63), p < 0.00001] (g/dL). No statistically significant distinctions of the ∆ferritin, ∆hepcidin, and transferrin saturation (TSAT) from baseline (∆TSAT) level were identified between roxadustat and ESAs. C-reactive protein (CRP) levels changed from baseline (∆CRP) and were significantly more reduced for roxadustat than for ESAs. As for safety, the analysis indicated no notable difference in the occurrence of adverse events (AEs) and serious adverse events (SAEs) between roxadustat and ESAs.
Conclusions: This meta-analysis demonstrated that roxadustat outperformed ESAs in enhancing SI, transferrin, and TIBC levels while also decreasing CRP levels. Roxadustat was not inferior to ESAs in terms of improving Hb levels and safety. These findings suggest that roxadustat was well tolerated and a potent alternative to ESAs in managing anemia among patients suffering from CKD and undergoing HD.
Keywords: anemia; chronic kidney disease; hemodialysis; meta-analysis; roxadustat.
Conflict of interest statement
The authors declare no conflicts of interest.
Figures
Similar articles
-
Efficacy and Safety of Roxadustat in Chinese Hemodialysis Patients: A Systematic Review and Meta-Analysis.J Clin Med. 2023 Mar 23;12(7):2450. doi: 10.3390/jcm12072450. J Clin Med. 2023. PMID: 37048535 Free PMC article. Review.
-
The Efficacy and Safety of Roxadustat for Anemia in Patients With Chronic Kidney Disease: A Meta-Analysis.Front Pharmacol. 2022 Apr 26;13:779694. doi: 10.3389/fphar.2022.779694. eCollection 2022. Front Pharmacol. 2022. PMID: 35559232 Free PMC article.
-
The efficacy and safety of roxadustat for anemia in patients with dialysis-dependent chronic kidney disease: a systematic review and meta-analysis.Ren Fail. 2023 Dec;45(1):2195011. doi: 10.1080/0886022X.2023.2195011. Ren Fail. 2023. PMID: 37489561 Free PMC article.
-
Risk of infection in roxadustat treatment for anemia in patients with chronic kidney disease: A systematic review with meta-analysis and trial sequential analysis.Front Pharmacol. 2022 Sep 16;13:967532. doi: 10.3389/fphar.2022.967532. eCollection 2022. Front Pharmacol. 2022. PMID: 36188528 Free PMC article.
-
Safe and Effective Treatment for Anemic Patients With Chronic Kidney Disease: An Updated Systematic Review and Meta-Analysis on Roxadustat.Front Pharmacol. 2021 Jul 2;12:658079. doi: 10.3389/fphar.2021.658079. eCollection 2021. Front Pharmacol. 2021. PMID: 34276361 Free PMC article.
Cited by
-
Blood Trihalomethanes and Human Cancer: A Systematic Review and Meta-Analysis.Toxics. 2025 Jan 16;13(1):60. doi: 10.3390/toxics13010060. Toxics. 2025. PMID: 39853058 Free PMC article. Review.
References
-
- Babitt J.L., Eisenga M.F., Haase V.H., Kshirsagar A.V., Levin A., Locatelli F., Małyszko J., Swinkels D.W., Tarng D.C., Cheung M., et al. Controversies in optimal anemia management: Conclusions from a Kidney Disease: Improving Global Outcomes (KDIGO) Conference. Kidney Int. 2021;99:1280–1295. doi: 10.1016/j.kint.2021.03.020. - DOI - PubMed
Grants and funding
LinkOut - more resources
Full Text Sources
Research Materials
Miscellaneous
