. 2024 Nov 27;12(12):856.
doi: 10.3390/toxics12120856.

Ethyltoluenes Regulate Inflammatory and Cell Fibrosis Signaling in the Liver Cell Model

Affiliations

Ethyltoluenes Regulate Inflammatory and Cell Fibrosis Signaling in the Liver Cell Model

Suryakant Niture et al. Toxics. .

Abstract

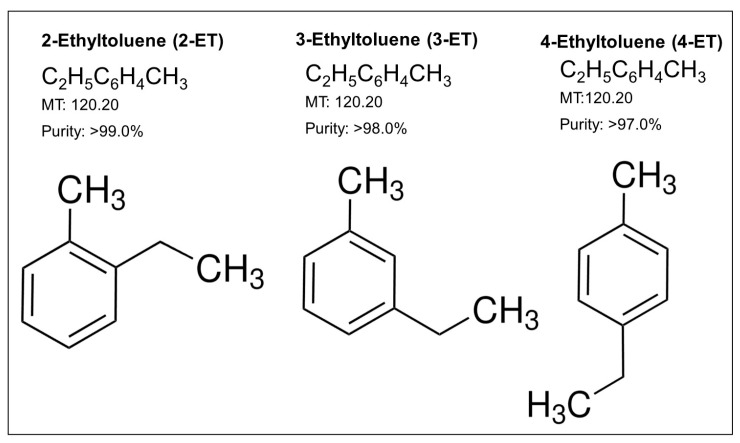
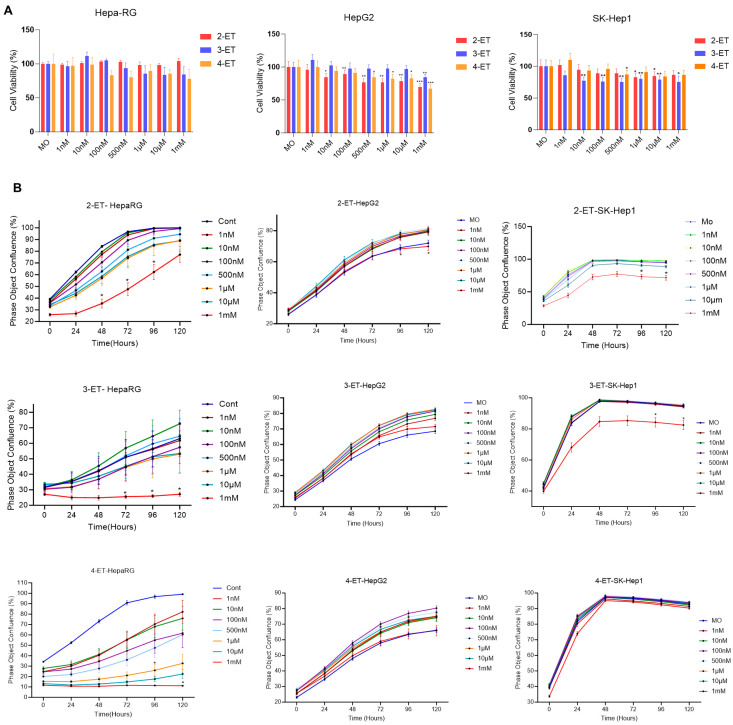
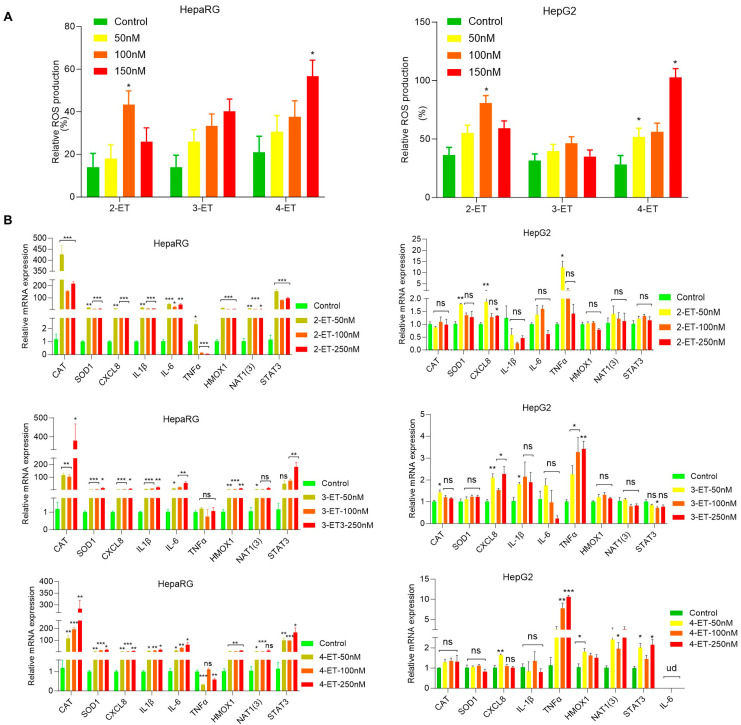
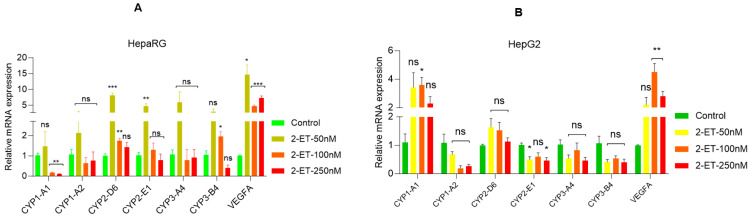
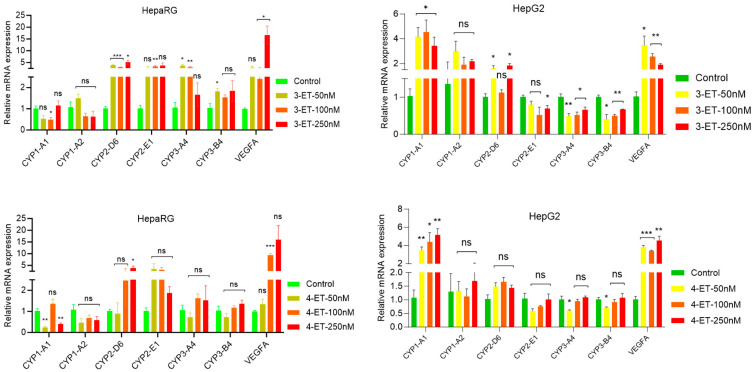
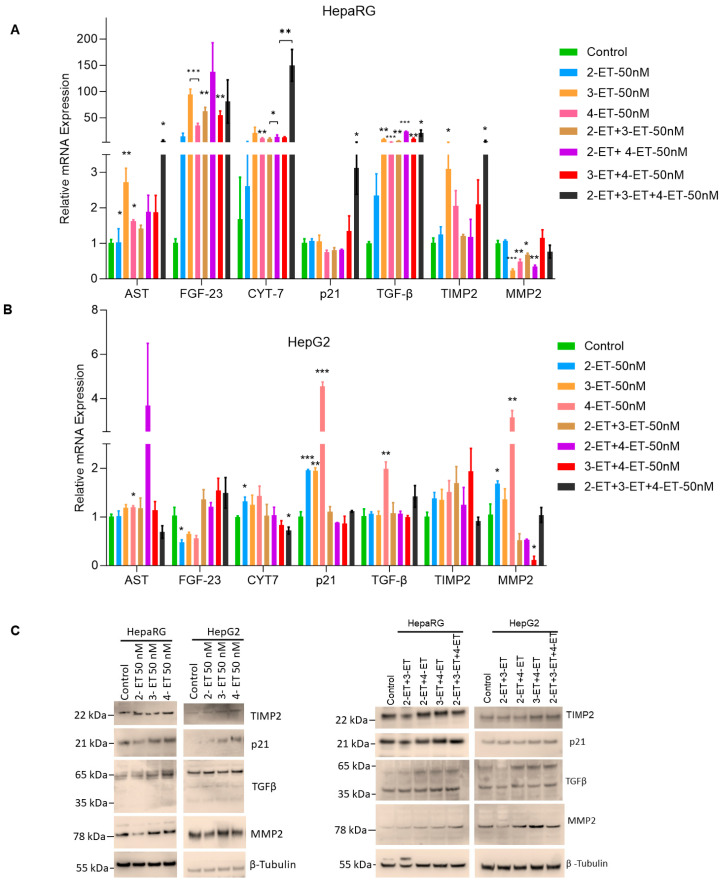
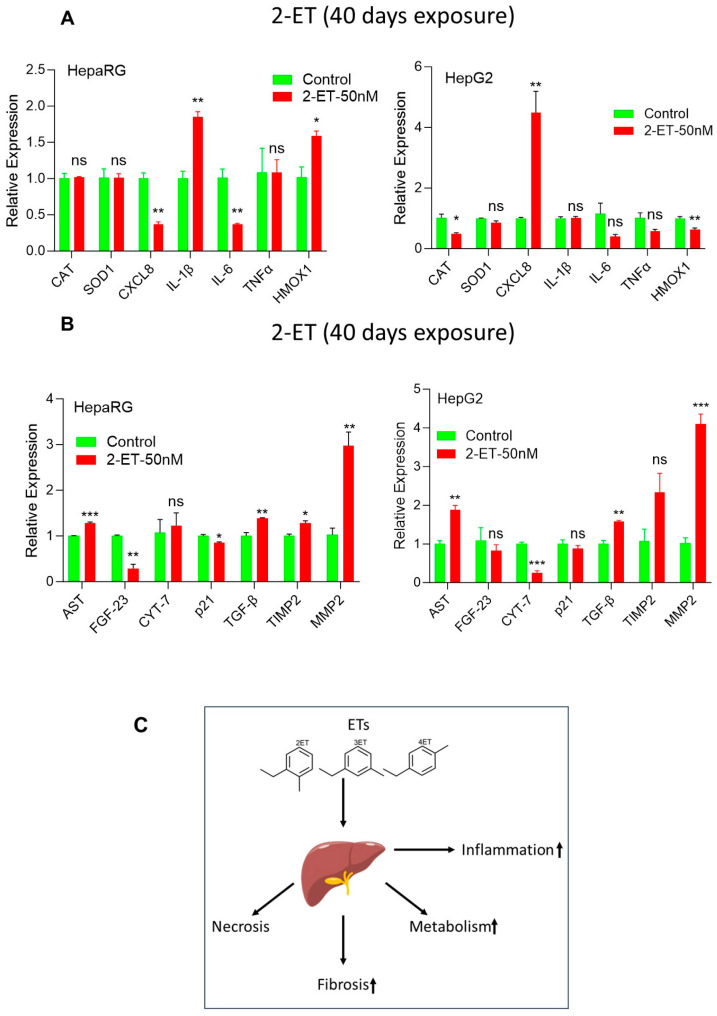
Crude oil naphtha fraction C9 alkylbenzenes consist of trimethylbenzenes, ethyltoluenes, cumene, and n-propylbenzene. The major fraction of C9 alkylbenzenes is ethyltoluenes (ETs) consisting of three isomers: 2-ethyltoluene (2-ET), 3-ethyltoluene (3-ET), and 4-ethyltoluene (4-ET). Occupational and environmental exposure to ETs can occur via inhalation and ingestion and cause several health problems. Exposure to ETs causes eye and upper respiratory tract irritation, coughing, gagging, vomiting, griping, diarrhea, distress, and depressed respiration. Previous studies suggest that ETs target the respiratory tract and liver and produce several lesions in the nose, lungs, and liver areas. In the current study, we investigated the impact of low concentrations of ETs on cell metabolism, cell inflammation, steatosis, and fibrosis signaling in liver cell models in vitro. Dose-dependent exposure of 2-ET, 3-ET, and 4-ET to HepaRG and hepatocellular carcinoma (HCC) HepG2 and SK-Hep1 cells affects cell survival/real-time proliferation and increases ROS production. ETs induce inflammatory CAT, SOD1, CXCL8, IL1B, HMOX1, NAT1 (3), and STAT3 gene expression. Exposure of 2-ET, 3-ET, and 4-ET to HepaRG and HCC HepG2 and SK-Hep1 cells affects mitochondrial respiration/cellular energetics and upregulates metabolic CYP1-A1, CYP1-A2, CYP2-D6, CYP2-E1, CYP3-A4, CYP3-B4, and VEGFA gene expression. However, no significant change in lipogenesis-related gene expression and modulation of cell steatosis was observed after ET exposure. Acute exposure to induvial ETs and in combination or chronic 2-ET exposure alone modulates cell fibrosis markers such as AST, FGF-23, Cyt-7 p21, TGFβ, TIMP2, and MMP2 in liver cell models, suggesting that ETs target liver cells and may dysregulate liver function.

Keywords: cell proliferation; ethyltoluenes; fibrosis; inflammation; liver cell models; steatosis.


Conflict of interest statement

The authors declare that they have no conflicts of interest.

Figures

Figure 1
Figure 1
Chemical structures of ETs. The molecular weights and purities of ETs used in this study are presented.
Figure 2
Figure 2
ETs affect cell proliferation in liver cells. (A) HepaRG and HCC HepG2 and SK-Hep1 cells were cultured in 96-well plates (5000 cells/well), and after 16 h, cells were exposed to 1 nM to 1 mM concentrations of ETs for 72 h. MTT cell viability assay was performed, and relative cell survival was analyzed (left, middle, and right panels). * p < 0.05, ** p < 0.01, *** p < 0.001 compared to the control cells. (B) HepaRG, HepG2, and SK-Hep1 cells cultured in 96-well plates (2500 cells/well) and treated with 1 nM to 1 mM concentrations of 2-ET, 3-ET, and 4-ET, and the effect of ETs on real-time cell proliferation was analyzed by Incucyte (Sartorius). * p < 0.05 compared with control (MO) cells.
Figure 3
Figure 3
ET exposure induced reactive oxygen production and inflammatory signaling in liver cells. (A) HepaRG and HepG2 cells were cultured in 96-well plates in triplicates for 12 h, and cells were further treated with ETs (50-250 nM) as indicated for 72  h. The endogenous ROS-related green fluorescence was quantified using the FLUOstar® Omega plate reader using excitation/emission at 485  nm/520  nm and plotted. * p  <  0.05, compared with control cells. (B) RT/qPCR: HepaRG and HepG2 cells were treated with the indicated concentration of ETs for 72  h. The expressions of inflammatory genes were analyzed by RT/qPCR as described in the Materials and Methods section. * p  <  0.05, ** p  <  0.01, and *** p  <  0.001 compared with untreated cells. ns—not significant.
Figure 4
Figure 4
ET exposure modulates drug metabolic gene expression in liver cells. (A,B) HepaRG and HepG2 cells were treated with the indicated concentrations of ETs (50 nM–250 nM) for 72  h. The drug metabolic gene expressions were analyzed by RT/qPCR as described in the Materials and Methods section. * p  <  0.05, ** p  <  0.01, and *** p  <  0.001 compared with untreated cells. ns—not significant.
Figure 4
Figure 4
ET exposure modulates drug metabolic gene expression in liver cells. (A,B) HepaRG and HepG2 cells were treated with the indicated concentrations of ETs (50 nM–250 nM) for 72  h. The drug metabolic gene expressions were analyzed by RT/qPCR as described in the Materials and Methods section. * p  <  0.05, ** p  <  0.01, and *** p  <  0.001 compared with untreated cells. ns—not significant.
Figure 5
Figure 5
ET exposure increases cell fibrosis in liver cells. (A,B) HepaRG and HepG2 cells were treated with ETs (50 nM) as indicated for 72  h. The expressions of cell fibrosis genes were analyzed by RT/qPCR as described in the Materials and Methods section. * p  <  0.05, ** p  <  0.01, and *** p  <  0.001 compared with untreated cells. (C) The effect of 2-ET, 3-ET, and 4-ET alone or in combination (50 nM each as indicated) on the expression of cell fibrosis proteins was analyzed by immunoblotting.
Figure 6
Figure 6
Chronic 2-ET exposure increases liver cell inflammation and cell fibrosis signaling. (A,B) HepaRG and HepG2 cells were treated with 2-ET (50 nM) for 40 days. The expression of inflammatory genes (A) and cell fibrosis genes (B) were analyzed by RT/qPCR. * p  <  0.05, ** p  <  0.01, and *** p  <  0.001 compared with untreated cells. (C) A schematic representation shows the possible role of ETs in the regulation of inflammation, metabolism, and cell fibrosis signaling in the liver. ns—not significant.

Similar articles

References

    1. Schmidt R., Griesbaum K., Behr A., Biedenkapp D., Voges H.-W., Garbe D., Paetz C., Collin G., Mayer D., Höke H. Ullmann’s Encyclopedia of Industrial Chemistry. Wiley & Sons; Hoboken, NJ, USA: 2014. Hydrocarbons; pp. 1–74. - DOI
    1. Atanda L.A., Aitani A.M., Al-Khattaf S.S. Experimental and kinetic studies of ethyltoluenes production via different alkylation reactions. Chem. Eng. Res. Des. 2015;95:34–46. doi: 10.1016/j.cherd.2015.01.001. - DOI
    1. Masekameni M.D., Moolla R., Gulumian M., Brouwer D. Risk Assessment of Benzene, Toluene, Ethyl Benzene, and Xylene Concentrations from the Combustion of Coal in a Controlled Laboratory Environment. Int. J. Environ. Res. Public Health. 2018;16:95. doi: 10.3390/ijerph16010095. - DOI - PMC - PubMed
    1. Laurence M., Kibet J.K., Ngari S.M. The Degradation of O-ethyltoluene and 1,3,5-Trimethylbenzene in Lake Naivasha Wetland, Kenya. Bull. Environ. Contam. Toxicol. 2018;101:288–293. doi: 10.1007/s00128-018-2387-4. - DOI - PubMed
    1. McMullin T.S., Bamber A.M., Bon D., Vigil D.I., Van Dyke M. Exposures and Health Risks from Volatile Organic Compounds in Communities Located near Oil and Gas Exploration and Production Activities in Colorado (U.S.A.) Int. J. Environ. Res. Public Health. 2018;15:1500. doi: 10.3390/ijerph15071500. - DOI - PMC - PubMed

Grants and funding

LinkOut - more resources