. 2024 Nov 27;12(12):857.
doi: 10.3390/toxics12120857.

Modulation of Paracetamol-Induced Hepatotoxicity by Acute and Chronic Ethanol Consumption in Mice: A Study Pilot

Affiliations

Modulation of Paracetamol-Induced Hepatotoxicity by Acute and Chronic Ethanol Consumption in Mice: A Study Pilot

Allan Cristian Gonçalves et al. Toxics. .

Abstract

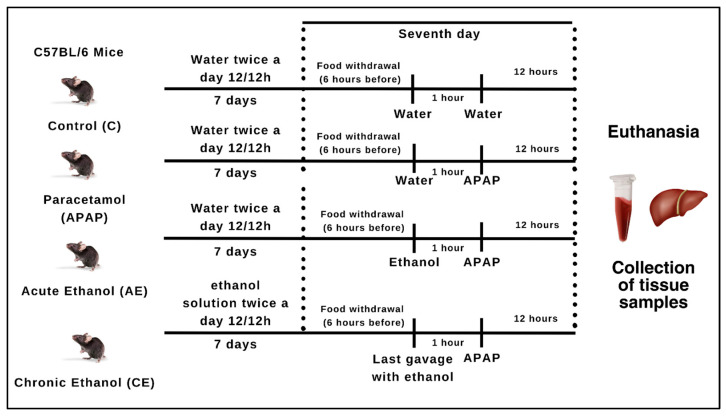
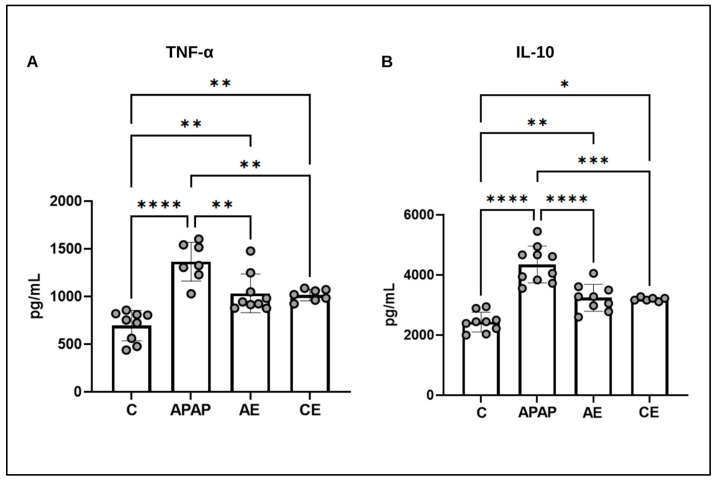
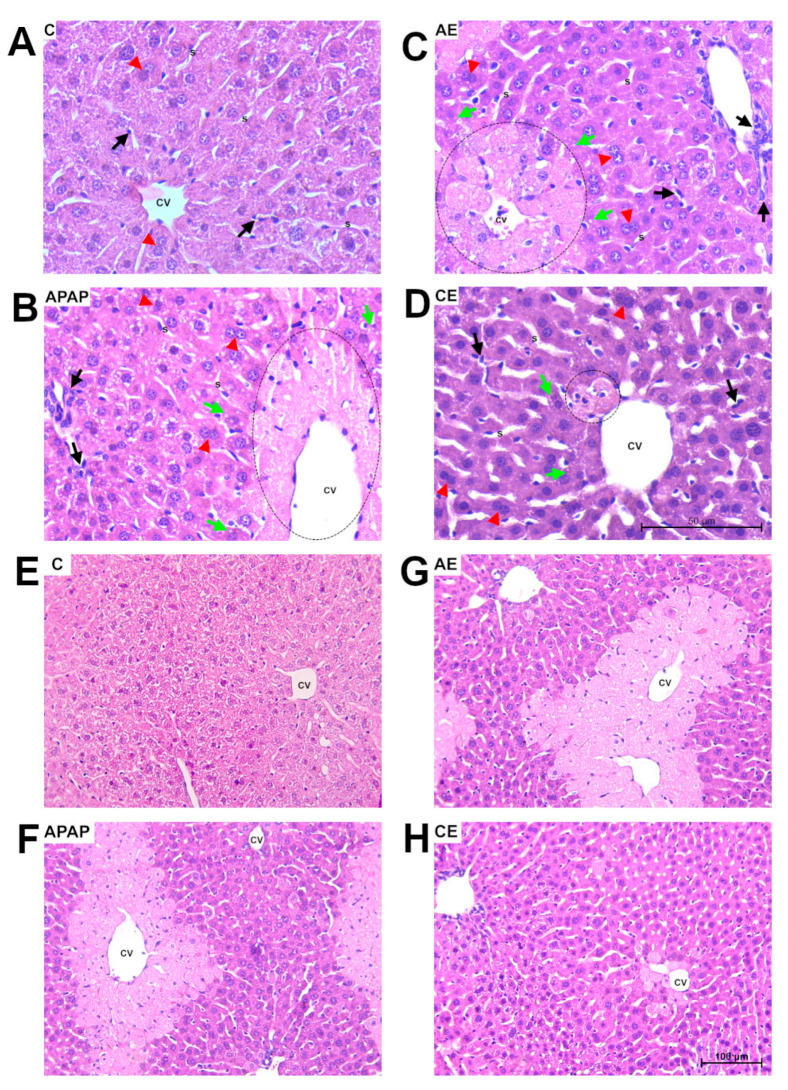
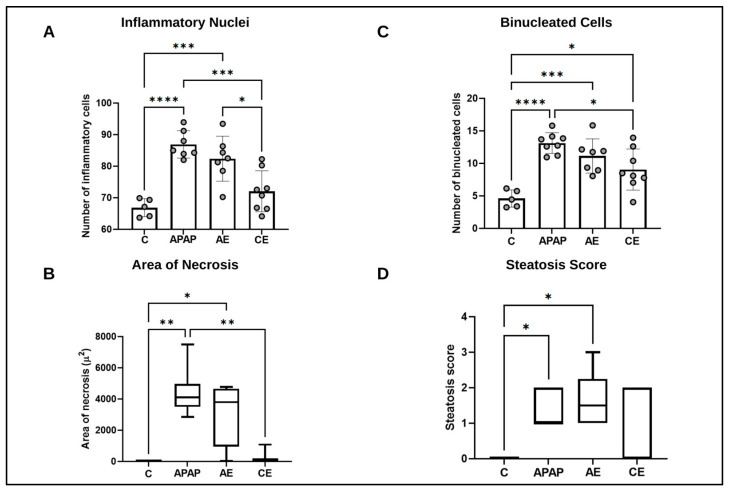
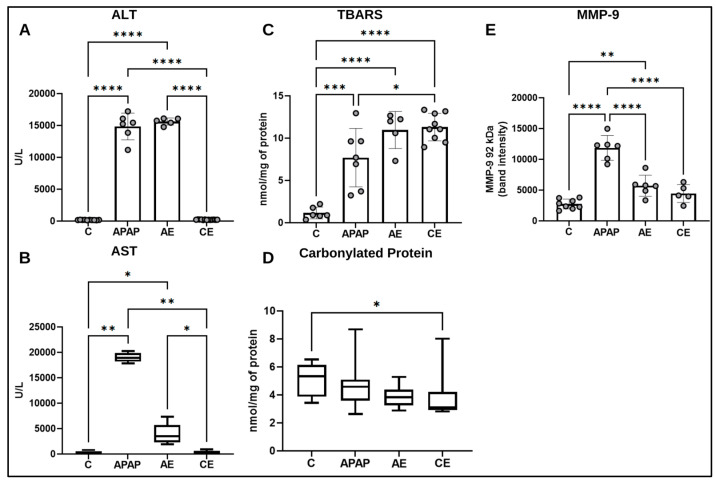
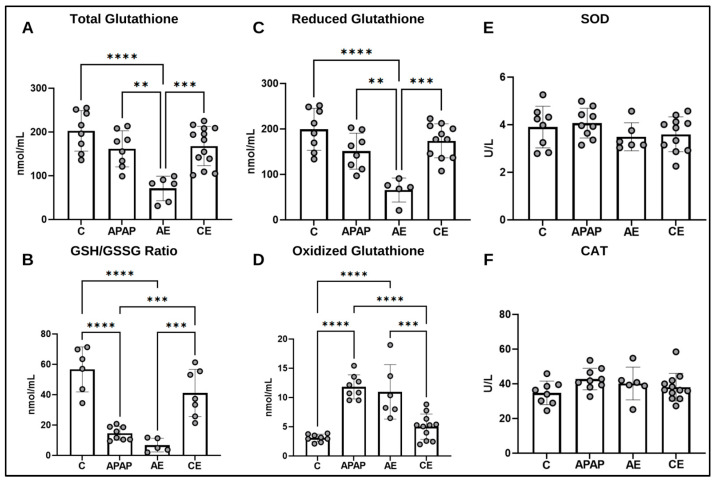
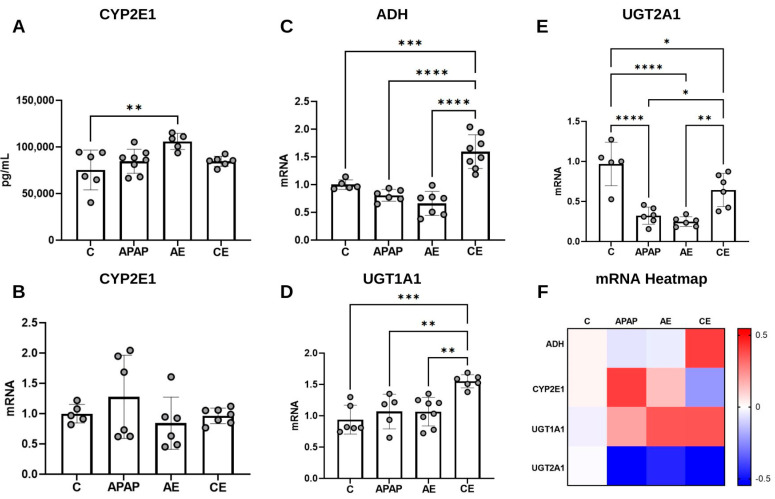
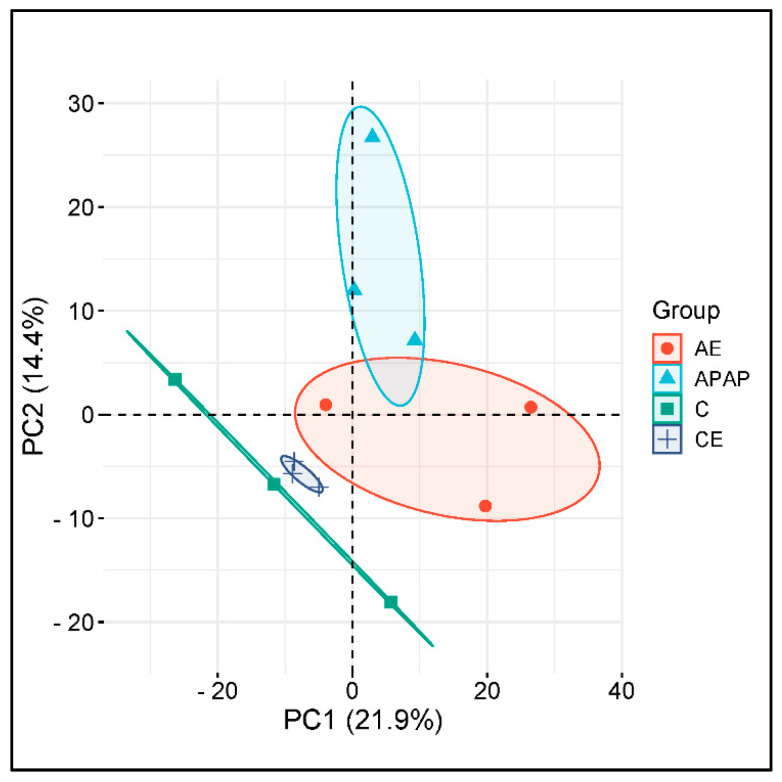
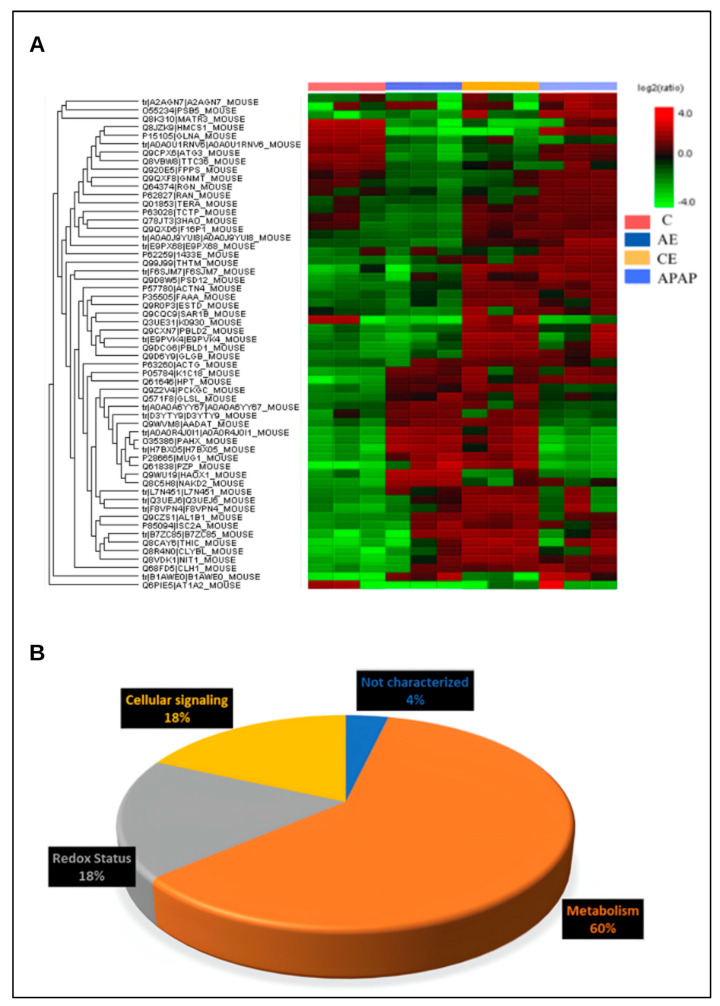
Paracetamol (APAP) overdose is the leading cause of drug-induced liver injury, leading to acute liver failure. However, the role of concurrent acute or chronic ethanol ingestion in this context requires further clarification. In this study, we investigated the effects of acute and chronic ethanol ingestion on APAP-induced hepatotoxicity. Male C57BL/6 mice were randomly allocated into four groups: control (C; water 2×/day for 7 days); APAP (single dose of APAP, 500 mg/kg); acute ethanol (AE; a single ethanol dose-10 mL/kg, and one hour later an overdose of APAP-500 mg/kg); chronic ethanol (CE; ethanol-10 mL/kg, 2×/day for 7 days; and on the last day, an overdose of APAP-500 mg/kg). The results showed that AE induced heightened liver damage, increased necrotic area, and elevated levels of ALT, AST, TBARS, and oxidized glutathione compared to the control group. The AE group exhibited diminished glutathione availability and elevated CYP2E1 levels compared to the other groups. CE maintained a hepatic profile similar to that of the control group in terms of necrosis index, ALT and AST levels, GSH/GSSG ratio, and CYP2E1 activity, along with the upregulation of gene expression of the glucuronidation enzyme compared to the APAP group. Proteomic analysis revealed that the AE protein profile closely resembled that of the APAP group, whereas the C and CE groups were clustered together. In conclusion, ethanol consumption differentially modulated APAP overdose-induced liver damage. Acute consumption exacerbated hepatotoxicity, similar to an APAP overdose alone, whereas chronic consumption appeared to mitigate this injury, at least within the parameters assessed in this study.

Keywords: acetaminophen; alcohol; ethanol; hepatotoxicity; liver damage; oxidative stress; paracetamol.


Conflict of interest statement

The authors declare no conflicts of interest.

Figures

Figure 1
Figure 1
Experimental design. Source: Illustration created by the author himself through the website canva.com.
Figure 2
Figure 2
Assessment of the serum inflammatory profile using TNF-α (A) and IL-10 (B) measurements. Statistical analysis was performed using the one-way ANOVA test and Bonferroni post-test. TNF-α: Tumor necrosis factor alpha; IL-10: Interleukin 10. (*) represents a significant difference between groups. **** (p < 0.0001); *** (p < 0.001); ** (p < 0.01), and * (p < 0.05).
Figure 3
Figure 3
Histopathological aspects of the liver parenchyma. Photomicrographs of liver sections stained with hematoxylin and eosin. Bar = 50 μm, 400× magnification (AD) and Bar = 100 μm, 200× magnification (EH). (A,E) Representative image of the control group (C). (B,F) Representative image of the lesions found in the group treated with paracetamol (APAP). (C,G) Representative image of the group treated with acute ethanol (AE). (D,H) Representative image of the group treated with chronic ethanol (CE). In (A,E) preserved liver parenchyma, the presence of inflammatory cells in a normal pattern (black arrow), preserved sinusoidal capillaries (S), and few binucleated hepatocytes (red triangle). (B,C) Fatty degeneration (green arrow), binucleated hepatocytes (red triangle), area of extensive necrosis (dotted circle), and inflammatory infiltrates (black arrow). (D) Fatty degeneration (green arrow), binucleated hepatocytes (red triangle), and area of necrosis to a lesser extent (dotted circle), central vein (CV).
Figure 4
Figure 4
Morphometric and semiquantitative analyses of the liver in relation to inflammatory nuclei (Panel A), binucleated cells (Panel B), area of necrosis (Panel C), and steatosis score (Panel D). (C) Control group; (APAP) paracetamol group; (AE) acute ethanol group; (CE) chronic ethanol group. For results, number of inflammatory nuclei, number of binucleated cells, and area of necrosis, data were expressed as mean ± standard deviation of the mean and were analyzed by (one-way ANOVA) followed by the Bonferroni post-test. For the non-parametric results of necrosis area and steatosis score, data were expressed as the median and interquartile range (25th–75th percentile) and analyzed using the Kruskal–Wallis test followed by Dunn’s post hoc test. (*) represents a significant difference between groups. **** (p < 0.0001); *** (p < 0.001); ** (p < 0.01), and * (p < 0.05).
Figure 5
Figure 5
Assessment of markers of liver damage by evaluating the activities of ALT (A), AST (B), the concentration of TBARS (C), carbonylated protein (D), and the activity of MMP-9 (E). Statistical analysis for ALT, TBARS, and MMP-9 was performed using the one-way ANOVA test and Bonferroni post-test. For the statistical analysis of AST and carbonylated protein data, the Kruskal-Wallis test was applied, followed by the Dunns post-test. ALT: Alanine aminotransferase; AST: Aspartate aminotransferase; TBARS: Substances reactive to thiobarbituric acid; MMP-9: Matrix metalloproteinase—9. (*) represents a significant difference between groups. **** (p < 0.0001); *** (p < 0.001); ** (p < 0.01) and * (p < 0.05).
Figure 6
Figure 6
Assessment of the hepatic antioxidant profile by evaluating the levels of total glutathione (A), GSH/GSSG ratio (B), oxidized glutathione (C), reduced glutathione (D), SOD (E), and CAT (F). Statistical analysis was performed using the one-way ANOVA test and Bonferroni post-test. GSH: Reduced glutathione; GSSG: Oxidized glutathione; SOD: Superoxide dismutase; CAT: Catalase. (*) represents a significant difference between groups. **** (p < 0.0001); *** (p < 0.001), and ** (p < 0.01).
Figure 7
Figure 7
Assessment of hepatic CYP2E1 concentration (A), CYP2E1 gene expression (B), ADH (C), UGT1A1 (D), UGT2A1 (E) and gene expression heatmap (F). Statistical analysis for CYP2E1 concentration and expression of CYP2E1, ADH, and UGT2A1 genes was performed using the one-way ANOVA test and Bonferroni post-test. For statistical analysis of UGT1A1 gene expression data, the Kruskal–Wallis test was applied, followed by Dunn’s post-test. CYP2E1: cytochrome P450 2E1; ADH: Alcohol dehydrogenase; UGT1A1: Glucuronosyltransferase Family 1 Member A1; UGT2A1: Glucuronosyltransferase Family 2 Member A1. (*) represents a significant difference between groups. **** (p < 0.0001); *** (p < 0.001); ** (p < 0.01), and * (p < 0.05).
Figure 8
Figure 8
Principal components analysis (PCA). Axes demonstrate principal component 1 and principal component 2, showing 21.9% and 14.4% of the total variance, respectively.
Figure 9
Figure 9
Heatmap of differentially abundant hepatic proteins when comparing different treatments. Red coloring indicates positive regulation, while green coloring indicates negative regulation (A) and classification of proteins according to their biological function (B).

Similar articles

References

    1. Rotundo L., Pyrsopoulos N. Liver injury induced by paracetamol and challenges associated with intentional and unintentional use. World J. Hepatol. 2020;12:125–136. doi: 10.4254/wjh.v12.i4.125. - DOI - PMC - PubMed
    1. Ramachandran A., Jaeschke H. Acetaminophen Hepatotoxicity. Semin Liver Dis. 2019;39:221–234. doi: 10.1055/s-0039-1679919. - DOI - PMC - PubMed
    1. Tittarelli R., Pellegrini M., Scarpellini M.G., Marinelli E., Bruti V., Di Luca N.M., Busardò F.P., Zaami S. Hepatotoxicity of paracetamol and related fatalities. Eur. Rev. Med. Pharmacol. Sci. 2017;21((Suppl. 1)):95–101. - PubMed
    1. Lv L., Ren S., Jiang H., Yan R., Chen W., Yan R., Dong J., Shao L., Yu Y. The oral administration of Lacticaseibacillus casei Shirota alleviates acetaminophen-induced liver injury through accelerated acetaminophen metabolism via the liver-gut axis in mice. mSphere. 2024;9:e0067223. doi: 10.1128/msphere.00672-23. - DOI - PMC - PubMed
    1. Bryan A., Pingali P., Faber A., Landry J., Akakpo J.Y., Jaeschke H., Li H., Lee W.S., May L., Patel B., et al. High dose acetaminophen with concurrent CYP2E1 inhibition has profound anti-cancer activity without liver toxicity. J. Pharmacol. Exp. Ther. 2024;388:209–217. doi: 10.1124/jpet.123.001772. - DOI - PMC - PubMed

LinkOut - more resources