. 2024 Dec 18;12(12):916.
doi: 10.3390/toxics12120916.

Contamination Characteristics of Antibiotic Resistance Genes in Multi-Vector Environment in Typical Regional Fattening House

Affiliations

Contamination Characteristics of Antibiotic Resistance Genes in Multi-Vector Environment in Typical Regional Fattening House

Kai Wang et al. Toxics. .

Abstract

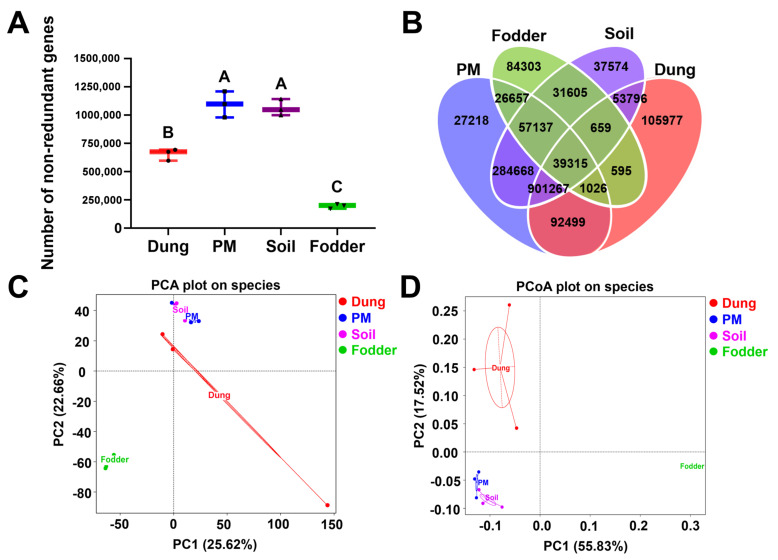
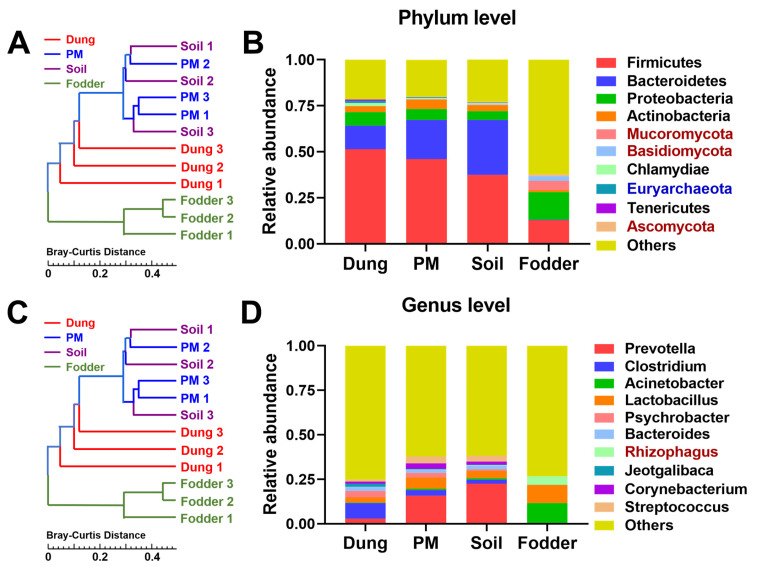
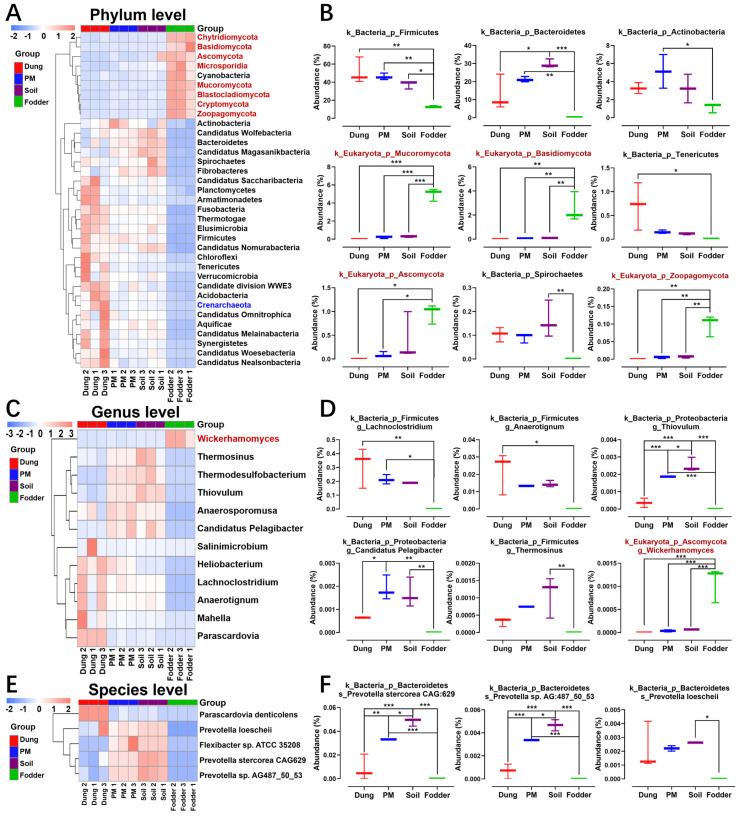
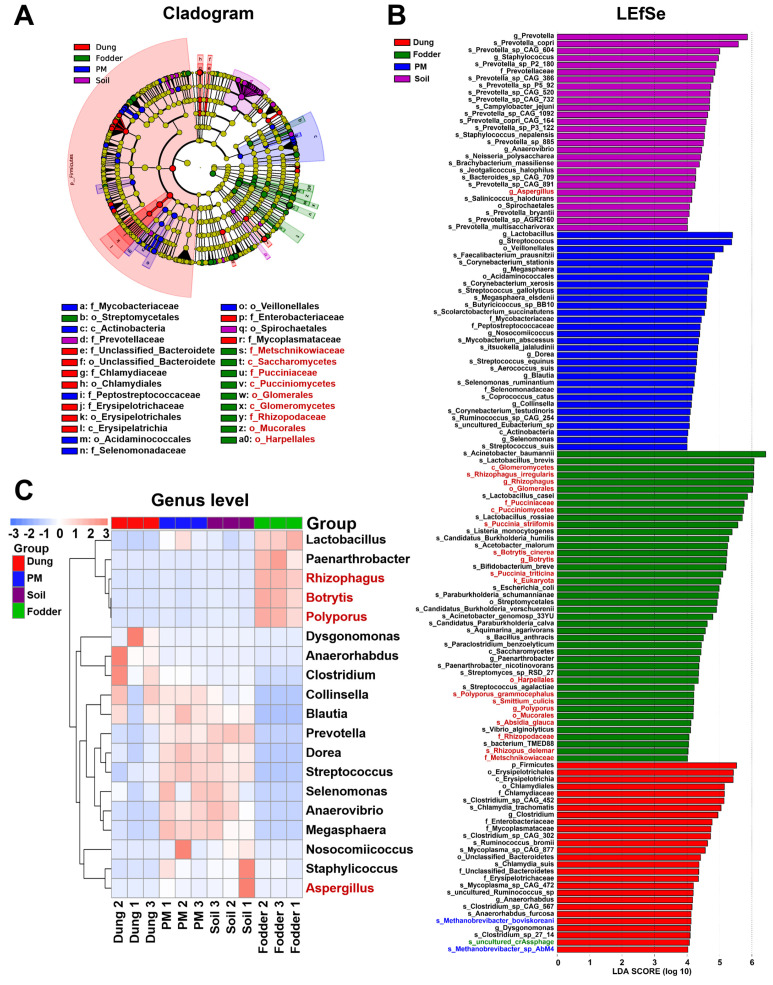
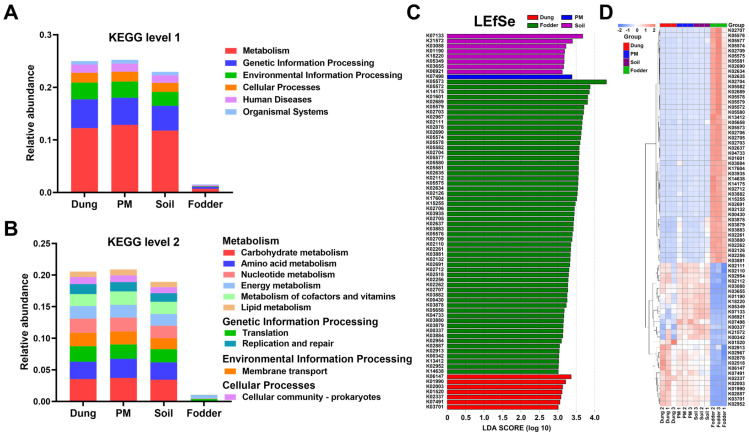
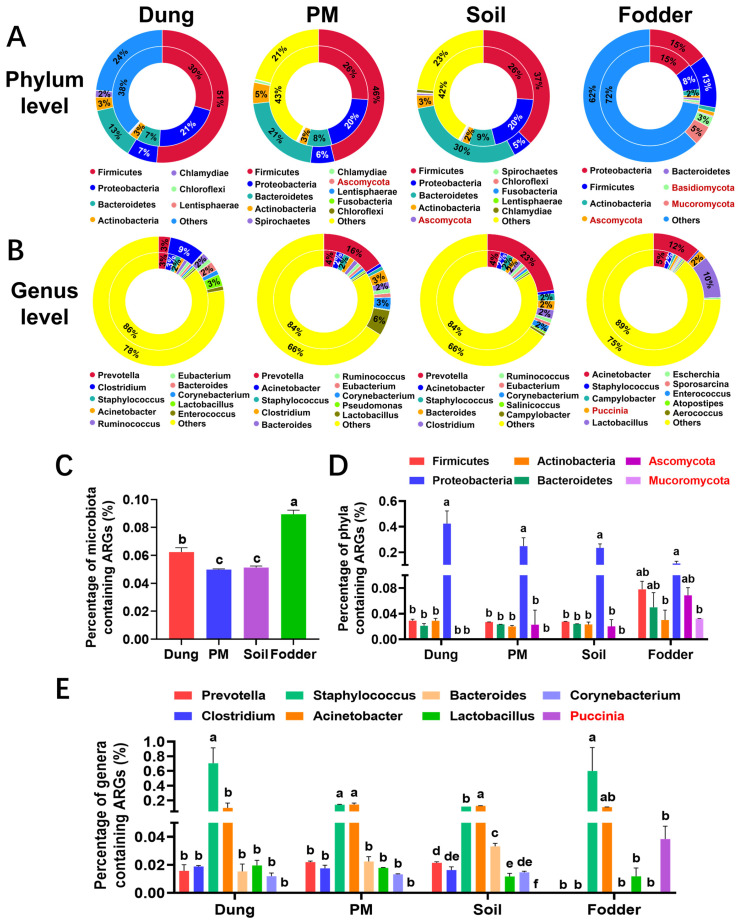
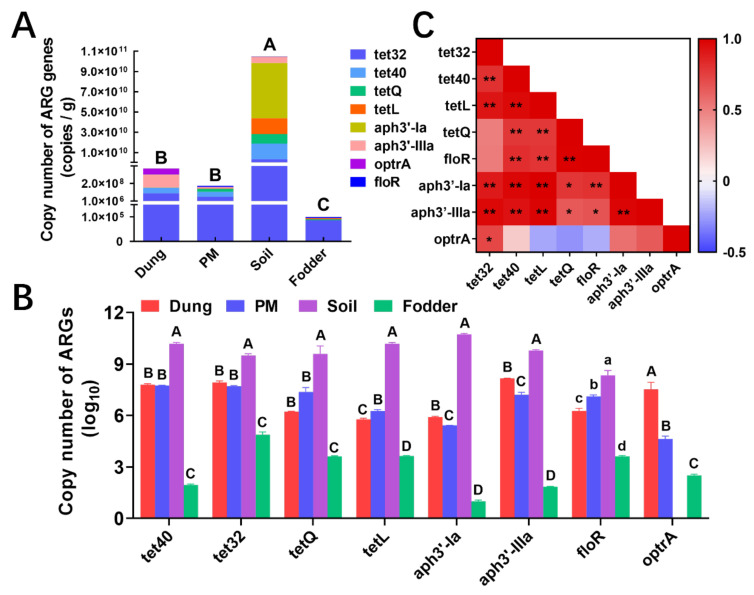
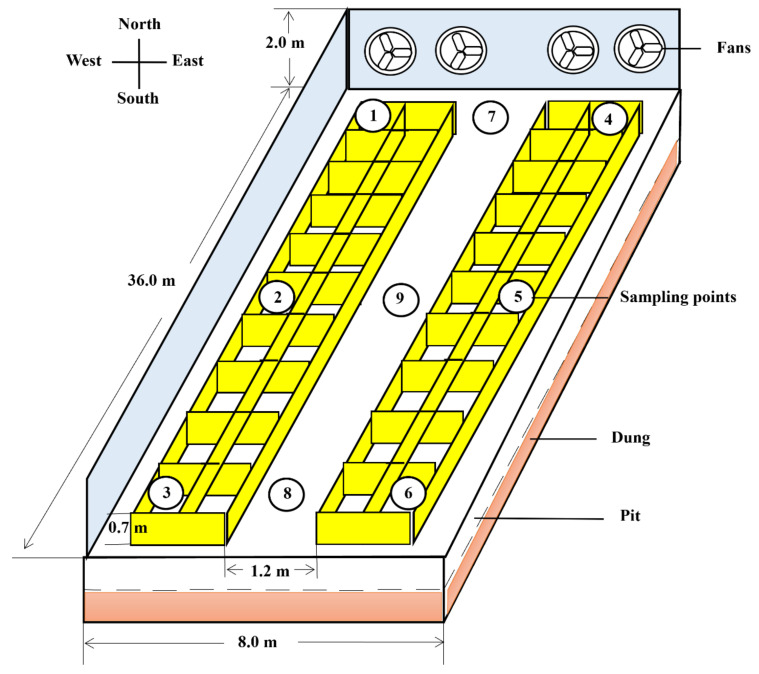
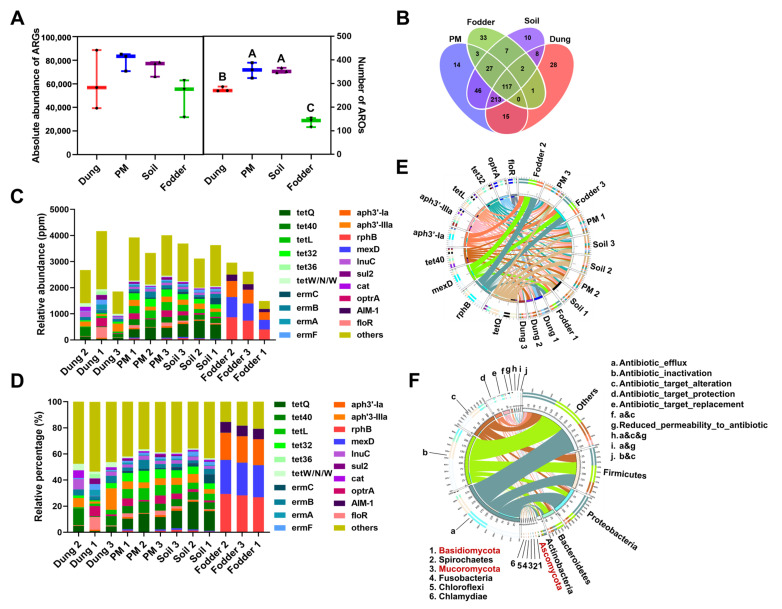
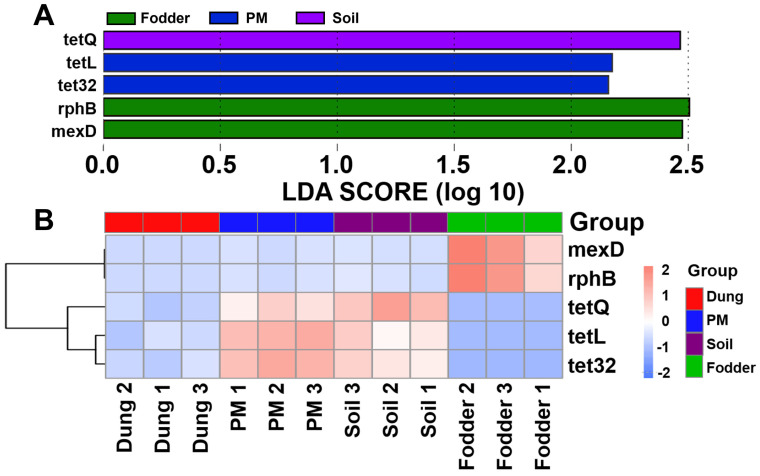
Antibiotic resistance genes (ARGs) are emerging as significant environmental contaminants, posing potential health risks worldwide. Intensive livestock farming, particularly swine production, is a primary contributor to the escalation of ARG pollution. In this study, we employed metagenomic sequencing and quantitative polymerase chain reaction to analyze the composition of microorganisms and ARGs across four vectors in a typical swine fattening facility: dung, soil, airborne particulate matter (PM), and fodder. Surprisingly, soil and PM harbored a higher abundance of microorganisms and ARGs than dung. At the same time, fodder was more likely to carry eukaryotes. Proteobacteria exhibited the highest propensity for carrying ARGs, with proportions 9-20 times greater than other microorganisms. Furthermore, a strong interrelation among various ARGs was observed, suggesting the potential for cooperative transmission mechanisms. These findings underscore the importance of recognizing soil and PM as significant reservoirs of ARGs in swine facilities alongside dung. Consequently, targeted measures should be implemented to mitigate their proliferation, mainly focusing on airborne PM, which can rapidly disseminate via air currents. Proteobacteria, given their remarkable carrying capacity for ARGs with the primary resistance mechanism of efflux, represent a promising avenue for developing novel control strategies against antibiotic resistance.

Keywords: antibiotics resistance gene; fattening house; metagenomics; multi-vector.


Conflict of interest statement

The authors declare no conflict of interest.

Figures

Figure 2
Figure 2
The number of microbial genes and differences of microbial components in different vectors in the fattening swine house. (A) Number of non-redundant genes in dung, PM, soil, and fodder in fattening swine house. Different capital letters represent significant differences between vectors (p < 0.01); the same letters show no significant differences (p > 0.05). (B) A Venn diagram showing the number of standard and unique genes in dung, PM, soil, and fodder in a fattening swine house. (C) Principal component analysis (PCA) based on a linear model was plotted to display microbial composition differences among species-level samples. (D) Principal coordinate analysis (PCoA) based on the Bray–Curtis distance matrix of species. n = 3 per vector.
Figure 3
Figure 3
Clustering and relative abundance of microbial taxa in dung, PM, soil, and fodder in the fattening swine house. (A) Hierarchical clustering tree of microbial taxa at the phylum level. (B) Relative abundance of the top 10 most dominant microbial taxa at the phylum level. (C) Hierarchical clustering tree of microbial taxa at the genus level. (D) Relative abundance of the top 10 most dominant microbial taxa at genus level. n = 3 per vector. Microbes with black, red, and blue fonts indicate that they belong to Bacteria, Eukaryotes, and Archaea kingdoms.
Figure 4
Figure 4
Clustering and abundance comparison of differential microbes at different levels in dung, PM, soil, and fodder in the fattening swine house based on the Metastats analysis method. (A) Clustering heatmap of differential microbial abundance at the phylum level. (B) Comparison of differential microbial abundance at the phylum level (the top 9 most dominant differential phyla). (C) Clustering heatmap of differential microbial abundance at the genus level. (D) Comparison of differential microbial abundance at the genus level (the top 6 most dominant differential genera). (E) Clustering heatmap of differential microbial abundance at the species level. (F) Comparison of differential microbial abundance at the species level (the top 3 most dominant differential species). * p < 0.05, ** p < 0.01, *** p < 0.001. n = 3 per vector. Microbes with black, red, and blue fonts indicate that they belong to the Bacteria, Eukaryotas, and Archaea kingdoms.
Figure 5
Figure 5
Screening of microbial biomarkers with significant differences among different vectors in the fattening swine house based on the linear discriminant analysis (LDA) effect size (LEfSe) analysis. (A) The cladogram shows the significantly enriched microbial taxa (from class to family level). (B) The bar chart shows the LDA score of microbial taxa (from kingdom to species level) in dung, PM, soil, and fodder. (C) Clustering heatmap of featured microbial abundance at the genus level. Significant differences were defined as p < 0.05 and LDA score > 4.0. n = 3 per vector. Microbes with black, red, blue, and green fonts indicate that they belong to the kingdoms of Bacteria, Eukaryotas, Archaea, and Viruses, respectively.
Figure 6
Figure 6
Microbial functional relative abundance and screening and clustering of differential func-tions in dung, PM, soil, and fodder in the fattening swine house. (A) Relative abundance of microbial functional annotations at KEGG level 1. (B) Relative abundance of microbial functional annotations at KEGG level 2. (C) The bar chart shows the LDA score of significantly differential functions at the KO (KEGG orthology) level. Significant differences were defined as p < 0.05 and LDA score > 3.0. (D) Clustering heatmap of differential microbial functions at KO level. n = 3 per vector.
Figure 9
Figure 9
Identification circle diagram of the attribution of ARGs on phylum level (A) and genus level (B) among different vectors in the fattening swine house. The inner circle is the distribution of ARGs, and the outer circle is the distribution of genes in all samples in the group. (C) Percentage of microbiota containing ARGs among different vectors. (D) Percentage of 6 most dominant phyla containing ARGs among different vectors. (E) Percentage of 8 dominant genera containing ARGs among different vectors. n = 3 per vector. Different small letters represent significant differences between vectors (p < 0.05); the same letters show no significant differences (p > 0.05). Microbes with black and red fonts indicate that they belong to the kingdoms of bacteria and eukaryotas, respectively.
Figure 10
Figure 10
Absolute quantification of major ARGs in dung, PM, soil, and fodder in the fattening swine house. (A) Absolute abundance of ARGs in different environmental vectors. Different capital letters represent significant differences between vectors (p < 0.01); the same letters show no significant differences (p > 0.05). (B) Comparison of ARG copy number (based on log10) in different environmental vectors. Different capital letters represent significant differences between vectors (p < 0.01); different lowercase letters represent significant differences between vectors (p < 0.05); the same letters show no significant differences (p > 0.05). (C) Correlation analysis of ARG abundance in environmental vectors by Pearson. * p < 0.05, ** p < 0.01. n = 3 per vector.
Figure 1
Figure 1
Plan view of the fattening house showing the sampling locations for dung, soil, particulate matter (PM), and fodder. ①, ②, ③, ④, ⑤, ⑥ for dung and fodder; ⑦, ⑧ for soil; ⑨ for PM. The diagram was not drawn to scale.
Figure 7
Figure 7
The relative abundance of antibiotic resistance genes (ARGs) in dung, PM, soil, and fodder in the fattening swine house. (A) Absolute abundance of ARGs (left) and several antibiotic resistance ontologies (AROs) (right). Different capital letters represent significant differences between vectors (p < 0.01); the same letters show no significant differences (p > 0.05). (B) A Venn diagram showed the common and unique AROs among different vectors. (C) The relative abundance of the top 20 most dominant AROs accounted for all genes in each sample (The original relative abundance data were magnified 106 times). (D) The top 20 dominant AROs accounted for the relative percentage of all AROs. (E) An overview graph was plotted to display each sample’s abundance ratio of the top 10 most dominant AROs. The left inner and outer circles in the diagram represent the summation of the relative abundance and relative percentage content of AROs across various samples, respectively. On the right side, the summation of the relative abundance and relative percentage content of each ARO within a sample is shown. (F) An overview graph was plotted to reveal the relationships between the resistance mechanisms of ARGs and microbes. The left inner circle of the diagram represents the cumulative number of ARGs within a phylum that possess resistance mechanisms of this type. In contrast, the outer circle represents the relative proportion of ARGs within each phylum that belong to their respective resistance mechanism. The right inner circle displays the cumulative number of ARGs in a phylum across different resistance mechanisms. In contrast, the outer circle illustrates the relative proportion of ARGs within each resistance mechanism that belong to their respective phylum. n = 3 per vector. Microbes with black and red fonts indicate that they belong to the kingdoms of Bacteria and Eukaryotas, respectively.
Figure 8
Figure 8
Screening of ARG biomarkers with significant differences among different vectors in the fattening swine house based on the LEfSe analysis. (A) The bar chart shows the LDA score of ARGs in PM, soil, and fodder. (B) Clustering heatmap of differential ARGs. Significant differences were defined as p < 0.05 and LDA score > 2.0. n = 3 per vector.

Similar articles

References

    1. Wang Y., Zhang Y., Li J., Lin J.G., Zhang N., Cao W. Biogas energy generated from livestock manure in China: Current situation and future trends. J. Environ. Manag. 2021;297:113324. doi: 10.1016/j.jenvman.2021.113324. - DOI - PubMed
    1. Zhu Y.G., Johnson T.A., Su J.Q., Qiao M., Guo G.X., Stedtfeld R.D., Hashsham S.A., Tiedje J.M. Diverse and abundant antibiotic resistance genes in Chinese swine farms. Proc. Natl. Acad. Sci. USA. 2013;110:3435–3440. doi: 10.1073/pnas.1222743110. - DOI - PMC - PubMed
    1. McCarthy G., Lawlor P.G., Gutierrez M., Gardiner G.E. Assessing the biosafety risks of pig manure for use as a feedstock for composting. Sci. Total Environ. 2013;463–464:712–719. doi: 10.1016/j.scitotenv.2013.06.069. - DOI - PubMed
    1. Tang Q., Huang K., Liu J., Shen D., Dai P., Li Y., Li C. Seasonal variations of microbial assemblage in fine particulate matter from a nursery pig house. Sci. Total Environ. 2020;708:134921. doi: 10.1016/j.scitotenv.2019.134921. - DOI - PubMed
    1. Reardon S. Antibiotic use in farming set to soar despite drug-resistance fears. Nature. 2023;614:397. doi: 10.1038/d41586-023-00284-x. - DOI - PubMed

LinkOut - more resources