

Effects of Drought Stress at the Booting Stage on Leaf Physiological Characteristics and Yield of Rice
- PMID: 39771161
- PMCID: PMC11677175
- DOI: 10.3390/plants13243464
Effects of Drought Stress at the Booting Stage on Leaf Physiological Characteristics and Yield of Rice
Abstract
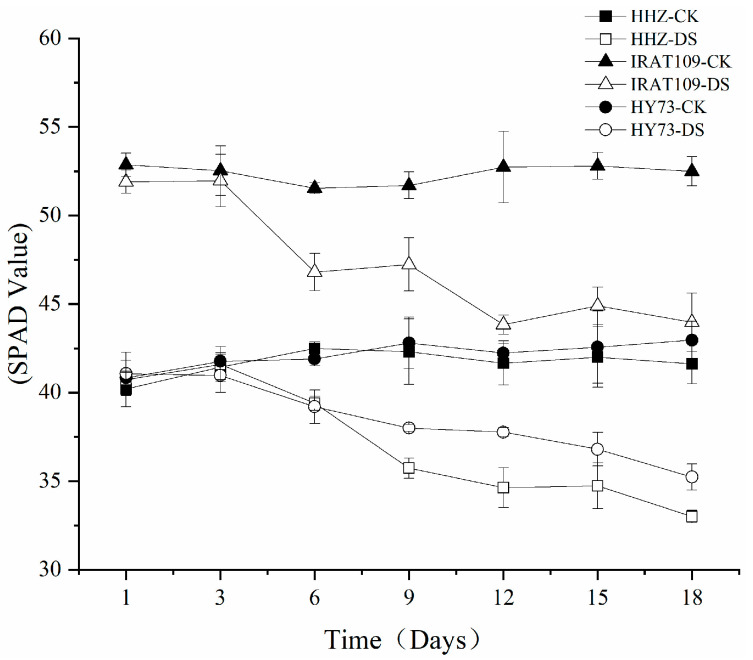
Drought stress is a major environmental constraint that limits rice (Oryza sativa L.) production worldwide. In this study, we investigated the effects of drought stress at the booting stage on rice leaf physiological characteristics and yield. The results showed that drought stress would lead to a significant decrease in chlorophyll content and photosynthesis in rice leaves, which would affect rice yield. Three different rice varieties were used in this study, namely Hanyou73 (HY73), Huanghuazhan (HHZ), and IRAT109. Under drought stress, the chlorophyll content of all cultivars decreased significantly: 11.1% and 32.2% decreases in chlorophyll a and chlorophyll b in HHZ cultivars, 14.1% and 28.5% decreases in IRAT109 cultivars, and 22.9% and 18.6% decreases in HY73 cultivars, respectively. In addition, drought stress also led to a significant decrease in leaf water potential, a significant increase in antioxidant enzyme activity, and an increase in malondialdehyde (MDA) content, suggesting that rice activated a defense mechanism to cope with drought-induced oxidative stress. This study also found that drought stress significantly reduced the net photosynthetic rate and stomatal conductance of rice, which, in turn, affected the yield of rice. Under drought stress, the yield of the HHZ cultivars decreased most significantly, reaching 30.2%, while the yields of IRAT109 and HY73 cultivars decreased by 13.0% and 18.2%, respectively. The analysis of yield composition showed that the number of grains per panicle, seed-setting rate, and 1000-grain weight were the key factors affecting yield formation. A correlation analysis showed that there was a significant positive correlation between yield and net photosynthetic rate, stomatal conductance, chla/chlb ratio, Rubisco activity, and Fv/Fm, but there was a negative correlation with MDA and non-photochemical quenching (NPQ). In summary, the effects of drought stress on rice yield are multifaceted, involving changes in multiple agronomic traits. The results highlight the importance of selecting and nurturing rice varieties with a high drought tolerance, which should have efficient antioxidant systems and high photosynthetic efficiency. Future research should focus on the genetic mechanisms of these physiological responses in order to develop molecular markers to assist in the breeding of drought-tolerant rice varieties.
Keywords: antioxidant enzyme; chlorophyll; drought stress; photosynthesis; rice yield.
Conflict of interest statement
The authors declare that the research was conducted in the absence of any commercial or financial relationships that could be construed as potential conflicts of interest.
Figures


Similar articles
-
Physiological Adaptation Mechanisms to Drought and Rewatering in Water-Saving and Drought-Resistant Rice.Int J Mol Sci. 2022 Nov 14;23(22):14043. doi: 10.3390/ijms232214043. Int J Mol Sci. 2022. PMID: 36430523 Free PMC article.
-
Effects of prohexadione calcium spraying during the booting stage on panicle traits, yield, and related physiological characteristics of rice under salt stress.PeerJ. 2023 Jan 23;11:e14673. doi: 10.7717/peerj.14673. eCollection 2023. PeerJ. 2023. PMID: 36710858 Free PMC article.
-
Impact of Low Canopy, Root Temperature, and Drought at the Booting Stage on Yield, Grain Quality, Photosynthesis, and Antioxidant Responses in Rice.Physiol Plant. 2025 May-Jun;177(3):e70268. doi: 10.1111/ppl.70268. Physiol Plant. 2025. PMID: 40394860
-
Morpho-physiological and biochemical response of rice (Oryza sativa L.) to drought stress: A review.Heliyon. 2023 Feb 14;9(3):e13744. doi: 10.1016/j.heliyon.2023.e13744. eCollection 2023 Mar. Heliyon. 2023. PMID: 36879962 Free PMC article. Review.
-
Oxidative Stress in Rice (Oryza sativa): Mechanisms, Impact, and Adaptive Strategies.Plants (Basel). 2025 May 14;14(10):1463. doi: 10.3390/plants14101463. Plants (Basel). 2025. PMID: 40431027 Free PMC article. Review.
Cited by
-
Optimization of row and hill spacing patterns improved rice population structure and increased rice yield.Front Plant Sci. 2025 May 26;16:1570845. doi: 10.3389/fpls.2025.1570845. eCollection 2025. Front Plant Sci. 2025. PMID: 40491825 Free PMC article.
-
Zearalenone and nanozeolite improve Arugula (Eruca sativa) drought tolerance by enhancing photosynthesis and water relations.Sci Rep. 2025 Aug 6;15(1):28770. doi: 10.1038/s41598-025-14765-8. Sci Rep. 2025. PMID: 40770538 Free PMC article.
References
-
- Luo W., Chen M., Kang Y., Li W., Li D., Cui Y., Khan S., Luo Y. Analysis of crop water requirements and irrigation demands for rice: Implications for increasing effective rainfall. Agric. Water Manag. 2022;260:107285. doi: 10.1016/j.agwat.2021.107285. - DOI
-
- Wang B., Yang X., Chen L., Jiang Y., Bu H., Li P., Cao C. Physiological mechanism of drought-resistant rice coping with drought stress. J. Plant Growth Regul. 2021;41:2638–2651. doi: 10.1007/s00344-021-10456-6. - DOI
-
- Wen W., Timmermans J., Chen Q., van Bodegom P.M. A Review of remote sensing challenges for food security with respect to salinity and drought threats. Remote Sens. 2021;13:6. doi: 10.3390/rs13010006. - DOI
Grants and funding
LinkOut - more resources
Full Text Sources
