. 2024 Dec 14;13(24):3495.
doi: 10.3390/plants13243495.

Effects of Far-Red Light and Ultraviolet Light-A on Growth, Photosynthesis, Transcriptome, and Metabolome of Mint (Mentha haplocalyx Briq.)

Affiliations

Effects of Far-Red Light and Ultraviolet Light-A on Growth, Photosynthesis, Transcriptome, and Metabolome of Mint (Mentha haplocalyx Briq.)

Lishu Yu et al. Plants (Basel). .

Abstract

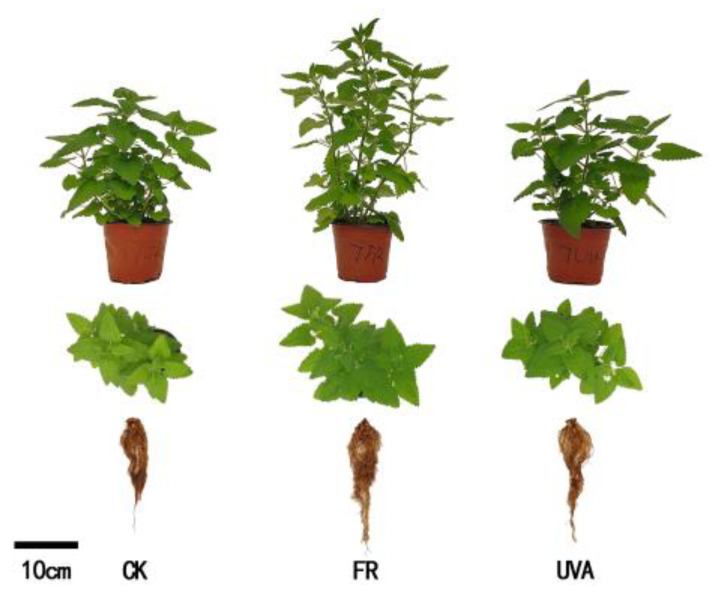
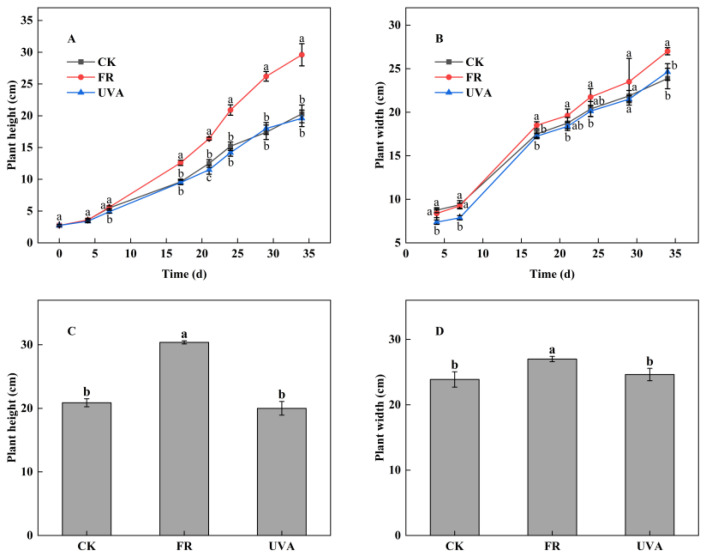
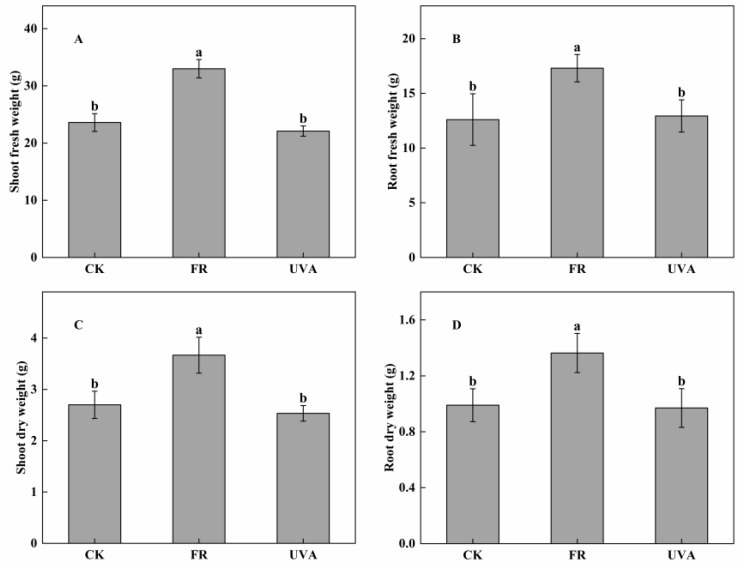
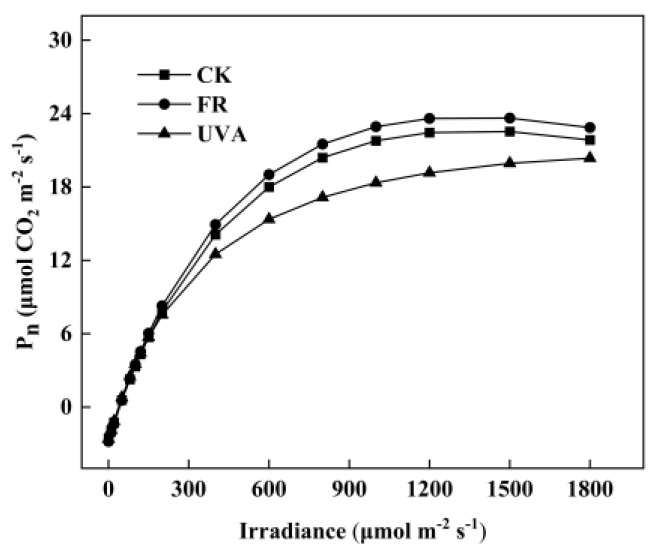
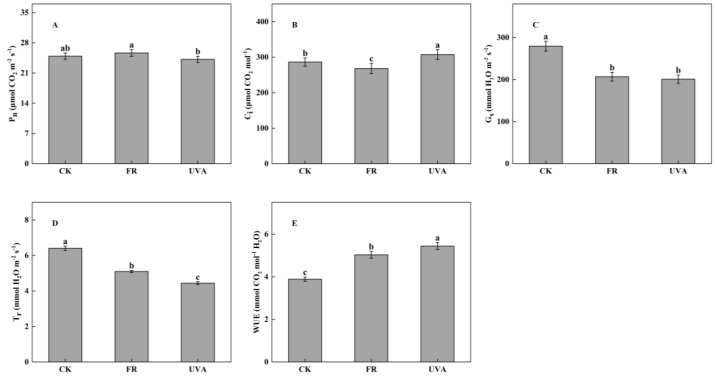
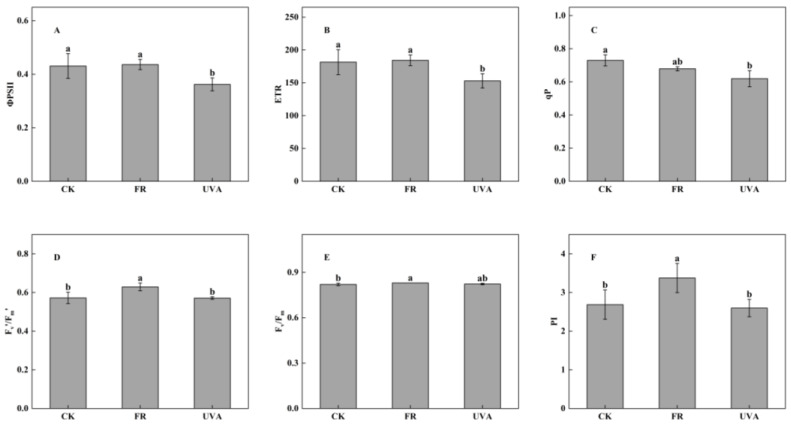
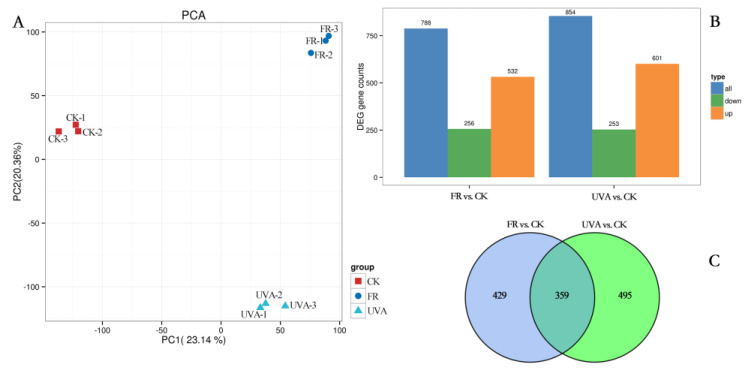
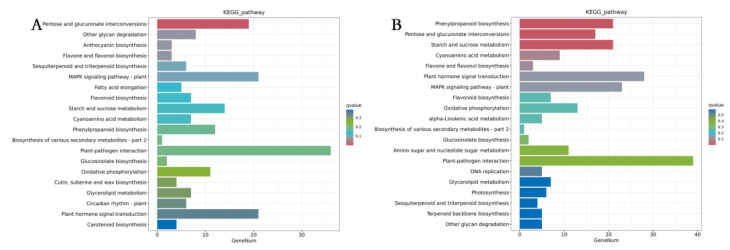
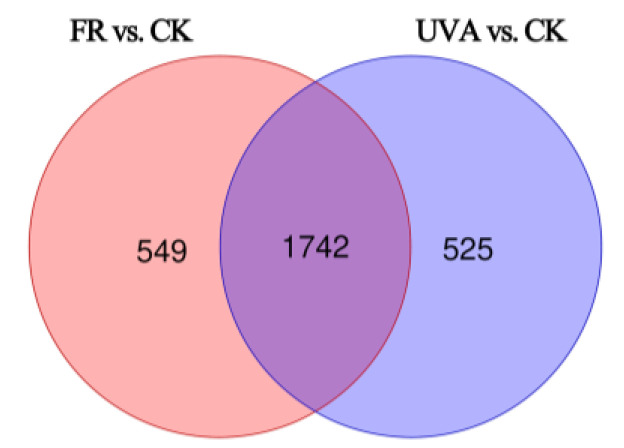
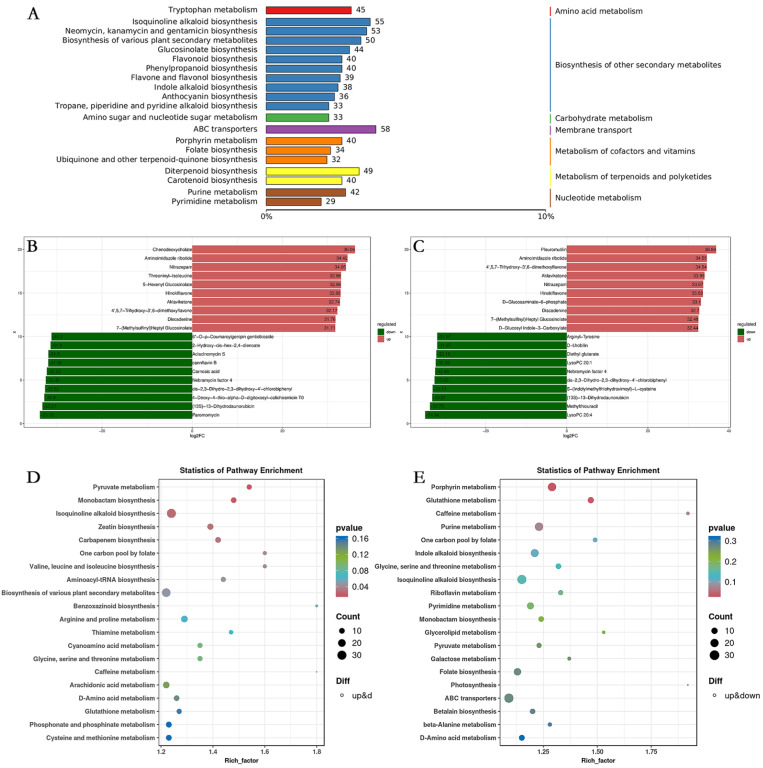
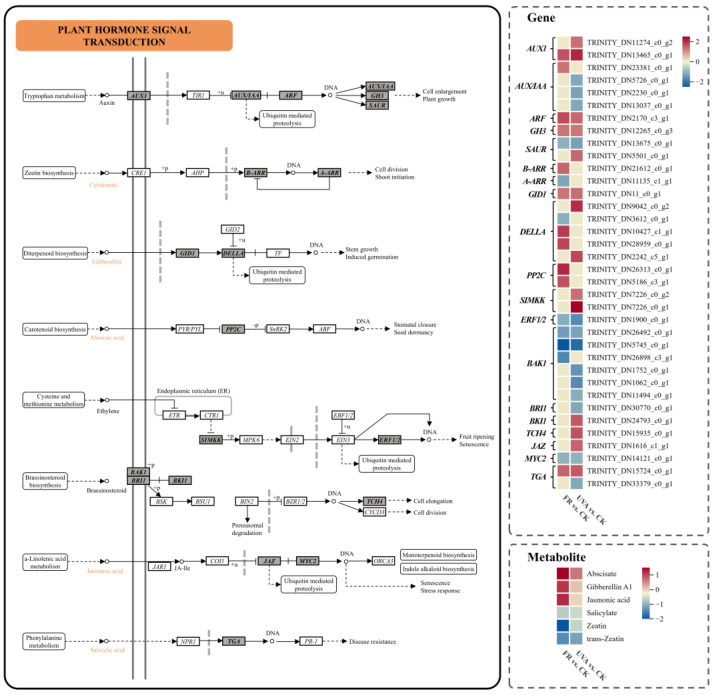
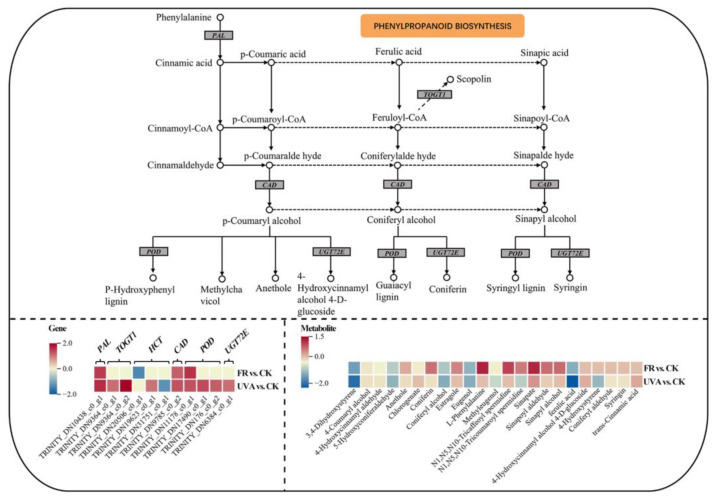
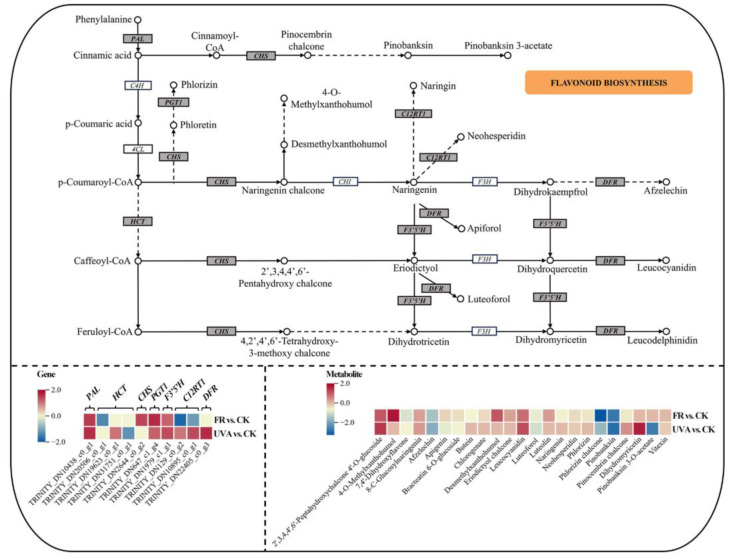
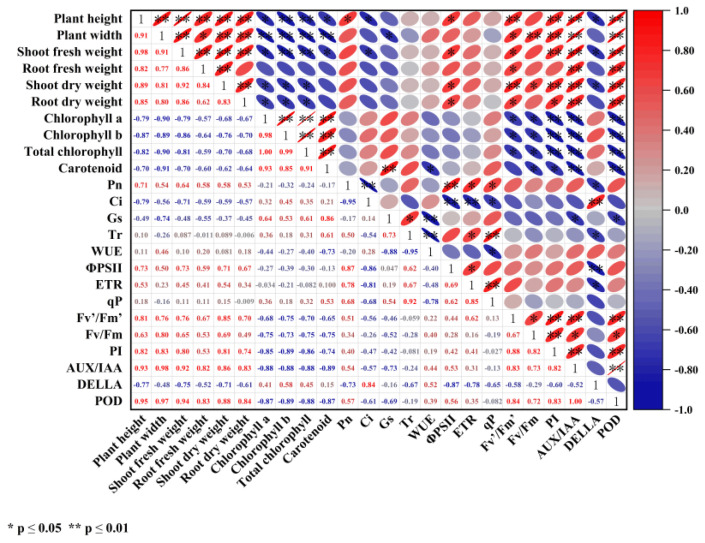
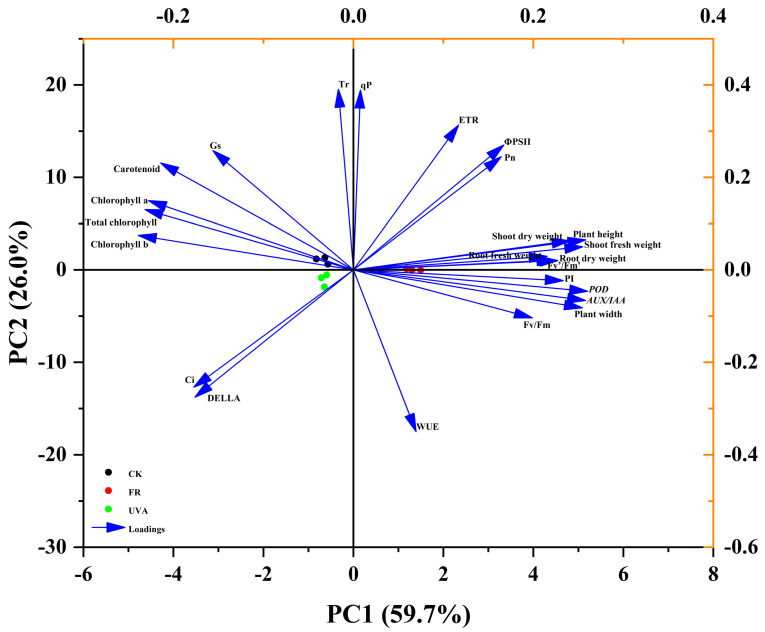
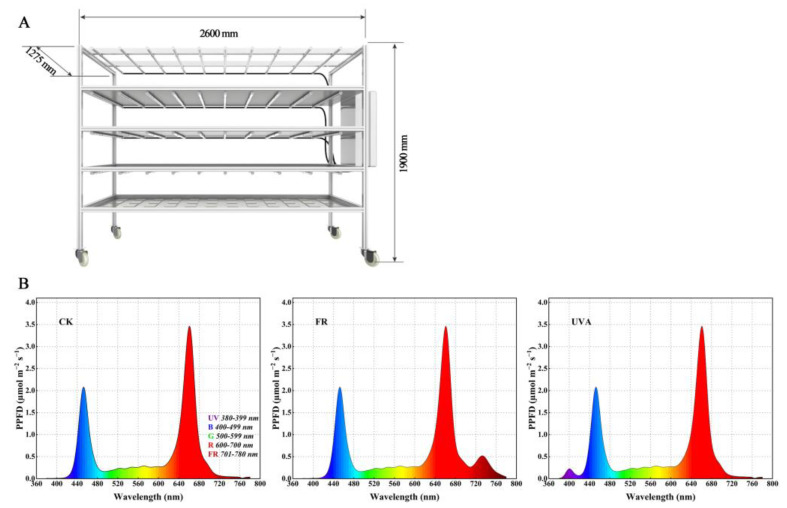
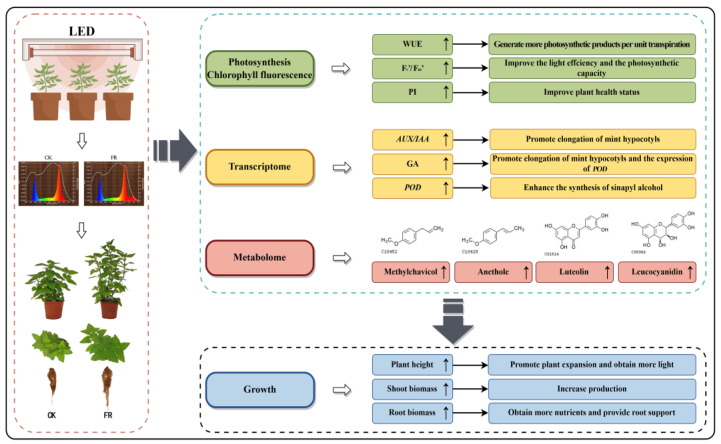
To investigate the effects of different light qualities on the growth, photosynthesis, transcriptome, and metabolome of mint, three treatments were designed: (1) 7R3B (70% red light and 30% blue light, CK); (2) 7R3B+ far-red light (FR); (3) 7R3B+ ultraviolet light A (UVA). The results showed that supplemental FR significantly promoted the growth and photosynthesis of mint, as evidenced by the increase in plant height, plant width, biomass, effective quantum yield of PSII photochemistry (Fv'/Fm'), maximal quantum yield of PSII (Fv/Fm), and performance index (PI). UVA and CK exhibited minimal differences. Transcriptomic and metabolomic analysis indicated that a total of 788 differentially expressed genes (DEGs) and 2291 differential accumulated metabolites (DAMs) were identified under FR treatment, mainly related to plant hormone signal transduction, phenylpropanoid biosynthesis, and flavonoid biosynthesis. FR also promoted the accumulation of phenylalanine, sinapyl alcohol, methylchavicol, and anethole in the phenylpropanoid biosynthesis pathway, and increased the levels of luteolin and leucocyanidin in the flavonoid biosynthesis pathway, which may perhaps be applied in practical production to promote the natural antibacterial and antioxidant properties of mint. An appropriate increase in FR radiation might alter transcript reprogramming and redirect metabolic flux in mint, subsequently regulating its growth and secondary metabolism. Our study uncovered the regulation of FR and UVA treatments on mint in terms of growth, physiology, transcriptome, and metabolome, providing reference for the cultivation of mint and other horticultural plants.

Keywords: far-red radiation; flavonoid; metabolome; mint; phenylpropanoid; transcriptome; ultraviolet-a.


Conflict of interest statement

The author Lijun Bu was employed by the company “Shanghai Sunqiaoyijia Tech-Agriculture Co., Ltd.”. The remaining authors declare that the research was conducted in the absence of any commercial or financial relationships that could be construed as a potential conflict of interest.

Figures

Figure 1
Figure 1
Effects of different light qualities on mint growth morphology. CK: 70% red light and 30% blue light (7R3B), FR: 7R3B + far-red light, UVA: 7R3B + ultraviolet light A.
Figure 2
Figure 2
Effects of different light qualities on mint growth. (A) Plant height. (B) Plant width. (C) Plant height (d34). (D) Plant width (d34). CK: 70% red light and 30% blue light (7R3B), FR: 7R3B + far-red light, UVA: 7R3B + ultraviolet light A. Treatments were replicated three times, and different letters indicated significant differences (p < 0.05).
Figure 3
Figure 3
Effects of different light qualities on mint biomass. (A) Shoot fresh weight. (B) Root fresh weight. (C) Shoot dry weight. (D) Root dry weight. CK: 70% red light and 30% blue light (7R3B), FR: 7R3B + far-red light, UVA: 7R3B + ultraviolet light A. Treatments were replicated three times, and different letters indicated significant differences (p < 0.05).
Figure 4
Figure 4
Effects of different light qualities on mint light response curves. CK: 70% red light and 30% blue light (7R3B), FR: 7R3B + far-red light, UVA: 7R3B + ultraviolet light A.
Figure 5
Figure 5
Effects of different light qualities on mint gas exchange parameters. (A) Net photosynthetic rate (Pn). (B) Intercellular CO2 concentration (Ci). (C) Stomatal conductance (Gs). (D) Transpiration rate (Tr). (E) Water use efficiency (WUE). CK: 70% red light and 30% blue light (7R3B), FR: 7R3B + far-red light, UVA: 7R3B + ultraviolet light A. Treatments were replicated three times, and different letters indicated significant differences (p < 0.05).
Figure 6
Figure 6
Effects of different light qualities on chlorophyll fluorescence parameters. (A) Actual photochemical efficiency of PSII (ΦPSII). (B) Electron transport rate (ETR). (C) Photochemical quenching coefficient (qP). (D) Effective quantum yield of PSII photochemistry (Fv’/Fm’). (E) Maximal quantum yield of PSII (Fv/Fm). (F) Performance index (PI). CK: 70% red light and 30% blue light (7R3B), FR: 7R3B + far-red light, UVA: 7R3B + ultraviolet light A. Treatments were replicated three times, and different letters indicated significant differences (p < 0.05).
Figure 7
Figure 7
Effects of different light qualities on gene expression. (A) PCA of transcriptome samples under different light qualities. (B) Number of DEGs detected in FR vs. CK and UVA vs. CK. (C) Venn diagram of DEGs in FR vs. CK and UVA vs. CK. CK: 70% red light and 30% blue light (7R3B), FR: 7R3B + far-red light, UVA: 7R3B + ultraviolet light A. Treatments were replicated three times.
Figure 8
Figure 8
Effects of different light qualities on KEGG pathway enrichment of DEGs. (A) KEGG pathway enrichment of DEGs between FR and CK treatments. (B) KEGG pathway enrichment of DEGs between UVA and CK treatments. CK: 70% red light and 30% blue light (7R3B), FR: 7R3B + far-red light, UVA: 7R3B + ultraviolet light A. Treatments were replicated three times.
Figure 9
Figure 9
Venn diagram of DAMs in FR vs. CK and UVA vs. CK. CK: 70% red light and 30% blue light (7R3B), FR: 7R3B + far-red light, UVA: 7R3B + ultraviolet light A. Treatments were replicated three times.
Figure 10
Figure 10
Effects of different light qualities on KEGG pathway enrichment of DAMs. (A) KEGG annotation of DAMs. (B) The top ten up and down-regulated DAMs of fold change between FR and CK treatments. (C) The top ten up and down-regulated DAMs of fold change between UVA and CK treatments. (D) KEGG pathway enrichment of DAMs between FR and CK treatments. (E) KEGG pathway enrichment of DAMs between UVA and CK treatments. CK: 7R3B, FR: 7R3B + far-red light, UVA: 70% red light and 30% blue light (7R3B) + ultraviolet light A. Treatments were replicated three times.
Figure 11
Figure 11
The DEGs and DAMs involved in plant hormone signal transduction pathway in response to different light qualities. The color in the rectangle represents the genes or metabolites that were regulated under different light qualities (red indicated up-regulation; yellow indicated non-significant; blue indicated down-regulation). CK: 70% red light and 30% blue light (7R3B), FR: 7R3B + far-red light, UVA: 7R3B + ultraviolet light A. Treatments were replicated three times.
Figure 12
Figure 12
The DEGs and DAMs involved in phenylpropanoid biosynthesis pathway in response to different light qualities. The color in the rectangle represents the genes or metabolites that were regulated under different light qualities (red indicated up-regulation; yellow indicated non-significant; blue indicated down-regulation). CK: 70% red light and 30% blue light (7R3B), FR: 7R3B + far-red light, UVA: 7R3B + ultraviolet light A. Treatments were replicated three times.
Figure 13
Figure 13
The DEGs and DAMs involved in flavonoid biosynthesis pathway in response to different light qualities. The color in the rectangle represents the genes or metabolites that were regulated under different light qualities (red indicated up-regulation; yellow indicated non-significant; blue indicated down-regulation). CK: 70% red light and 30% blue light (7R3B), FR: 7R3B + far-red light, UVA: 7R3B + ultraviolet light A. Treatments were replicated three times.
Figure 14
Figure 14
(A) qRT-PCR analysis of the gene expression patterns and FPKM expression level in mint seedlings under different light qualities. (B) Log2 Fold Change of RNA-seq and qRT-PCR analysis of AUX/IAA, DELLA, and POD. CK: 70% red light and 30% blue light (7R3B), FR: 7R3B + far-red light, UVA: 7R3B + ultraviolet light A. Treatments were replicated three times. “*” indicates a significant correlation at p ≤ 0.05 and “**” indicates a significant correlation at p ≤ 0.01.
Figure 15
Figure 15
Correlation analysis between different results. The upper right ellipse represents the correlation between different parameters, and the lower left numbers represent the correlation coefficients, with red being a positive correlation and blue being a negative correlation. “*” indicates a significant correlation at p ≤ 0.05 and “**” indicates a significant correlation at p ≤ 0.01.
Figure 16
Figure 16
PCA of different results. Arrow direction and length indicate correlation and strength, respectively.
Figure 17
Figure 17
(A) Seedling rack for conducting experiments. (B) Spectral graphs of different treatments. CK: 70% red light and 30% blue light (7R3B), FR: 7R3B + far-red light, UVA: 7R3B + ultraviolet light A.
Figure 18
Figure 18
The frame diagram depicting the addition of FR to red and blue light on the growth, photosynthesis, transcriptome, and metabolome of mint. The arrow “↑” indicates that the indicator was up-regulated under FR. FR: 70% red light and 30% blue light (7R3B) + far-red light.

Similar articles

Cited by

References

    1. Miao C., Yang S.J., Xu J., Wang H., Zhang Y.X., Cui J.W., Zhang H.M., Jin H.J., Lu P.L., He L.Z. Effects of light intensity on growth and quality of lettuce and spinach cultivars in a plant factory. Plants. 2023;12:3337. doi: 10.3390/plants12183337. - DOI - PMC - PubMed
    1. Bian Z.H., Cheng R.F., Wang Y., Yang Q.C., Lu C.G. Effect of green light on nitrate reduction and edible quality of hydroponically grown lettuce (Lactuca sativa L.) under short-term continuous light from red and blue light-emitting diodes. Environ. Exp. Bot. 2018;153:63–71. doi: 10.1016/j.envexpbot.2018.05.010. - DOI
    1. Li Y.F., Xin G.F., Wei M., Shi Q.H., Yang F.J., Wang X.F. Carbohydrate accumulation and sucrose metabolism responses in tomato seedling leaves when subjected to different light qualities. Sci. Hortic. 2017;225:490–497. doi: 10.1016/j.scienta.2017.07.053. - DOI
    1. Behn H., Albert A., Marx F., Noga G., Ulbrich A. Ultraviolet-B and photosynthetically active radiation interactively affect yield and pattern of monoterpenes in leaves of peppermint (Mentha × piperita L.) J. Agric. Food Chem. 2010;58:7361–7367. doi: 10.1021/jf9046072. - DOI - PubMed
    1. Ballaré C.L., Caldwell M.M., Flint S.D., Robinson S.A., Bornman J.F. Effects of solar ultraviolet radiation on terrestrial ecosystems. Patterns, mechanisms, and interactions with climate change. Photochem. Photobiol. Sci. 2011;10:226–241. doi: 10.1039/c0pp90035d. - DOI - PubMed

LinkOut - more resources