. 2024 Dec 15;13(24):3499.
doi: 10.3390/plants13243499.

Testing the Validity of the Montgomery-Koyama-Smith Equation for Calculating the Total Petal Area per Flower Using Two Rosaceae Species

Affiliations

Testing the Validity of the Montgomery-Koyama-Smith Equation for Calculating the Total Petal Area per Flower Using Two Rosaceae Species

Chuanlong Zhao et al. Plants (Basel). .

Abstract

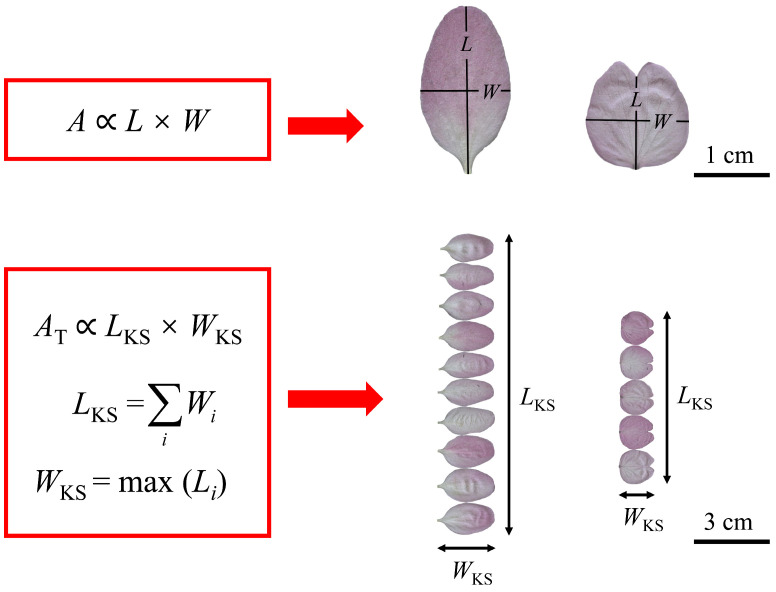
The size of floral organs is closely related to the successful reproduction of plants, and corolla size is, to some extent, indicative of the size of floral organs. Petals are considered to be homologous to leaves, so we also attempted to estimate the area of a single petal using the method that is typically employed for estimating single leaf area (i.e., the Montgomery equation). Additionally, we estimated the total petal area per flower (AT; i.e., the whole corolla area) using the method designed for estimating the total leaf area per shoot (i.e., the Montgomery-Koyama-Smith equation). The Montgomery equation (ME) estimates the leaf area by assuming that the leaf area is proportional to the product of leaf length and width. The Montgomery-Koyama-Smith equation (MKSE) assumes that the total leaf area per shoot is proportional to the product of the sum of individual leaf widths and the maximum individual leaf length. To test the validity of the ME for predicting petal area, a total of 1005 petals from 123 flowers of two Rosaceae species, which exhibit a certain variation in petal shape, were used to fit the relationship between the petal area (A) and the product of petal length (L) and width (W). Two equations, including the MKSE and a power-law equation (PLE), were used to describe the relationship between the total petal area per flower and the product of the sum of individual petal widths and the maximum individual petal length. The root-mean-square error (RMSE) and the Akaike information criterion (AIC) were used to measure the goodness of fit and the trade-off between the goodness of fit and model's structural complexity for each equation. The results show that the ME has a low RMSE value and a high correlation coefficient when fitting the relationship between A and LW for either of the two species. Additionally, the MKSE and the PLE exhibit low RMSEs and AICs for estimating the AT of both Rosaceae species. These results indicate that the ME, MKSE, and PLE are effective in predicting individual petal area and total corolla area, respectively.

Keywords: Montgomery equation; Montgomery–Koyama–Smith equation; Rosaceae; individual petal area; total petal area per flower.


Conflict of interest statement

The authors declare no conflicts of interest.

Figures

Figure 1
Figure 1
An illustration of the Montgomery equation and the Montgomery–Koyama–Smith equation with different variables for Malus halliana var. Parkmanii (on the second column) and Prunus × kanzakura cv. Kawazu-zakura (on the third column). Here, A is the individual petal area; L and W are the individual petal length and width, respectively; AT is the total petal area per flower; LKS is the sum of the petal widths per flower; and WKS is the maximum petal length per flower.
Figure 2
Figure 2
Boxplots of (A) petal area, (B) petal length, (C) petal width, and (D) the ratio of petal width to length for the two Rosaceae species. The upper and lower borders of each box represent the 3/4 and 1/4 quantiles, respectively. Significant differences between the species are indicated by the colorful letters a and b in each panel, based on the HSD test (α = 0.05). The horizontal bold lines in the boxes represent the medians, and the asterisks represent the means. Mh represents M. halliana var. Parkmanii, and Pk represents P. × kanzakura cv. Kawazu-zakura.
Figure 3
Figure 3
Boxplots of (A) the total petal area per flower and (B) the ratio of the maximum petal length to the sum of the petal widths per flower for the two Rosaceae species. The upper and lower borders of each box represent the 3/4 and 1/4 quantiles, respectively. Significant differences between the species are indicated by the colorful letters a and b in each panel, based on the HSD test (α = 0.05). The horizontal bold lines in the boxes represent the medians, and the asterisks represent the means. Mh represents M. halliana var. Parkmanii, and Pk represents P. × kanzakura cv. Kawazu-zakura.
Figure 4
Figure 4
Results of fitting the Montgomery equation on a log–log scale for M. halliana var. Parkmanii (A), and P. × kanzakura cv. Kawazu-zakura (B). In each panel, A, L, and W are the petal area, length, and width, respectively; RMSE is the root-mean-square error; n is the total number of petals for each species; k^ is the estimated Montgomery parameter; 95% CIs are the 95% confidence intervals of the Montgomery parameter based on 3000 bootstrap repetitions.
Figure 5
Figure 5
Results of fitting the Montgomery–Koyama–Smith equation and the power-law equation for the relationship between the total petal area per flower (AT) and the product of the sum of petal widths and the maximum petal length per flower (LKSWKS) on a log–log scale for M. halliana var. Parkmanii (A,B) and P. × kanzakura cv. Kawazu-zakura (C,D). The icons represent the observations converted on the log–log axis; CIintercept is the 95% confidence interval of the intercept; CIslope is the 95% confidence interval of the slope; RMSE is the root-mean-square error of the linear fitting; and n is the number of flowers for each species. In panels (A,C), k^KS is the estimate of the proportionality coefficient of the MKSE, and the CI of kKS represents the 95% confidence interval of the proportionality coefficient.
Figure 6
Figure 6
Results of fitting the Montgomery–Koyama–Smith equation (A) and the power-law equation (B) for the relationship between the total petal area per flower (AT) and the product of the sum of petal widths and the maximum petal length per flower (LKSWKS) on a log–log scale for the pooled data of the two Rosaceae species. The icons are the observations converted on the log–log axis; CIintercept is the 95% confidence interval of the intercept; CIslope is the 95% confidence interval of the slope; RMSE is the root-mean-square error of the linear fitting; and n is the total number of flowers of the two species. In panel (A), k^KS represents the estimate of the proportionality coefficient of the MKSE, and the CI of kKS represents the 95% confidence interval of the proportionality coefficient.
Figure 7
Figure 7
A diagram illustrating the fitting of petal area (A) to the product of length (L) and width (W) using the Montgomery equation, and the fitting of corolla area to the product of length (LKS) and width (WKS) using the Montgomery–Koyama–Smith equation, for the two Rosaceae species, which hypothesizes that (A) AT scales isometrically with a rectangle, with (L) LKS and (W) WKS as its sides. In subfigures (A, B), the left panel displays M. halliana var. Parkmanii, and the right panel displays P. × kanzakura cv. Kawazu-zakura.

Similar articles

Cited by

References

    1. Goethe J.W. Versuch die Metamorphose der Pflanzen zu Erklären. Ettinger; Gotha, Germany: 1790.
    1. Smyth D.R. Morphogenesis of flowers—Our evolving view. Plant Cell. 2005;17:330–341. doi: 10.1105/tpc.104.030353. - DOI - PMC - PubMed
    1. Bowman J.L., Smyth D.R., Meyerowitz E.M. Genetic interactions among floral homeotic genes of Arabidopsis. Development. 1991;112:1–20. doi: 10.1242/dev.112.1.1. - DOI - PubMed
    1. Weigel D., Meyerowitz E.M. The ABCs of floral homeotic genes. Cell. 1994;78:203–209. doi: 10.1016/0092-8674(94)90291-7. - DOI - PubMed
    1. Goto K., Kyozuka J., Bowman J.L. Turning floral organs into leaves, leaves into floral organs. Curr. Opin. Genet. Dev. 2001;11:449–456. doi: 10.1016/S0959-437X(00)00216-1. - DOI - PubMed

LinkOut - more resources