

A Comprehensive Analysis In Silico of KCS Genes in Maize Revealed Their Potential Role in Response to Abiotic Stress
- PMID: 39771204
- PMCID: PMC11676716
- DOI: 10.3390/plants13243507
A Comprehensive Analysis In Silico of KCS Genes in Maize Revealed Their Potential Role in Response to Abiotic Stress
Abstract
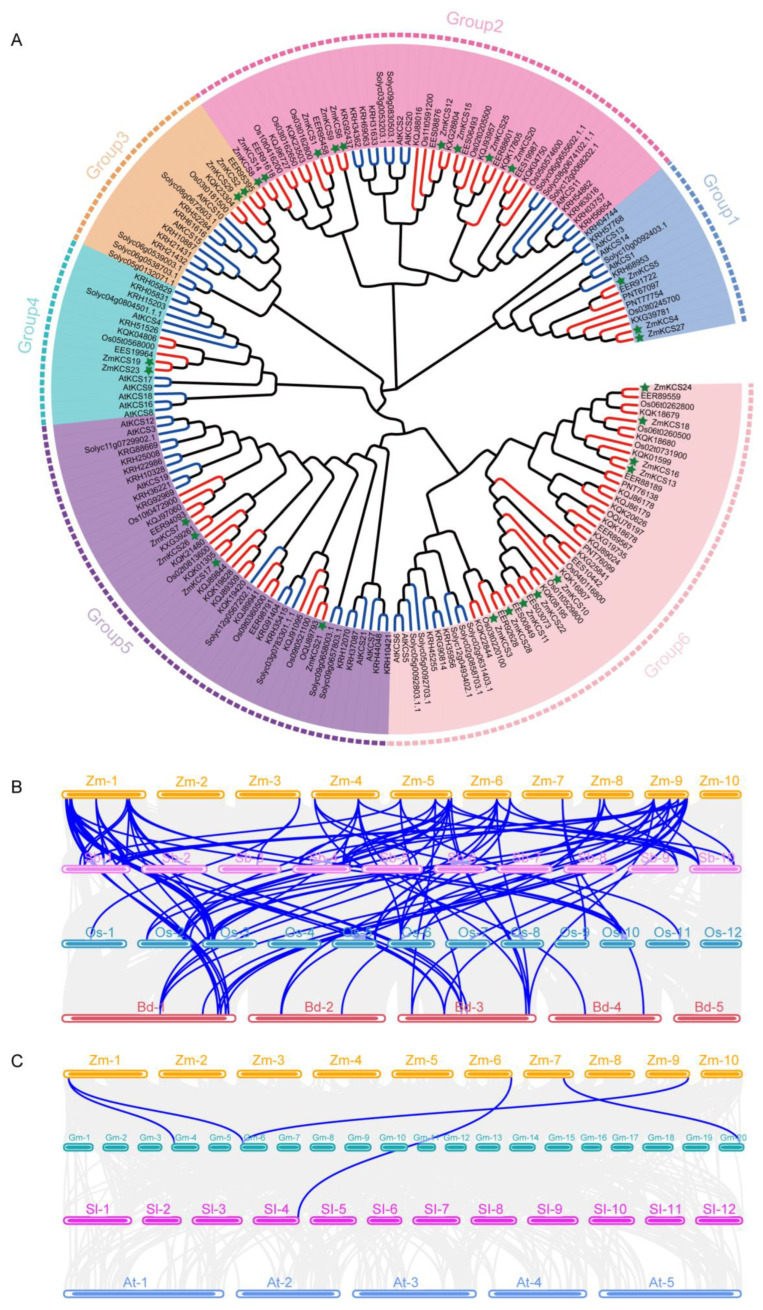
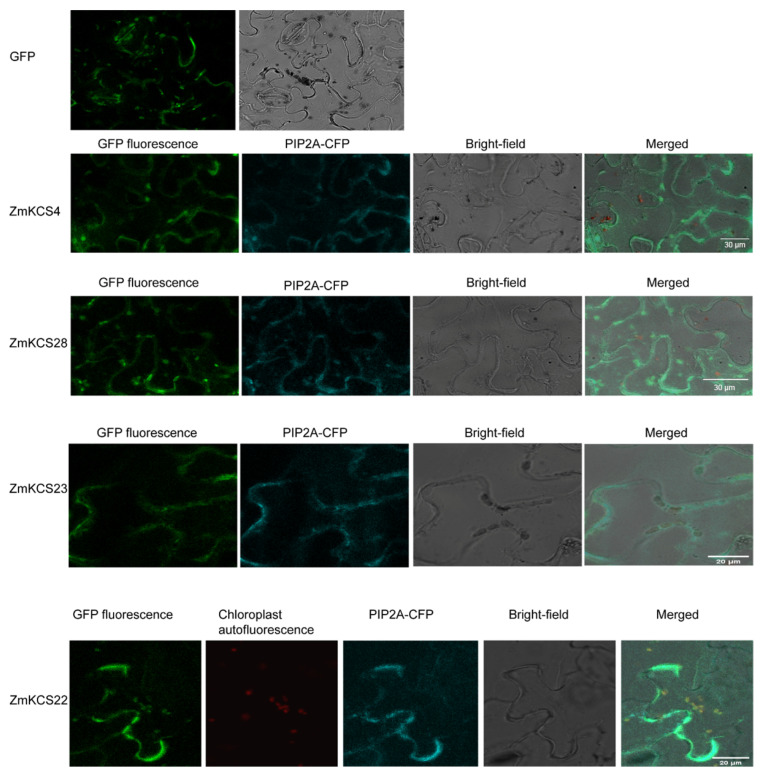
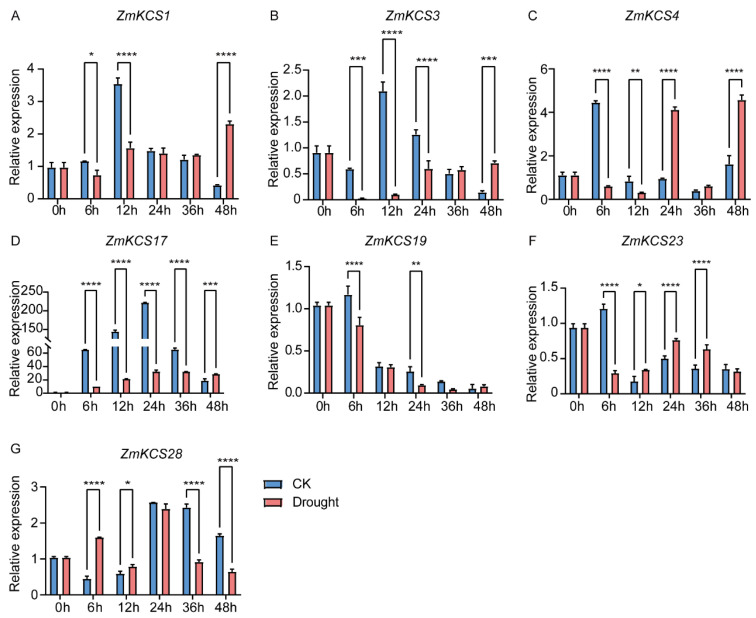
β-ketoacyl-CoA synthase (KCS) enzymes play a pivotal role in plants by catalyzing the first step of very long-chain fatty acid (VLCFA) biosynthesis. This process is crucial for plant development and stress responses. However, the understanding of KCS genes in maize remains limited. In this study, we present a comprehensive analysis of ZmKCS genes, identifying 29 KCS genes that are unevenly distributed across nine maize chromosomes through bioinformatics approaches. These ZmKCS proteins varied in length and molecular weight, suggesting functional diversity. Phylogenetic analysis categorized 182 KCS proteins from seven species into six subgroups, with maize showing a closer evolutionary relationship to other monocots. Collinearity analysis revealed 102 gene pairs between maize and three other monocots, whereas only five gene pairs were identified between maize and three dicots, underscoring the evolutionary divergence of KCS genes between monocotyledonous and dicotyledonous plants. Structural analysis revealed that 20 out of 29 ZmKCS genes are intronless. Subcellular localization prediction and experimental validation suggest that most ZmKCS proteins are likely localized at the plasma membrane, with some also present in mitochondria and chloroplasts. Analysis of the cis-acting elements within the ZmKCS promoters suggested their potential involvement in abiotic stress responses. Notably, expression analysis under abiotic stresses highlighted ZmKCS17 as a potential key gene in the stress response of maize, which presented an over 10-fold decrease in expression under salt and drought stresses within 48 h. This study provides a fundamental understanding of ZmKCS genes, paving the way for further functional characterization and their potential application in maize breeding for enhanced stress tolerance.
Keywords: KCS genes; Zea mays; abiotic stress response; gene family.
Conflict of interest statement
The authors declare no conflicts of interest.
Figures


Similar articles
-
Genome-wide identification and characterization of the KCS gene family in sorghum (Sorghum bicolor (L.) Moench).PeerJ. 2022 Oct 7;10:e14156. doi: 10.7717/peerj.14156. eCollection 2022. PeerJ. 2022. PMID: 36225907 Free PMC article.
-
Genome-wide identification and expression analysis of the KCS gene family in soybean (Glycine max) reveal their potential roles in response to abiotic stress.Front Plant Sci. 2023 Dec 5;14:1291731. doi: 10.3389/fpls.2023.1291731. eCollection 2023. Front Plant Sci. 2023. PMID: 38116151 Free PMC article.
-
Identification and Expression Profiling of the Cytokinin Synthesis Gene Family IPT in Maize.Genes (Basel). 2025 Mar 31;16(4):415. doi: 10.3390/genes16040415. Genes (Basel). 2025. PMID: 40282375 Free PMC article.
-
Identification and analysis of differentially expressed trihelix genes in maize (Zea mays) under abiotic stresses.PeerJ. 2023 May 1;11:e15312. doi: 10.7717/peerj.15312. eCollection 2023. PeerJ. 2023. PMID: 37151290 Free PMC article.
-
Genome-wide identification and analysis of ACP gene family in Sorghum bicolor (L.) Moench.BMC Genomics. 2022 Jul 25;23(1):538. doi: 10.1186/s12864-022-08776-2. BMC Genomics. 2022. PMID: 35879672 Free PMC article. Review.
References
Grants and funding
LinkOut - more resources
Full Text Sources
