. 2024 Dec 16;13(24):3506.
doi: 10.3390/plants13243506.

Combined Physiological and Transcriptomic Analyses of the Effects of Exogenous Trehalose on Salt Tolerance in Maize (Zea mays L.)

Affiliations

Combined Physiological and Transcriptomic Analyses of the Effects of Exogenous Trehalose on Salt Tolerance in Maize (Zea mays L.)

Jingyi He et al. Plants (Basel). .

Abstract

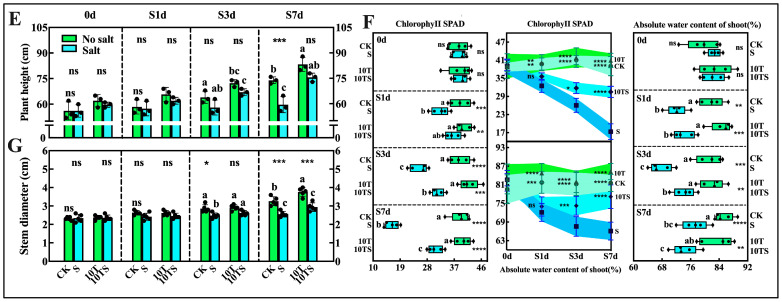
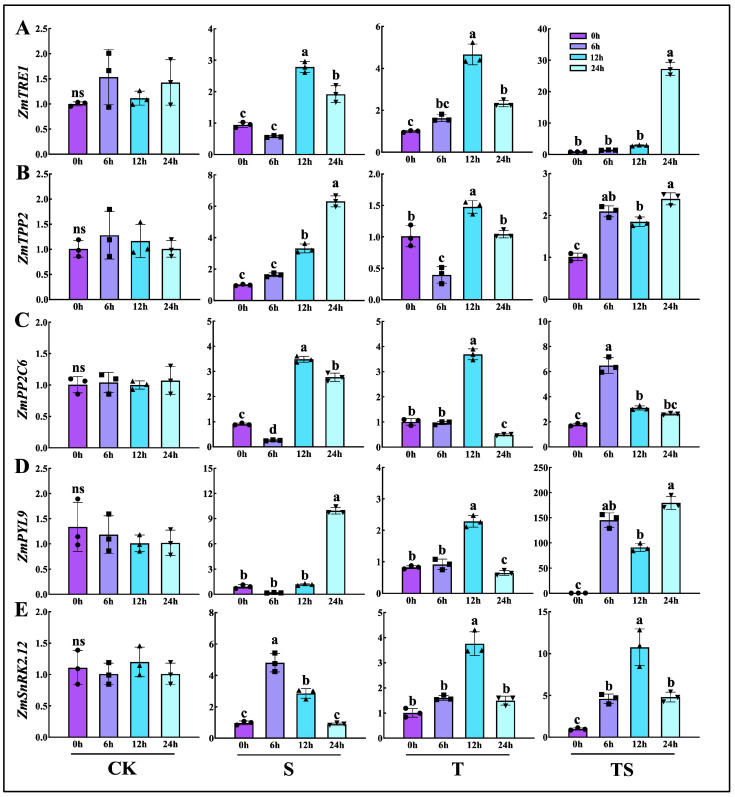
Soil salinization severely affects the quality and yield of maize. As a C4 plant with high efficiency in utilizing light and carbon dioxide, maize (Zea mays L.) is one of the most important crops worldwide. This study aims to investigate the pathways and mechanisms by which trehalose mediates the improvement of salt tolerance in maize through a combined analysis of physiology and transcriptomics. The results indicate that foliar application of trehalose treatment significantly increased maize biomass and antioxidant enzyme activity while reducing the H2O2 and Na+/K+ ratios in both the aerial and underground parts of the plant. Additionally, trehalose enhanced the total secretion of organic acids from maize roots, improving the soil microenvironment for maize growth under salt stress and alleviating Na+ toxicity. Transcriptomic data revealed that under salt stress, most differentially expressed genes (DEGs) were enriched in pathways related to photosynthesis, abscisic acid signaling, and sugar metabolism, and trehalose application increased the expression levels of these pathways, thereby mitigating the growth inhibition caused by salinity. This study elucidates mechanisms for enhancing salt tolerance in maize, providing theoretical support for improving its resilience and offering innovative strategies for utilizing a wide range of saline-alkali land.

Keywords: abscisic acid; antioxidant enzymes; maize (Zea mays L.); photosynthesis; salt stress; sugar metabolism; trehalose.


Conflict of interest statement

The authors declare no conflicts of interest.

Figures

Figure 1
Figure 1
Growth parameters of maize plants at different sampling time points in the hydroponic experiment under salt stress and trehalose treatment. Photos were taken, and samples were collected on the 15th (0d), 19th (S1d), 21st (S3d), and 25th (S7d), days of maize growth to measure various growth parameters: maize seedling phenotype (A), fresh weight (B), root system phenotype (C), dry weight (D), plant height (E), chlorophyll content, relative water content, and daily dynamic changes in the aerial parts (F), and stem diameter (G). Note: date showing the means ± standard deviation (SD). ns: no significant difference. Asterisks: using the t-test, indicating the significance levels of differences between CK (the control) and S (the salt stress), and 10T (the application of trehalose under normal nutritional) and 10TS (the application of trehalose under salt stress): *: a highly significant difference at * p < 0.05, ** at p < 0.01, *** at p < 0.001, and **** at p < 0.0001. Lowercase letters: using the one-way ANOVA (Turkey, Duncan), indicating significant differences (p < 0.05) between groups under salt stress and trehalose treatment (n = 3).
Figure 1
Figure 1
Growth parameters of maize plants at different sampling time points in the hydroponic experiment under salt stress and trehalose treatment. Photos were taken, and samples were collected on the 15th (0d), 19th (S1d), 21st (S3d), and 25th (S7d), days of maize growth to measure various growth parameters: maize seedling phenotype (A), fresh weight (B), root system phenotype (C), dry weight (D), plant height (E), chlorophyll content, relative water content, and daily dynamic changes in the aerial parts (F), and stem diameter (G). Note: date showing the means ± standard deviation (SD). ns: no significant difference. Asterisks: using the t-test, indicating the significance levels of differences between CK (the control) and S (the salt stress), and 10T (the application of trehalose under normal nutritional) and 10TS (the application of trehalose under salt stress): *: a highly significant difference at * p < 0.05, ** at p < 0.01, *** at p < 0.001, and **** at p < 0.0001. Lowercase letters: using the one-way ANOVA (Turkey, Duncan), indicating significant differences (p < 0.05) between groups under salt stress and trehalose treatment (n = 3).
Figure 2
Figure 2
Contents of osmotic substances in maize at different sampling time points in the hydroponic experiment under salt stress and trehalose treatment. The levels of proline (A), soluble sugar (B), and soluble protein (C) were measured at each time point. Note: date showing the means ± standard deviation (SD). ns: no significant difference. Asterisks: using the t-test, indicating the significance levels of differences between CK (the control) and S (the salt stress), or 10T (the application of trehalose under normal nutritional) and 10TS (the application of trehalose under salt stress): *: a highly significant difference at * p < 0.05, ** at p < 0.01, *** at p < 0.001, and **** at p < 0.0001. Lowercase letters: using the one-way ANOVA (Turkey, Duncan), indicating significant differences (p < 0.05) between groups under salt stress and trehalose treatment (n = 3).
Figure 3
Figure 3
The hydrogen peroxide staining phenotype of maize leaves (A), hydrogen peroxide content (B), daily variation of hydrogen peroxide content (C), shoot MDA (D), root MDA (E), SOD activity (F), POD activity (G), CAT activity (H), and APX activity (I) were measured. Note: date showing the means ± standard deviation (SD). ns: no significant difference. Asterisks: using the t-test, indicating the significance levels of differences between CK (the control) and S (the salt stress), or 10T (the application of trehalose under normal nutritional) and 10TS (the application of trehalose under salt stress): *: a highly significant difference at * p < 0.05, ** at p < 0.01, *** at p < 0.001, and **** at p < 0.0001. Lowercase letters: significant differences (p < 0.05, one-way ANOVA) between groups under salt stress and trehalose treatment (n = 3).
Figure 4
Figure 4
Transport of K+ and Na+ in maize at different sampling time points in the hydroponic experiment under salt stress and trehalose treatment. The Na+ content (A), K+ content (B), and the changes in Na+/K+ ratio (C) were measured. Note: date showing the means ± standard deviation (SD). ns: no significant difference. Asterisks: using the t-test, indicating the significance levels of differences between CK (the control) and S (the salt stress), or 10T (the application of trehalose under normal nutritional) and 10TS (the application of trehalose under salt stress): *: a highly significant difference at * p < 0.05, ** at p < 0.01, *** at p < 0.001, and **** at p < 0.0001. Lowercase letters: using the one-way ANOVA (Turkey, Duncan), indicating significant differences (p < 0.05) between groups under salt stress and trehalose treatment (n = 3).
Figure 5
Figure 5
Maize phenotypes in the soil experiment under salt stress and trehalose treatment. Phenotypic photos were recorded during the seedling stage and flowering stage. Measurements included plant height (A), chlorophyll content in the aerial parts (B), relative water content (C), leaf relative conductivity (D), seedling and flowering stage phenotypes (E), fresh weight (F), root system phenotype (G), dry weight (H), root length (I), root surface area (J), average root diameter (K), specific root weight (L), root volume (M), and rhizosphere soil pH (N). Note: date showing the means ± standard deviation (SD). ns: no significant difference. Lowercase letters: using the one-way ANOVA (Turkey, Duncan), indicating significant differences (p < 0.05) between CK (the control), S (the salt stress), 10T (the application of trehalose under normal nutritional) and 10TS (the application of trehalose under salt stress) (n = 6).
Figure 6
Figure 6
Organic acid content secreted by maize roots in the soil experiment under salt stress and trehalose treatment. The contents of fumaric acid (A), aconitic acid (B), lactic acid (C), citric acid (D), maleic acid (E), malic acid (F), oxalic acid (G), total organic acid content secreted by roots under normal conditions (H), and total organic acid content secreted by roots under salt stress (I) were measured. The data were presented as means ± standard deviation (SD) from three replicates. ns: no significant difference. In panels (AG), different letters indicate significant differences (*: highly significant difference at * p < 0.05, ** at p < 0.01, and *** at p < 0.001) between the four treatments using the t-test. Different asterisks indicate the significance levels of differences between CK (the control) and S (salt stress), or T (the application of trehalose under normal conditions) and TS (the application of trehalose under salt stress) using the one-way ANOVA (Turkey, Duncan). In panels (H,I), the contents of various organic acids are marked within the bar chart, and asterisks indicate the significance levels of differences between CK and T, and between S and TS (p < 0.05, n = 3).
Figure 7
Figure 7
Volcano plot of differentially expressed genes (the x-axis represents the fold change in the expression levels of differentially expressed genes, and the y-axis represents the logarithm of the p-value from the differential expression analysis. The number of upregulated and downregulated genes between treatment groups and experimental groups in pairwise comparisons (AF) (CK: the control, S: salt stress, T: the application of trehalose under normal conditions, TS: the ap-plication of trehalose under salt stress.) Red points indicate upregulated genes, blue points indicate downregulated genes, and gray points indicate genes with no significant differential expression) (Q value < 0.05, n = 3).
Figure 8
Figure 8
Transcriptional differences in photosynthesis in maize leaves under salt stress and trehalose treatment. The colored blocks represent log2 TPM values (CK: the control, S: salt stress, T: the application of trehalose under normal conditions, TS: the application of trehalose under salt stress). Red and blue indicate significantly upregulated and downregulated genes, respectively (log2 |TPM| ≥ 1, Q value < 0.05, n = 3). For enzyme reactions, the direction of arrows indicates the order of signal transduction. In the dark reaction, transcription proteins and transcription factors are represented by orange boxes, metabolites by orange squares, and key metabolites by a darker orange. PPC: phosphoenolpyruvate carboxylase; ppdk: pyruvate, orthophosphate dikinase; PCKA: phosphoenolpyruvate carboxykinase; MDH1: malate dehydrogenase; mae B: malate dehydrogenase; pgk: phosphoglycerate kinase; GAPA: glyceraldehyde 3-phosphate dehydrogenase; GAPB: glyceraldehyde-3-phosphate dehydrogenase (NAD(P)+); GAPDH: glyceraldehyde-3-phosphate dehydrogenase; TPI: triosephosphate isomerase; PRK: phosphoribulokinase; rbcL: ribulose-bisphosphate carboxylase large chain; xfp: xylulose-5-phosphate/fructose-6-phosphate phosphoketolase; rpi A: ribose 5-phosphate isomerase A; tktA: transketolase; glpx-SEBP: fructose-1,6-bisphosphatase II/sedoheptulose-1,7-bisphosphatase; ALDO: fructose-bisphosphate aldolase, class I; FBP: fructose-1,6-bisphosphatase I; RPE: ribulose-phosphate 3-epimerase. Photosystem II (PSII) proteins (PsbA, PsbB, PsbC, PsbD, PsbE, PsbF, PsbO, PsbP, and PsbV); PSI proteins (PsaA, PsaB, PsaC, and PsaD); cytochrome b6 complex (PetD, PetE, PetF, PetH, and PetD); F-type ATPase proteins (ATPaseα, β, γ, ε, δ; a, b and c).
Figure 9
Figure 9
Relative expression levels of genes at different time points under hydroponic conditions. Sampling time points were 0 h, 6 h, 12 h, and 24 h after the onset of salt stress. The relative expression levels of ZmTRE1 (A), ZmTPP2 (B), ZmPP2C6 (C), ZmPYL9 (D), and ZmSnRK2.12 (E) were measured. Note: date showing the means ± standard deviation (SD). ns: no significant difference. Different letters indicate significant differences between the four treatments (CK: the control, S: salt stress, T: the application of trehalose under normal conditions, TS: the application of trehalose under salt stress) (p < 0.05, n = 3; Duncan test).
Figure 10
Figure 10
In the soil cultivation experiment, the expression analysis of maize genes ZmTRE1, ZmTPP2, ZmPP2C6, ZmPYL9, and ZmSnRK2.12 in different tissues under various treatments was conducted (p < 0.05, n = 3) (CK: the control, S: salt stress, T: the application of trehalose under normal conditions, TS: the application of trehalose under salt stress). A plant simulation cartoon (A) was used to create two forms of gene expression heat maps: a heat map (B) and a matrix heat map (C), showing the expression levels of the above genes in stem, leaf, female, male, and fruit. In the cartoon heat map, red indicates high expression levels, while blue indicates low expression levels. In the matrix heat map, red indicates high expression levels, and white indicates low expression levels.
Figure 11
Figure 11
Experimental design diagram. The time points with gray shading represent the sampling times in the hydroponic experiment. Tre: 10 mM trehalose was sprayed twice daily, at 9 a.m. and 9 p.m. A 150 mM NaCl solution was used to simulate salt stress in the hydroponic experiment. Soil containing 0.175% NaCl was used to simulate growth in saline soil.
Figure 12
Figure 12
Mechanism diagram of trehalose alleviating salt stress in maize.

Similar articles

Cited by

References

    1. Naeem M.B., Jahan S., Rashid A., Shah A.A., Raja V., El-Sheikh M.A. Improving maize yield and drought tolerance in field conditions through activated biochar application. Sci. Rep. 2024;14:25000. doi: 10.1038/s41598-024-76082-w. - DOI - PMC - PubMed
    1. Alum E.U. Climate change and its impact on the bioactive compound profile of medicinal plants: Implications for global health. Plant Signal. Behav. 2024;19:2419683. doi: 10.1080/15592324.2024.2419683. - DOI - PMC - PubMed
    1. Qin R., Hu Y., Chen H., Du Q., Yang J., Li W.-X. MicroRNA408 negatively regulates salt tolerance by affecting secondary cell wall development in maize. Plant Physiol. 2023;192:1569–1583. doi: 10.1093/plphys/kiad135. - DOI - PMC - PubMed
    1. Rasheed A., Jie H.D., Ali B., He P.L., Zhao L., Ma Y.S., Xing H.C., Qari S.H., Hassan M.U., Hamid M.R., et al. Breeding Drought-Tolerant maize (Zea mays) using molecular breeding Tools: Recent advancements and future Prospective. Agronomy. 2023;13:1459. doi: 10.3390/agronomy13061459. - DOI
    1. Liu J.B., Zhang L.N., Huang L., Yang T.X., Ma J., Yu T., Zhu W.H., Zhang Z.H., Tang J.H. Uncovering the gene regulatory network of maize hybrid ZD309 under heat stress by transcriptomic and metabolomic analysis. Plants. 2022;11:677. doi: 10.3390/plants11050677. - DOI - PMC - PubMed

LinkOut - more resources