. 2024 Dec 19;13(24):3548.
doi: 10.3390/plants13243548.

Modeling Floral Induction in the Narrow-Leafed Lupin Lupinus angustifolius Under Different Environmental Conditions

Affiliations

Modeling Floral Induction in the Narrow-Leafed Lupin Lupinus angustifolius Under Different Environmental Conditions

Maria A Duk et al. Plants (Basel). .

Abstract

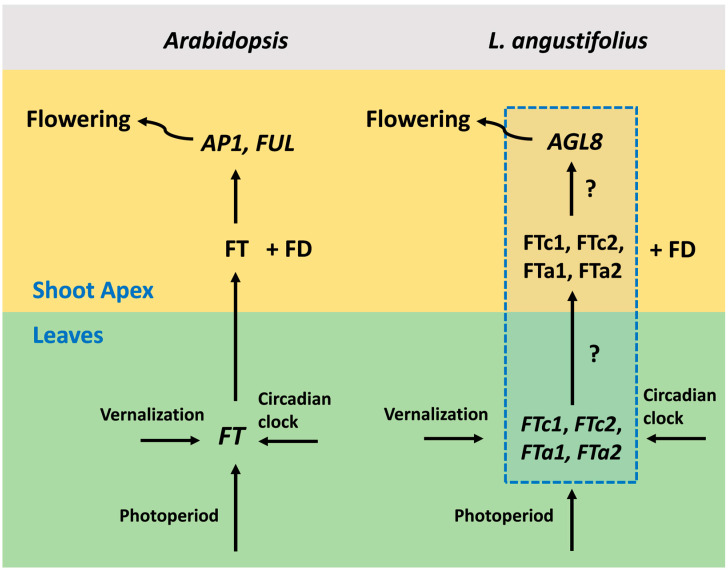
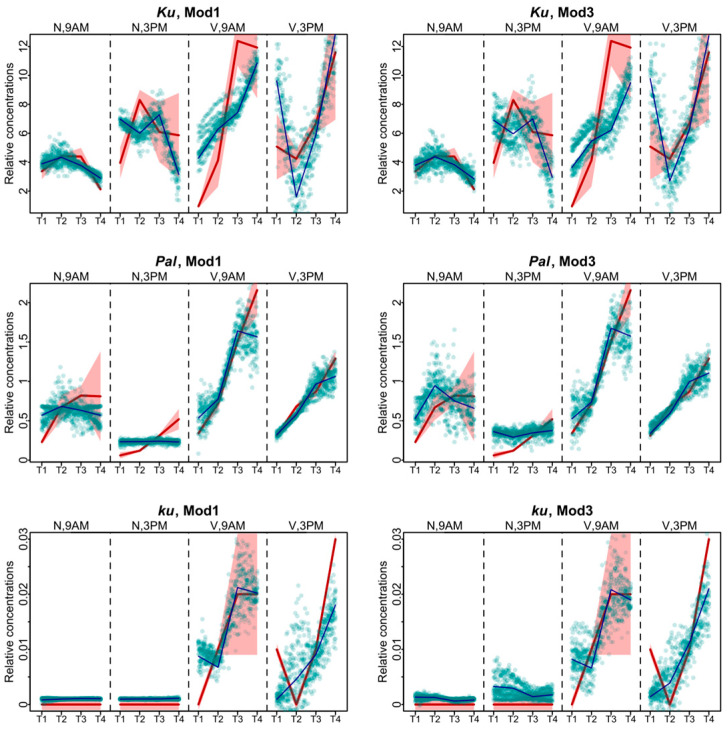
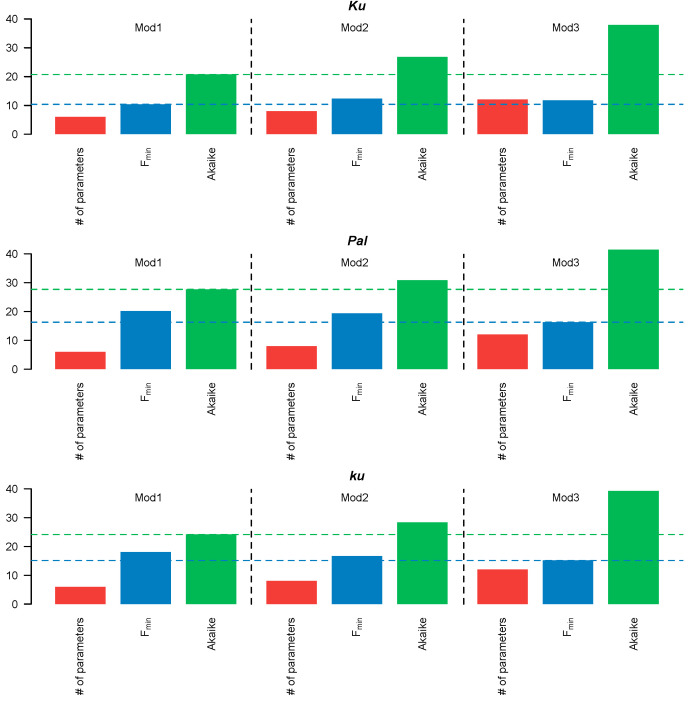
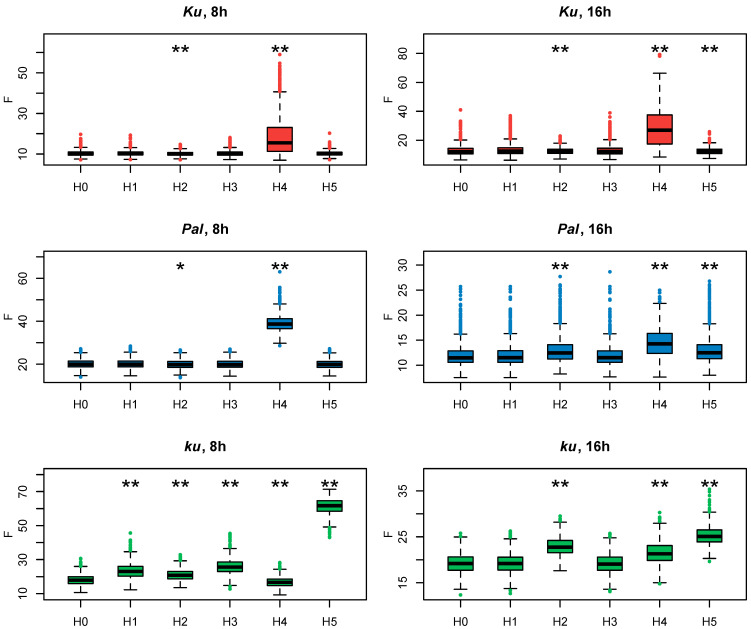
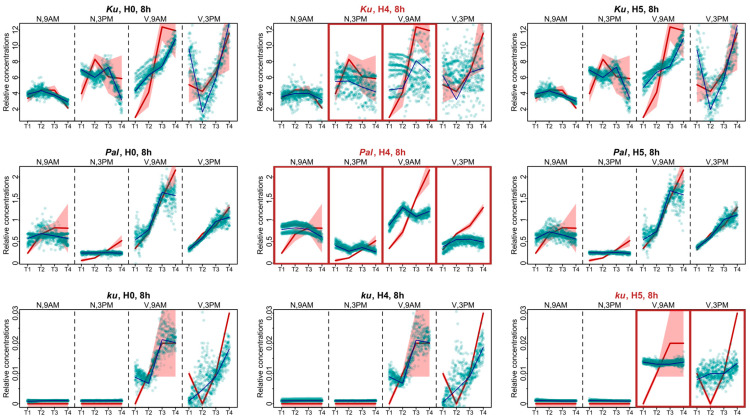
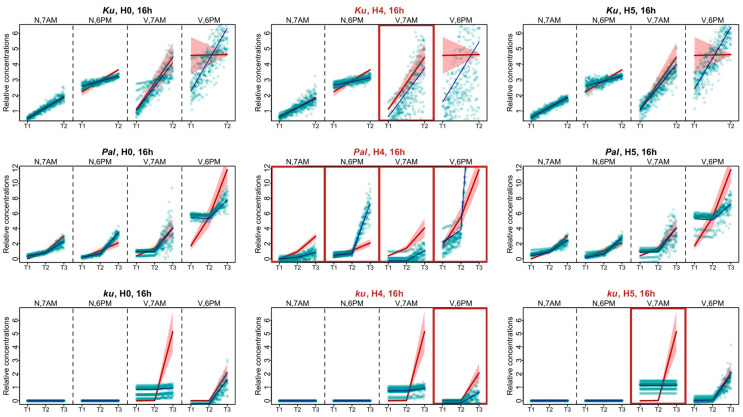
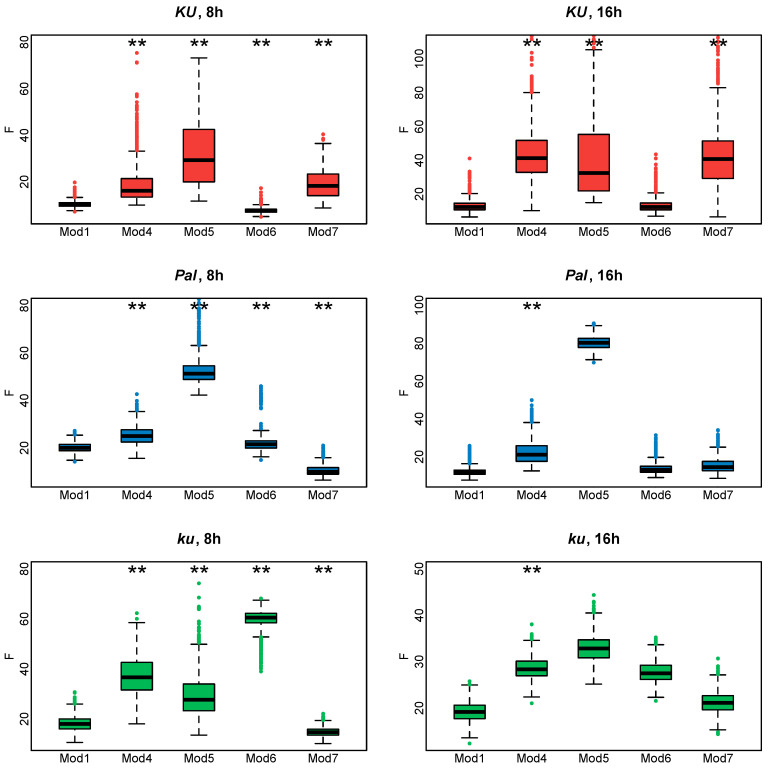
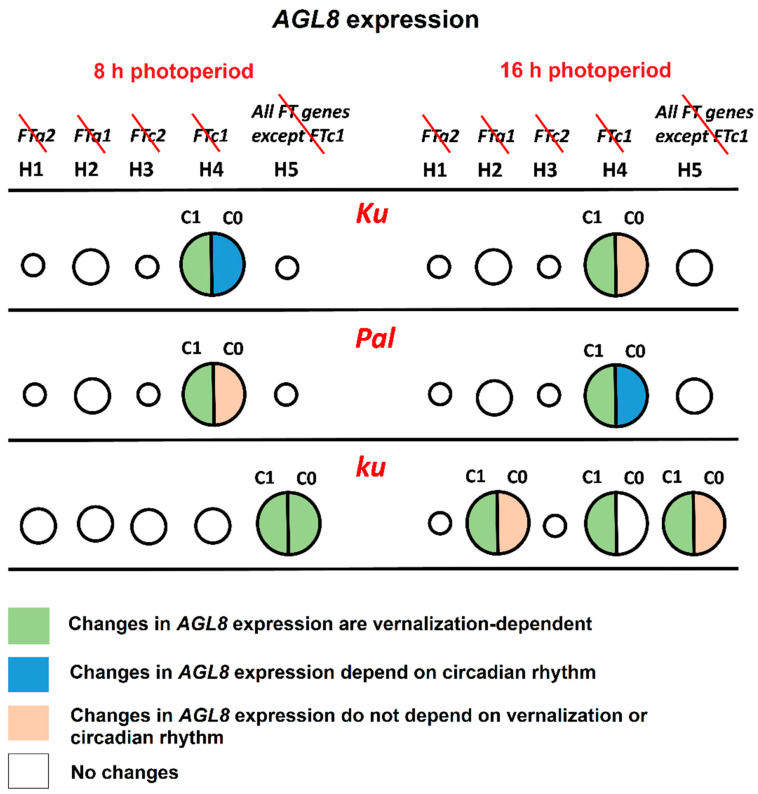
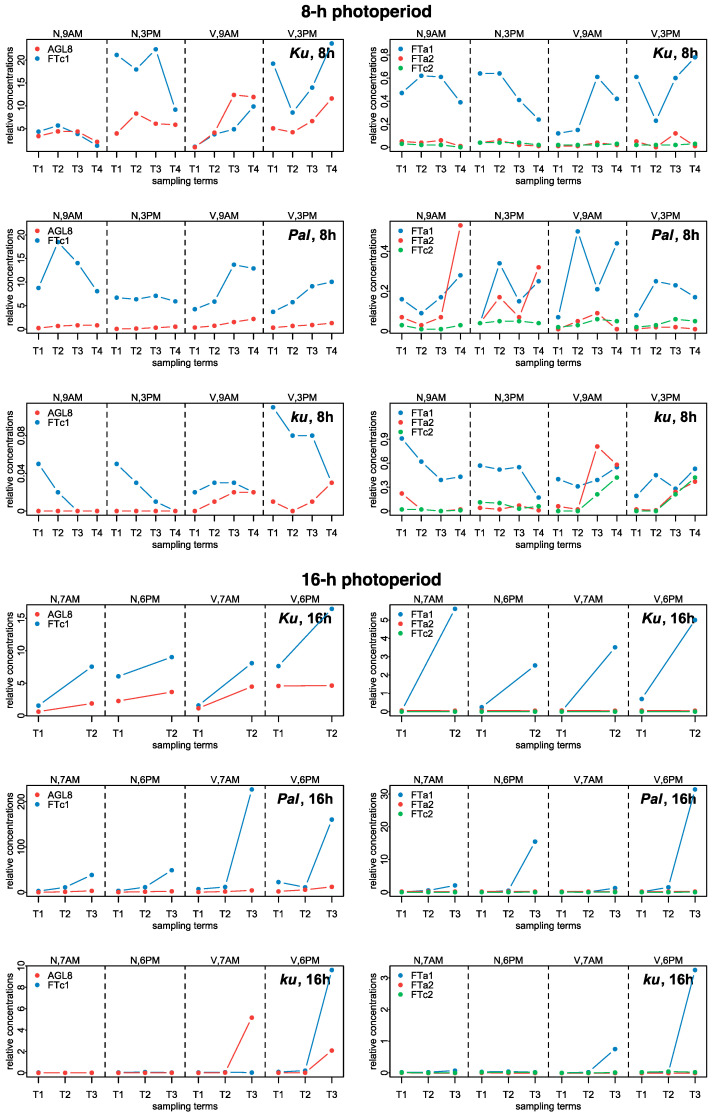
Flowering is initiated in response to environmental cues, with the photoperiod and ambient temperature being the main ones. The regulatory pathways underlying floral transition are well studied in Arabidopsis thaliana but remain largely unknown in legumes. Here, we first applied an in silico approach to infer the regulatory inputs of four FT-like genes of the narrow-leafed lupin Lupinus angustifolius. We studied the roles of FTc1, FTc2, FTa1, and FTa2 in the activation of meristem identity gene AGL8 in response to 8 h and 16 h photoperiods, vernalization, and the circadian rhythm. We developed a set of regression models of AGL8 regulation by the FT-like genes and fitted these models to the recently published gene expression data. The importance of the input from each FT-like gene or their combinations was estimated by comparing the performance of models with one or few FT-like genes turned off, thereby simulating loss-of-function mutations that were yet unavailable in L. angustifolius. Our results suggested that in the early flowering Ku line and intermediate Pal line, the FTc1 gene played a major role in floral transition; however, it acted through different mechanisms under short and long days. Turning off the regulatory input of FTc1 resulted in substantial changes in AGL8 expression associated with vernalization sensitivity and the circadian rhythm. In the wild ku line, we found that both FTc1 and FTa1 genes had an essential role under long days, which was associated with the vernalization response. These results could be applied both for setting up new experiments and for data analysis using the proposed modeling approach.

Keywords: FT-like genes; Lupinus angustifolius; floral induction; gene expression; legumes; mathematical modeling; meristem identity genes; narrow-leafed lupin; photoperiod; vernalization.


Conflict of interest statement

The authors declare no conflicts of interest.

Figures

Figure 1
Figure 1
A general scheme of flowering initiation in Arabidopsis thaliana and a putative network in the narrow-leafed lupin Lupinus angustifolius. In Arabidopsis, the expression of the FT gene is activated in the leaves by the photoperiod and vernalization pathways. Next, the FT protein becomes expressed in the shoot apical meristem, where in complex with the transcription factor FD, it activates meristem identity genes, including AP1 and FUL. Meristem identity genes, in turn, activate pathways responsible for the formation of floral organs. L. angustifolius has four FT gene orthologues, which are FTc1, FTc2, FTa1, and FTa2. The mechanisms of FT-like gene activation by environmental signals and the involvement of each FT-like gene in the regulation of meristem identity genes are still unknown (shown in the blue dotted box). AGL8 is the L. angustifolius orthologue of the Arabidopsis AP1 and FUL genes and a putative target of FT-like genes.
Figure 2
Figure 2
Data fitting results for Models 1 and 3, which show the lowest values of the cost function. Averaged dynamics and standard deviation of the experimental data are shown in red, and the model solutions (averaged over 1000 runs) are shown in black. Green dots represent the simulation results from 10 randomly chosen runs of the minimization process. “N” and “V” stand for non-vernalized and vernalized data, respectively. “9 A.M.” and “3 P.M.” are the times of the day when the data were collected. T1–T4 stand for sampling terms [21].
Figure 3
Figure 3
Number (#) of free parameters (red), minimal cost function value Fmin (blue), and AIC value (green) for Models 1–3. The blue and green dotted lines correspond to the minimum values of the cost function and AIC, respectively.
Figure 4
Figure 4
Cost function values (F) from 1000 minimization runs in Model 1 under hypotheses H0–5 for three L. angustifolius lines. Asterisks indicate statistically significant differences in the mean F between Hi (i = 1…5) and H0 (* p < 0.05, ** p < 0.01). The labels 8 h and 16 h are SD and LD photoperiods, respectively.
Figure 5
Figure 5
Expression dynamics in Models H4, H5, and H0 compared to experimental data for the 8 h photoperiod. Averaged dynamics of the experimental data are shown in red, and the model solution (average of 1000 runs) is shown in blue. Green dots represent the simulation results from 10 random runs of the minimization process. Models showing specific defects in solutions compared to H0 are marked with brown frames. “N” and “V” stand for non-vernalized and vernalized data, respectively. The labels “9 A.M.” and “3 P.M.” are the times of the day when the data were collected. T1–T4 stand for sampling terms [21].
Figure 6
Figure 6
Expression dynamics in Models H4, H5, and H0 compared to experimental data for the 16 h photoperiod. Averaged dynamics of the experimental data are shown in red, and the model solution (average of 1000 runs) is shown in blue. Green dots represent the simulation results from 10 random runs of the minimization process. Models showing specific defects in solutions compared to H0 are marked with brown frames. “N” and “V” stand for non-vernalized and vernalized data; “7 A.M.” and “6 P.M.” are the times of data collection during LD. T1–T4 stand for sampling terms [21].
Figure 7
Figure 7
Cost function values (F) for 1000 minimization runs of Model 1 and Models 4–7 for three L. angustifolius lines. Asterisks indicate statistically significant differences in the mean F between Model i (i = 4…7) and Model 1 (** p < 0.01). The labels 8 h and 16 h are SD and LD photoperiods.
Figure 8
Figure 8
The roles of FT-like genes in AGL8 regulation in L. angustifolius models. The figure summarizes the regulatory effects of the exclusion of one or several FT-like genes from AGL8 regulation under 8 and 16 h photoperiods. Circles of different sizes show an effect of FT-like gene exclusion on the cost function values of Model 1 under hypotheses H1–H5. FT-like genes excluded from each model are specified in the top panel and crossed out in red. The larger the circle, the stronger the influence of regulators on AGL8 expression. In models with the smallest circles, cost function values did not show statistically significant differences from model H0, where AGL8 was regulated by all four FT-like genes (FTa1, FTa2, FTc1, and FTc2) (Figure 4). Cost function values in the models with middle and large circles had statistically significant differences from model H0. However, only models with large circles exhibited patterning defects and/or changes in regulatory parameters. The association of changes in the regulatory parameters with vernalization and circadian rhythms are indicated by different colors, according to the key at the bottom panel. The c1 constant presents the regulatory input of FT-like genes, while c0 reflects the regulation of AGL8 by other factors (Supplementary Tables S1 and S2).
Figure 9
Figure 9
Experimental data on the expression dynamics of AGL8, FTc1, FTa1, FTa2, and FTc2 genes over the 8 h (SD) and 16 h (LD) photoperiods [21]. The data were obtained with qRT-PCR. “N” and “V” stand for non-vernalized and vernalized data; “9 A.M.” and “3 P.M.” are the times of the day when the data were collected during SD, while “7 A.M.” and “6 P.M.” are the times of data collection for LD. T1–T4 stand for sampling terms [21].

Similar articles

References

    1. Amasino R. Seasonal and Developmental Timing of Flowering. Plant J. 2010;61:1001–1013. doi: 10.1111/j.1365-313X.2010.04148.x. - DOI - PubMed
    1. Lee Z., Kim S., Choi S.J., Joung E., Kwon M., Park H.J., Shim J.S. Regulation of Flowering Time by Environmental Factors in Plants. Plants. 2023;12:3680. doi: 10.3390/plants12213680. - DOI - PMC - PubMed
    1. Bouché F., Lobet G., Tocquin P., Périlleux C. FLOR-ID: An Interactive Database of Flowering-Time Gene Networks in Arabidopsis Thaliana. Nucleic Acids Res. 2016;44:D1167–D1171. doi: 10.1093/nar/gkv1054. - DOI - PMC - PubMed
    1. Kinoshita A., Richter R. Genetic and Molecular Basis of Floral Induction in Arabidopsis Thaliana. J. Exp. Bot. 2020;71:2490–2504. doi: 10.1093/jxb/eraa057. - DOI - PMC - PubMed
    1. Ferrándiz C., Gu Q., Martienssen R., Yanofsky M.F. Redundant Regulation of Meristem Identity and Plant Architecture by FRUITFULL, APETALA1 and CAULIFLOWER. Development. 2000;127:725–734. doi: 10.1242/dev.127.4.725. - DOI - PubMed

LinkOut - more resources