. 2024 Dec 22;13(24):3584.
doi: 10.3390/plants13243584.

The Ameliorative Effect of Coumarin on Copper Toxicity in Citrus sinensis: Insights from Growth, Nutrient Uptake, Oxidative Damage, and Photosynthetic Performance

Affiliations

The Ameliorative Effect of Coumarin on Copper Toxicity in Citrus sinensis: Insights from Growth, Nutrient Uptake, Oxidative Damage, and Photosynthetic Performance

Wei-Lin Huang et al. Plants (Basel). .

Abstract

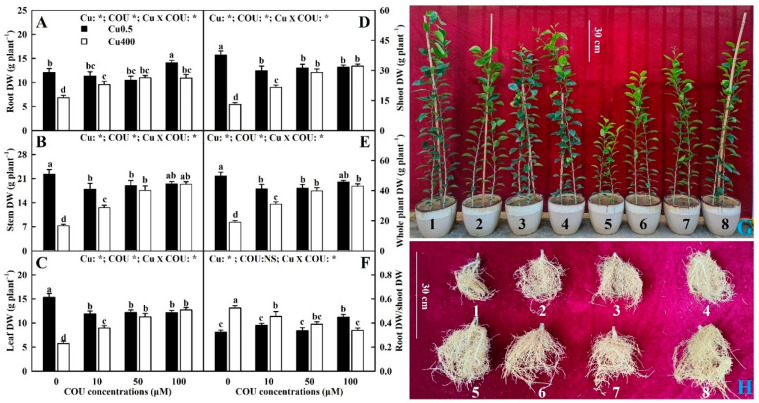
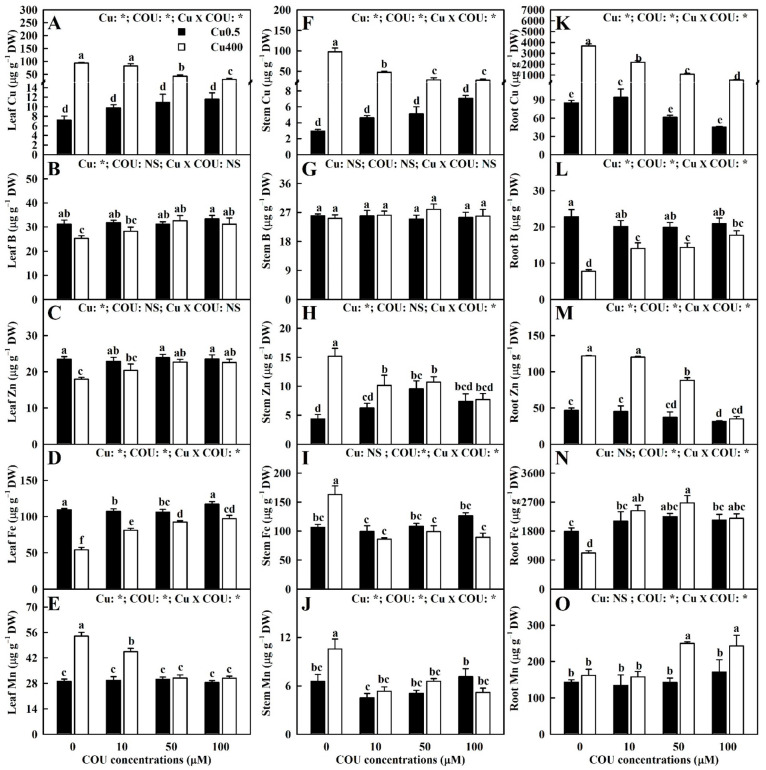
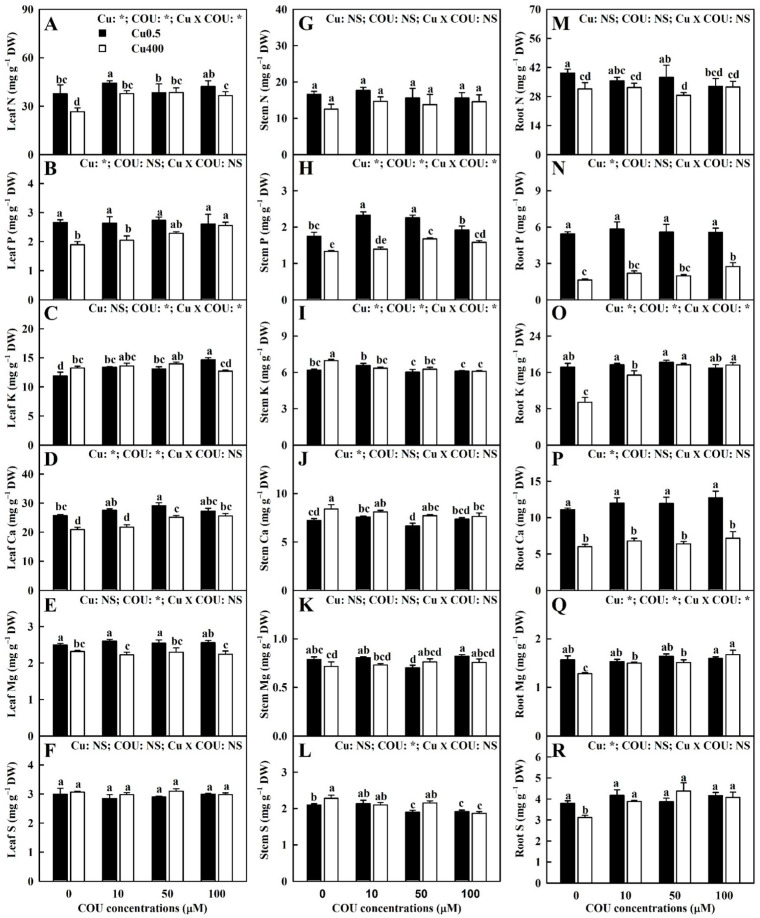
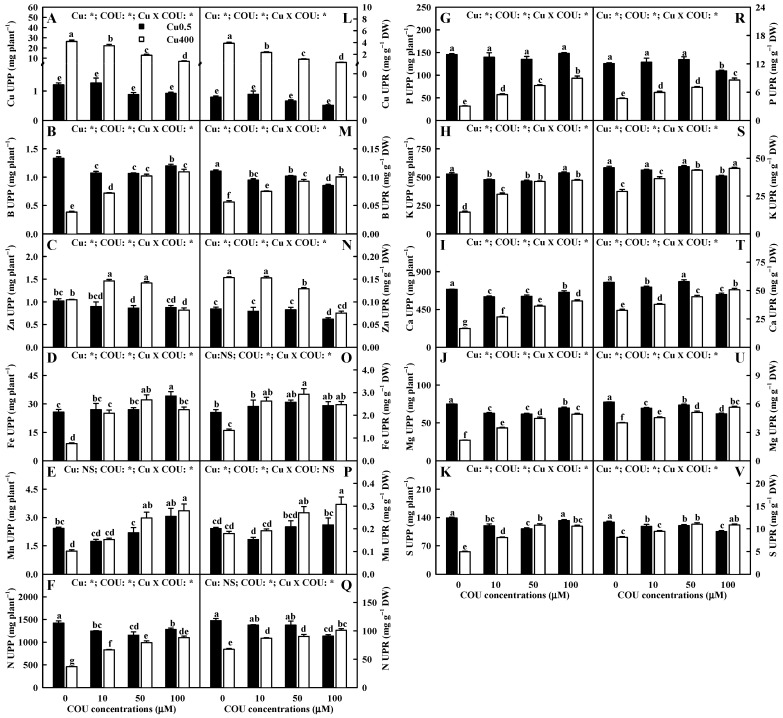
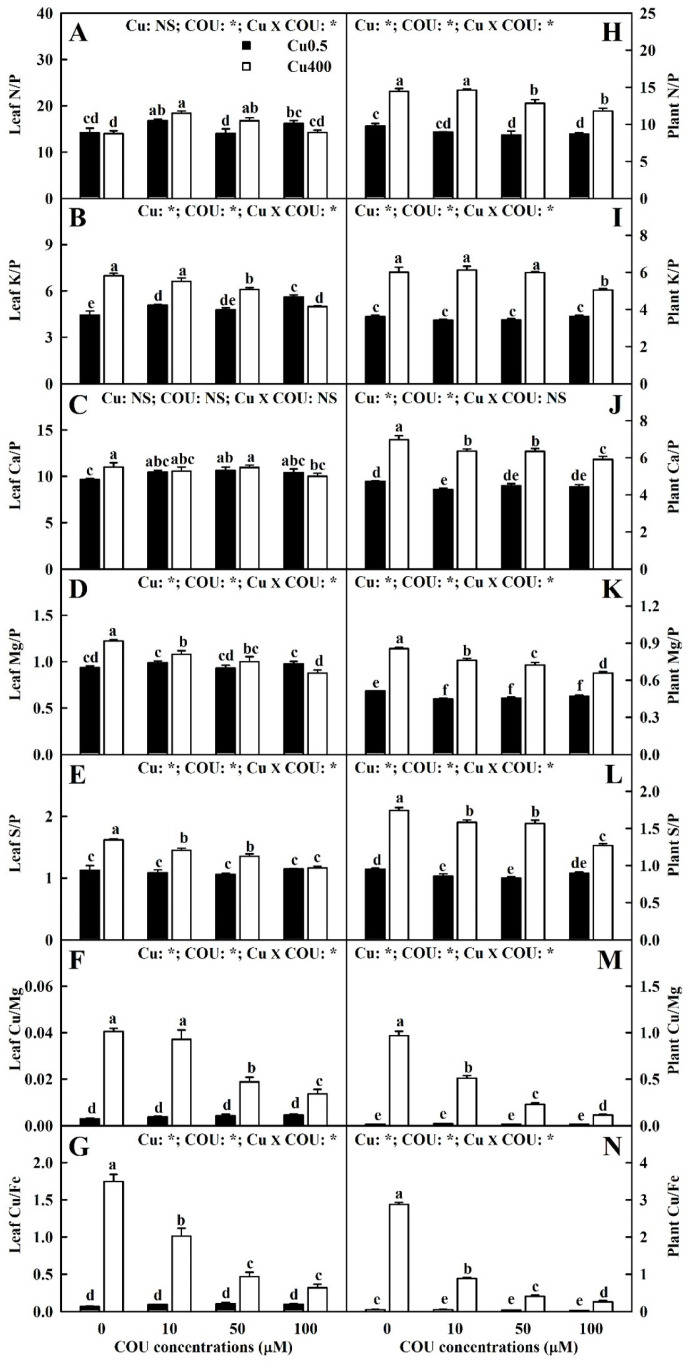
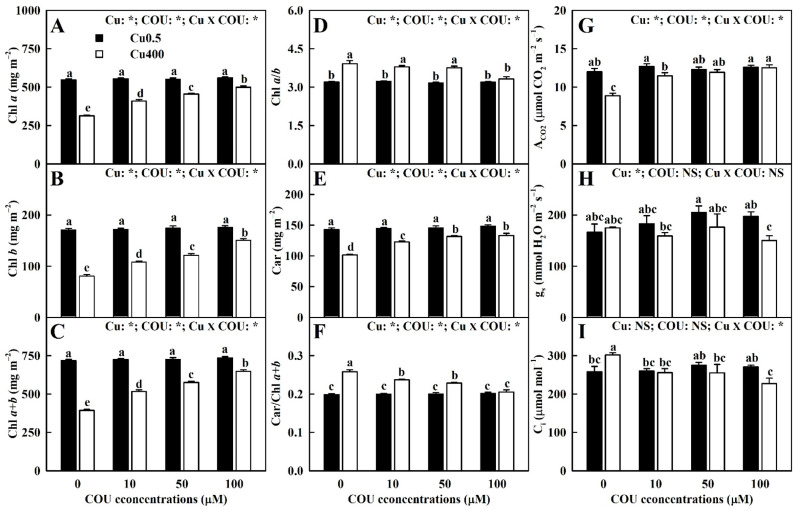
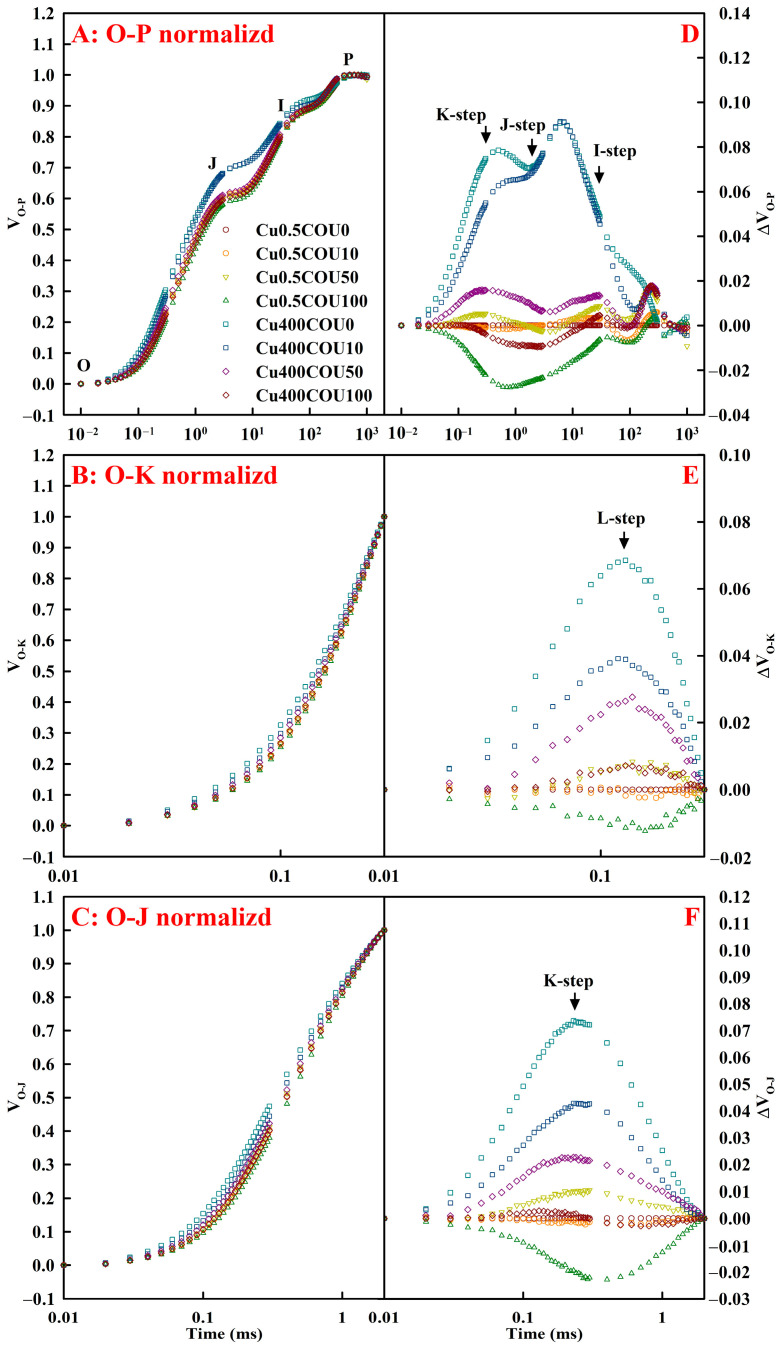
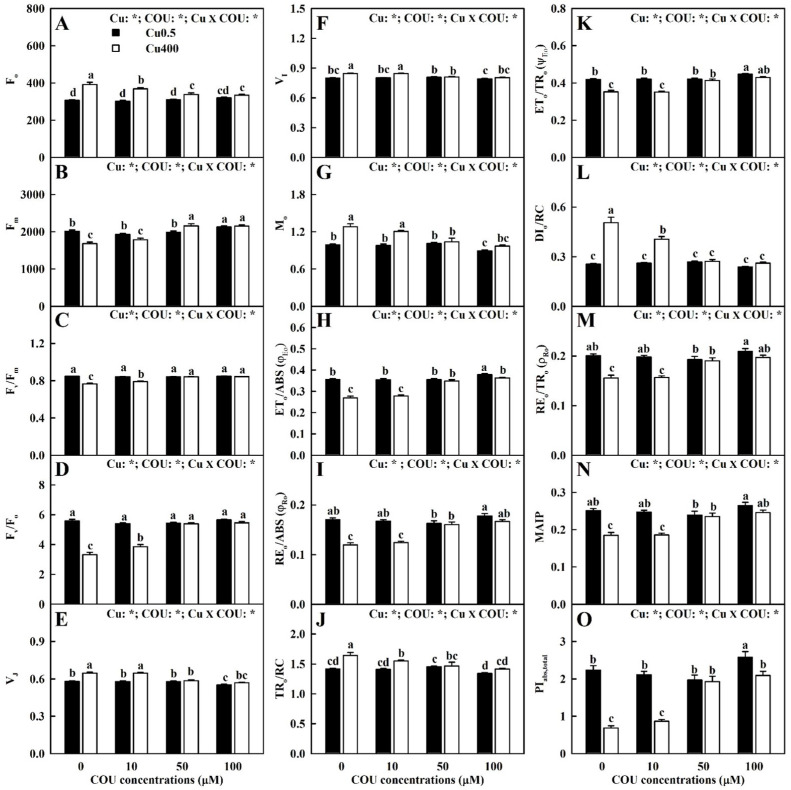
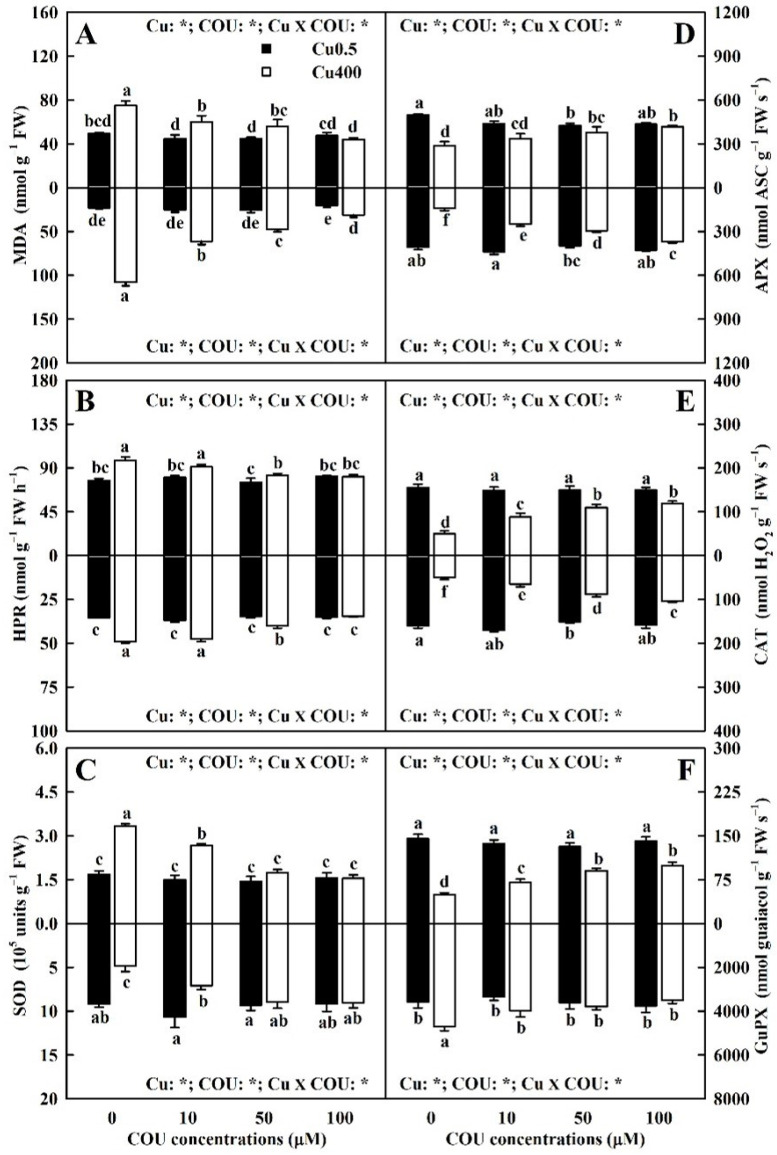
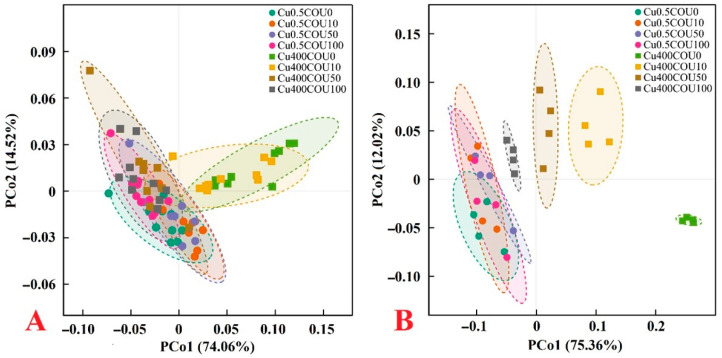
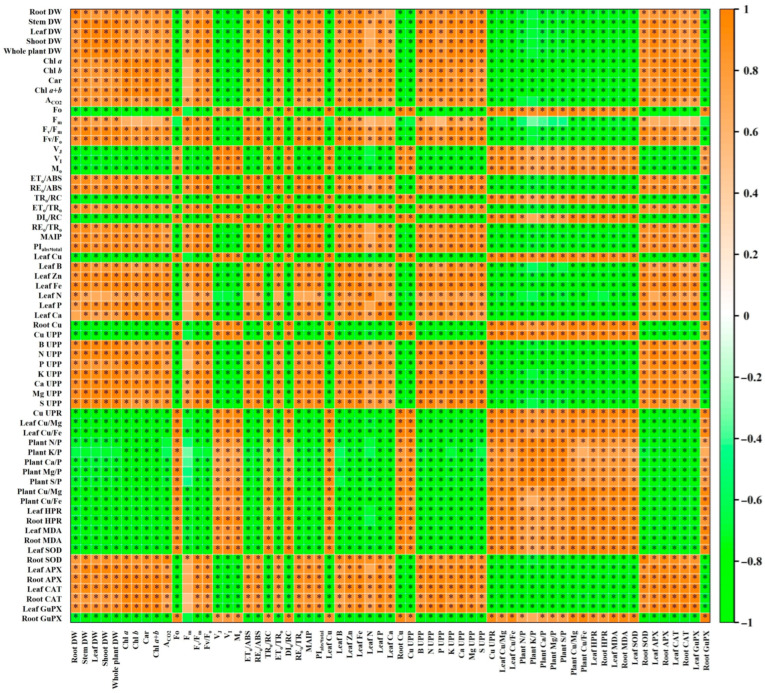
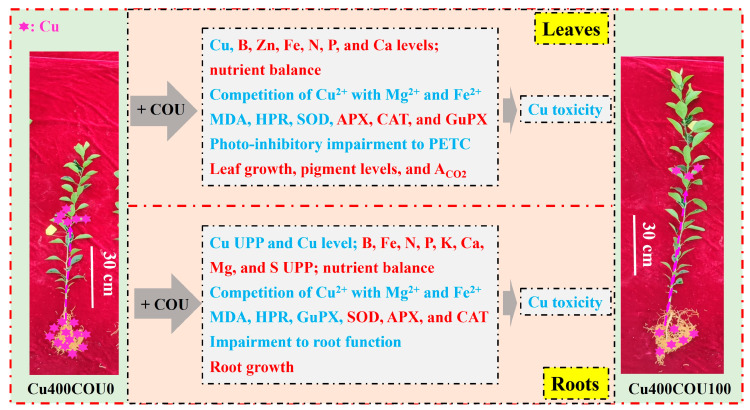
Excessive copper (Cu) has become a common physiological disorder restricting the sustainable production of citrus. Coumarin (COU) is a hydroxycinnamic acid that can protect plants from heavy metal toxicity. No data to date are available on the ameliorative effect of COU on plant Cu toxicity. 'Xuegan' (Citrus sinensis (L.) Osbeck) seedlings were treated for 24 weeks with nutrient solution containing two Cu levels (0.5 (Cu0.5) and 400 (Cu400) μM CuCl2) × four COU levels (0 (COU0), 10 (COU10), 50 (COU50), and 100 (COU100) μM COU). There were eight treatments in total. COU supply alleviated Cu400-induced increase in Cu absorption and oxidative injury in roots and leaves, decrease in growth, nutrient uptake, and leaf pigment concentrations and CO2 assimilation (ACO2), and photo-inhibitory impairment to the whole photosynthetic electron transport chain (PETC) in leaves, as revealed by chlorophyll a fluorescence (OJIP) transient. Further analysis suggested that the COU-mediated improvement of nutrient status (decreased competition of Cu2+ with Mg2+ and Fe2+, increased uptake of nutrients, and elevated ability to maintain nutrient balance) and mitigation of oxidative damage (decreased formation of reactive oxygen species and efficient detoxification system in leaves and roots) might lower the damage of Cu400 to roots and leaves (chloroplast ultrastructure and PETC), thereby improving the leaf pigment levels, ACO2, and growth of Cu400-treated seedlings.

Keywords: CO2 assimilation; chlorophyll a fluorescence (OJIP) transient; nutrient balance; reactive oxygen species.


Conflict of interest statement

The authors declare no conflicts of interest. The funders had no role in the design of the study; in the collection, analyses, or interpretation of data; in the writing of the manuscript; or in the decision to publish the results.

Figures

Figure 1
Figure 1
Effects of Cu-COU interactions on the mean (±SE, n = 10) root (A), stem (B), leaf (C), shoot (D), and whole plant (E) DW, root DW/shoot DW ratio (F), and shoot (G) and root (H) growth of Citrus sinensis seedlings. Significant differences were analyzed by two ANOVA and followed by the least significant difference (LSD) at p < 0.05. Error bars with different letters are significant different at p < 0.05. *, significant difference at p < 0.05; NS, non-significant difference. COU, coumarin; DW, dry weight; 1, 0.5 μM Cu + 0 μM COU; 2, 0.5 μM Cu + 10 μM COU; 3, 0.5 μM Cu + 50 μM COU; 4, 0.5 μM Cu + 100 μM COU; 5, 400 μM Cu + 0 μM COU; 6, 400 μM Cu + 10 μM COU; 7, 400 μM Cu + 50 μM COU; and 8, 400 μM Cu + 100 μM COU.
Figure 2
Figure 2
Effects of Cu-COU interactions on the mean (±SE, n = 4) concentrations of micronutrients in leaves (AE), stems (FJ), and roots (KO). Significant differences were analyzed by two ANOVA and followed by the LSD at p < 0.05. Error bars with different letters are significant different at p < 0.05. *, significant difference at p < 0.05; NS, non-significant difference.
Figure 3
Figure 3
Effects of Cu-COU interactions on the mean (±SE, n = 4) concentrations of macronutrients in leaves (AF), stems (GL), and roots (MR). Significant differences were analyzed by two ANOVA and followed by the LSD at p < 0.05. Error bars with different letters are significant different at p < 0.05. *, significant difference at p < 0.05; NS, non-significant difference.
Figure 4
Figure 4
Effects of Cu-COU interactions on the mean (±SE, n = 4) nutrient UPP (AK) and UPR (LV). UPP, uptake per plant; UPR, uptake per root DW. Significant differences were analyzed by two ANOVA and followed by the LSD at p < 0.05. Error bars with different letters are significant different at p < 0.05. *, significant difference at p < 0.05; NS, non-significant difference.
Figure 5
Figure 5
Effects of Cu-COU interactions on the mean (±SE, n = 4) ratios of N, K, Ca, Mg, and S (Mg and Fe) concentrations to P (Cu) concentration in leaves (AG) and ratios of N, K, Ca, Mg, and S (Mg and Fe) UPP to P (Cu) UPP (HN) in C. sinensis seedlings. Significant differences were analyzed by two ANOVA and followed by the LSD at p < 0.05. Error bars with different letters are significant different at p < 0.05. *, significant difference at p < 0.05; NS, non-significant difference.
Figure 6
Figure 6
Effects of Cu-COU interactions on the mean (±SE, n = 4) Chl a (A), Chl b (B), Chl a+b (C), Chl a/b (D), Car (E), Car/Chl a+b (F), ACO2 (G), gs (H), and Ci (I) in leaves. Significant differences were analyzed by two ANOVA and followed by the LSD at p < 0.05. Error bars with different letters are significant different at p < 0.05. *, significant difference at p < 0.05; NS, non-significant difference. ACO2, CO2 assimilation; Car, carotenoids; Chl, cholorophyll; Ci, intercellular CO2 concentration; gs, stomatal conductance.
Figure 7
Figure 7
Effects of Cu-COU interactions on the mean OJIP transients of ten measured samples normalized between O-P (VO-P), O-K (VO-K), and O-J (VO-J) (AC) and the differences in the eight samples to the reference sample treated with Cu0.5COU0 (DF). VO-P = (Ft − Fo)/(Fm − Fo); VO-K = (Ft − Fo)/(F300μs − Fo); VO-J = (Ft − Fo)/(FJ − Fo); Fm, maximum fluorescence; Fo, minimum fluorescence; Ft, fluorescence intensity at time t after onset of actinic illumination; F300μs, fluorescence intensity at 300 μs; FJ, fluorescence intensity at the J-step (2 ms).
Figure 8
Figure 8
Effects of Cu-COU interactions on the mean (±SE, n = 10) Fo (A), Fm (B), Fv/Fm (C), Fv/Fo (D), VJ (E), VI (F), Mo (G), ETo/ABS (H), REo/ABS (I), TRo/RC (J), ETo/TRo (K), DIo/RC (L), REo/TRo (M), MAIP (N), and PIabs,total (O) in leaves. Significant differences were analyzed by two ANOVA and followed by the LSD at p < 0.05. Error bars with different letters are significantly different at p < 0.05. *, significant difference at p < 0.05. Fo, minimum fluorescence; Fm, maximum fluorescence; Fv/Fm, maximum quantum yield of primary photochemistry; Fv/Fo, maximum primary yield of photochemistry of photosystem II (PSII); VJ, relative variable fluorescence at the J-step (2 ms); VI, relative variable fluorescence at the I-step (30 ms); Mo, approximated initial slope (in ms−1) of the fluorescence transient V = f(t); ETo/ABS (φEo), quantum yield for electron transport; REo/ABS (φRo), quantum yield for the reduction in end acceptors of photosystem I per photon absorbed; TRo/RC, trapped energy flux per reaction center; ETo/TRoEo), probability that a trapped exciton moves an electron into the electron transport chain beyond QA; DIo/RC, specific energy fluxes per reaction center for energy dissipation; REo/TRoRo), efficiency with which a trapped exciton can move an electron into the electron transport chain from QA to the photosystem I end electron acceptors; MAIP, maximum amplitude of IP phase; PIabs,total, total performance index.
Figure 9
Figure 9
Effects of Cu-COU interactions on the mean (±SE, n = 4) concentrations of MDA (A), HPR (B), and activities of SOD (C), APX (D), CAT (E), and GuPX (F) in leaves (above column) and roots (below column). Significant differences were analyzed by two ANOVA and followed by the LSD at p < 0.05. Error bars with different letters are significant different at p < 0.05. *, significant difference at p < 0.05. APX, ascorbate peroxidase; CAT, catalase; COU, coumarin; GuPX, guaiacol peroxidase; HPR, H2O2 production rate; MDA, malondialdehyde; SOD, superoxide dismutase.
Figure 10
Figure 10
PCoA plots of 21 parameters for growth (6) and fluorescence (15) (A) and 123 parameters for nutrients (33 nutrient concentrations, 33 nutrient fractions, 11 nutrient UPR, 11 nutrient UPP, and 14 ratio), pigments (6), gas exchange (3), antioxidant enzymes (8), MDA (2), and HPR (2) (B) from C. sinensis seedlings submitted to different Cu and COU levels. PCoA, principal coordinate analysis; Cu0.5COU0, 0.5 μM Cu + 0 μM COU; Cu0.5COU10, 0.5 μM Cu + 10 μM COU; Cu0.5COU50, 0.5 μM Cu + 50 μM COU; Cu0.5COU100, 0.5 μM Cu + 100 μM COU; Cu400COU0, 400 μM Cu + 0 μM COU; Cu400COU10, 400 μM Cu + 10 μM COU; Cu400COU50, 400 μM Cu + 50 μM COU; Cu400COU100, 400 μM Cu + 100 μM COU.
Figure 11
Figure 11
Matrices of Pearson correlation coefficients (PCCs) for the mean values of 63 physiological parameters in C. sinensis leaves and roots. Data came from Figure 1, Figure 2, Figure 3, Figure 4, Figure 5 and Figure 6, Figure 8, and Figure 9. *, significant difference at p < 0.05; leaf element (pigment), leaf (pigment) concentration; root element, root element concentration; leaf (root) enzyme, leaf (root) enzyme activity.
Figure 12
Figure 12
A proposed model for the underlying mechanisms by which COU mitigated copper toxicity in Citrus sinensis seedlings. Red, upregulation. Blue, downregulation.

Similar articles

References

    1. Yruela I. Copper in plants: Acquisition, transport and interactions. Funct. Plant Biol. 2009;36:409–430. doi: 10.1071/FP08288. - DOI - PubMed
    1. Broadley M., Brown P., Cakmak I., Rengel Z., Zhao F. Function of nutrients: Micronutrients. In: Marschner P., editor. Marschner’s Mineral Nutrition of Higher Plants. 3rd ed. Academic; Amsterdam, The Netherlands: 2012. pp. 191–248.
    1. Fardus J., Hossain S., Rob M.M., Fujita M. L-glutamic acid modulates antioxidant defense systems and nutrient homeostasis in lentil (Lens culinaris Medik.) under copper toxicity. Environ. Sci. Pollut. Res. 2023;30:78507–78520. doi: 10.1007/s11356-023-27993-0. - DOI - PubMed
    1. Feil S.B., Pii Y., Valentinuzzi F., Tiziani R., Mimmo T., Cesco S. Copper toxicity affects phosphorus uptake mechanisms at molecular and physiological levels in Cucumis sativus plants. Plant Physiol. Biochem. 2020;157:138–147. doi: 10.1016/j.plaphy.2020.10.023. - DOI - PubMed
    1. Chen X.-F., Hua D., Zheng Z.-C., Zhang J., Huang W.-T., Chen H.-H., Huang Z.-R., Yang L.-T., Ye X., Chen L.-S. Boron-mediated amelioration of copper-toxicity in sweet orange [Citrus sinensis (L.) Osbeck cv. Xuegan] seedlings involved reduced damage to roots and improved nutrition and water status. Ecotoxicol. Environ. Saf. 2022;234:113423. doi: 10.1016/j.ecoenv.2022.113423. - DOI - PubMed

LinkOut - more resources