. 2024 Dec 23;13(24):3595.
doi: 10.3390/plants13243595.

Genome-Wide Identification and Expression Analysis of NAC Gene Family Members in Seashore Paspalum Under Salt Stress

Affiliations

Genome-Wide Identification and Expression Analysis of NAC Gene Family Members in Seashore Paspalum Under Salt Stress

Xuanyang Wu et al. Plants (Basel). .

Abstract

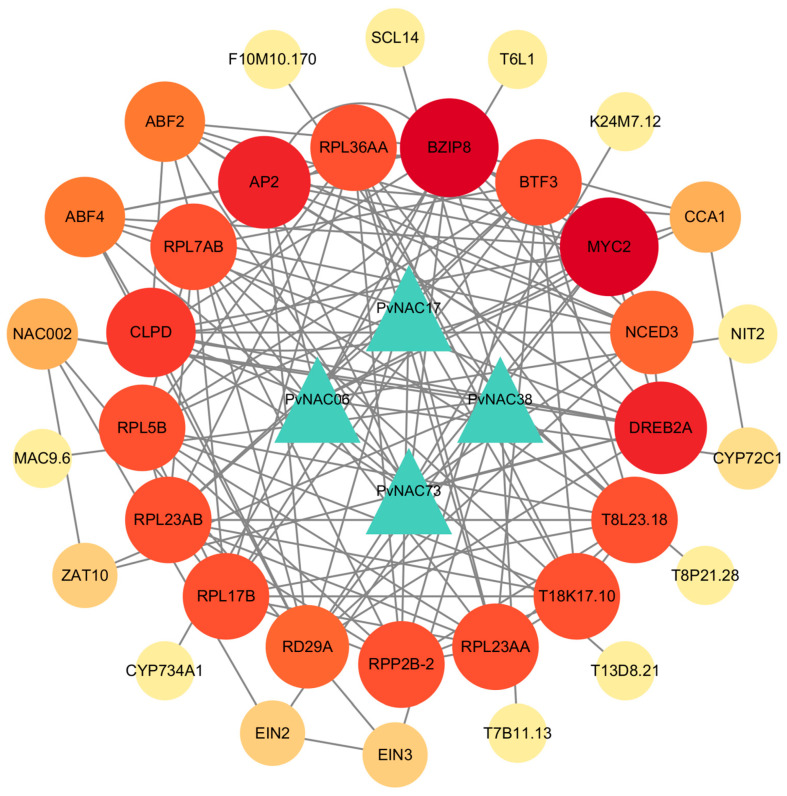
The NAC gene family plays a crucial role in plant growth, development, and responses to biotic and abiotic stresses. Paspalum Vaginatum, a warm-season turfgrass with exceptional salt tolerance, can be irrigated with seawater. However, the NAC gene family in seashore paspalum remains poorly understood. In this study, genome-wide screening and identification were conducted based on the NAC (NAM) domain hidden Markov model in seashore paspalum, resulting in the identification of 168 PvNAC genes. A phylogenetic tree was constructed, and the genes were classified into 18 groups according to their topological structure. The physicochemical properties of the PvNAC gene family proteins, their conserved motifs and structural domains, cis-acting elements, intraspecific collinearity analysis, GO annotation analysis, and protein-protein interaction networks were analyzed. The results indicated that the majority of PvNAC proteins are hydrophilic and predominantly localized in the nucleus. The promoter regions of PvNACs are primarily enriched with light-responsive elements, ABRE motifs, MYB motifs, and others. Intraspecific collinearity analysis suggests that PvNACs may have experienced a large-scale gene duplication event. GO annotation indicated that PvNAC genes were essential for transcriptional regulation, organ development, and responses to environmental stimuli. Furthermore, the protein interaction network predicted that PvNAC73 interacts with proteins such as BZIP8 and DREB2A to form a major regulatory hub. The transcriptomic analysis investigates the expression patterns of NAC genes in both leaves and roots under varying durations of salt stress. The expression levels of 8 PvNACs in roots and leaves under salt stress were examined and increased to varying degrees under salt stress. The qRT-PCR results demonstrated that the expression levels of the selected genes were consistent with the FPKM value trends observed in the RNA-seq data. This study established a theoretical basis for understanding the molecular functions and regulatory mechanisms of the NAC gene family in seashore paspalum under salt stress.

Keywords: NAC TFs; Paspalum Vaginatum; molecular breeding; qRT-PCR; salt stress response.


Conflict of interest statement

The authors declare no conflicts of interest.

Figures

Figure 1
Figure 1
Phylogenetic tree of the PvNAC gene family in seashore paspalum. Different colors represent distinct subgroups, with clustering indicating potential functional similarities among closely related genes within each clade.
Figure 2
Figure 2
Chromosomal localization and syntenic relationships of PvNAC genes. The chromosomal distribution of the 168 PvNAC genes within the seashore paspalum genome is depicted. Each PvNAC gene is labeled according to its chromosomal location (A). The syntenic relationships are illustrated, with large-scale duplications indicated by orange lines connecting duplicated NAC gene pairs. The gray regions represent syntenic blocks, while the orange lines highlight the duplicated gene pairs, suggesting potential evolutionary events within the NAC gene family (B).
Figure 3
Figure 3
Gene ontology (GO) enrichment analysis of differentially expressed genes (DGEs) in seashore paspalum. Comparative DEGs from L6 vs. R6 (A), L48 vs. R48 (B), and L120 vs. R120 (C) were analyzed via GO, with enriched terms in biological process, cellular component, and molecular function displayed as a histogram. The X-axis displayed the −log10(p-value), reflecting the statistical significance of the enriched GO terms of PvNAC, with higher values indicating greater significance of enrichment (D).
Figure 4
Figure 4
Comprehensive Analysis of PvNAC Gene Expression Under 0.2 M NaCl Treatment. (A) This heatmap depicts the Pearson correlation coefficients (R2) between all experimental samples. Both the X and Y axes list the sample identifiers, while the color intensity represents the strength of the correlation, with a gradient from blue (low correlation) to dark red (high correlation). Darker shades indicate stronger positive correlations (R2 approaching 1), facilitating the assessment of sample similarity and reproducibility. (B) The box plot illustrates the distribution of normalized PvNAC gene expression levels (log2(FPKM + 1)) across all samples. The X-axis categorizes the samples by their respective names, and the Y-axis quantifies the expression levels. Each box represents the interquartile range (IQR) with the median indicated by the horizontal line, while whiskers extend to the minimum and maximum values, excluding outliers. (C) This heatmap showcases the differential expression of PvNAC genes in leaf (L) and root (R) tissues at three distinct time points (6, 48, and 120 h) under 0.2 M NaCl treatment. Sample identifiers are denoted as L-6, L-48, and L-120 for leaves and R-6, R-48, and R-120 for roots. Expression levels are color-coded using a red-to-blue gradient, where red signifies upregulation and blue indicates downregulation relative to the 0 h control.
Figure 5
Figure 5
Expression levels of PvNAC genes in roots and leaves under salt stress. (AH) illustrate the trends of transcriptome and gene expression levels of NAC genes under salt stress. Transcriptome data were presented as Log2 fold changes of FPKM values, comparing treatments L-6, L-48, L-120, R-6, R-48, and R-120 against the control groups L-0 and R-0, respectively. The relative gene expression levels, as determined by qRT-PCR, were quantified using the Log2(2−ΔΔCt) method, further validating the trends in gene expression changes. Different letters above the bars indicated statistically significant differences determined by ANOVA (p < 0.05). The presented data represent the means of three independent experiments, with error bars denoting the standard error.
Figure 6
Figure 6
Protein–protein interaction network of PvNAC proteins. The network was constructed with a medium confidence threshold of 0.4. Node color intensity corresponds to the degree value, with darker shades indicating higher connectivity (more interactions). Triangles represent PvNAC proteins (the target proteins in this study), while circles denote their interacting partners. Solid gray lines between nodes indicate protein–protein interactions, with uniform line density and connection strength across the network.

Similar articles

References

    1. Ülker B., Somssich I.E. WRKY Transcription Factors: From DNA Binding towards Biological Function. Curr. Opin. Plant Biol. 2004;7:491–498. doi: 10.1016/j.pbi.2004.07.012. - DOI - PubMed
    1. Liu W., Stewart C.N. Plant Synthetic Promoters and Transcription Factors. Curr. Opin. Biotech. 2016;37:36–44. doi: 10.1016/j.copbio.2015.10.001. - DOI - PubMed
    1. Eulgem T., Rushton P.J., Robatzek S., Somssich I.E. The WRKY Superfamily of Plant Transcription Factors. Trends Plant Sci. 2000;5:199–206. doi: 10.1016/S1360-1385(00)01600-9. - DOI - PubMed
    1. Ishiguro S., Nakamura K. Characterization of a cDNA Encoding a Novel DNA-Binding Protein, SPF1, That Recognizes SP8 Sequences in the 5′ Upstream Regions of Genes Coding for Sporamin and β-Amylase from Sweet Potato. Mol. Genet. Genom. 1994;244:563–571. doi: 10.1007/BF00282746. - DOI - PubMed
    1. Rose A., Manikantan S., Schraegle S.J., Maloy M.A., Stahlberg E.A., Meier I. Genome-Wide Identification of Arabidopsis Coiled-Coil Proteins and Establishment of the ARABI-COIL Database. Plant Physiol. 2004;134:927–939. doi: 10.1104/pp.103.035626. - DOI - PMC - PubMed

LinkOut - more resources