. 2024 Dec 23;13(24):3602.
doi: 10.3390/plants13243602.

Comparative Physiological and Transcriptomics Profiling Provides Integrated Insight into Melatonin Mediated Salt and Copper Stress Tolerance in Selenicereus undatus L

Affiliations

Comparative Physiological and Transcriptomics Profiling Provides Integrated Insight into Melatonin Mediated Salt and Copper Stress Tolerance in Selenicereus undatus L

Darya Khan et al. Plants (Basel). .

Abstract

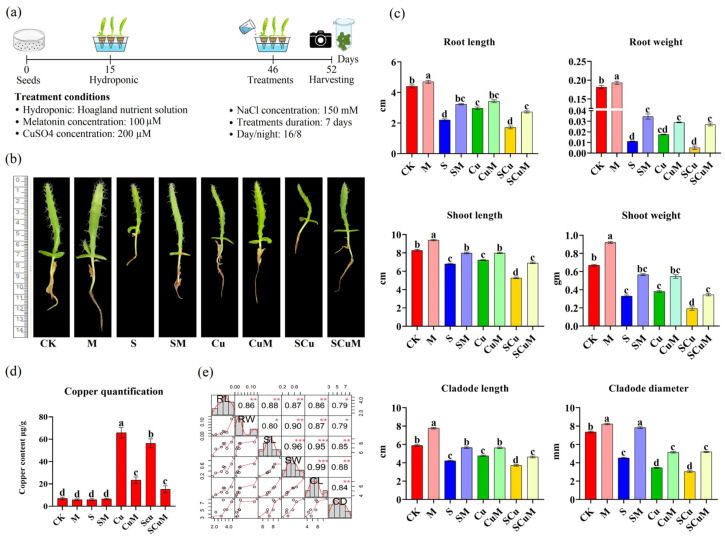
Selenicereus undatus L., (pitaya) is an important tropical fruit crop, and faces significant challenges from soil salinity and heavy metal toxicity. This study explores the role of melatonin (M) in enhancing stress tolerance in pitaya against salinity (S) and copper (Cu) toxicity, both individually and in combination (SCu). SCu stress reduced plant biomass by ~54%, while melatonin application mitigated stress effects and increased plant growth by ~73.26% under SCuM compared to SCu treatment. Antioxidant activities were also modulated by stress. Transcriptomic analysis revealed 21 differentially expressed genes (DEGs) common across stress treatments and 13 DEGs specific to combined melatonin with stress treatments involved in stress signaling, secondary metabolite biosynthesis, and photosynthesis. A weighted gene co-expression network analysis (WGCNA) identified four gene modules (brown, dark green, dark grey, and grey) significantly associated with phenotypic traits. A protein-protein interaction (PPI) network analysis highlighted 14 hub genes per module, including GH3, JAZ, PAL, CCR, and POD, implicated in MAPK signaling, phenylpropanoid biosynthesis, and hormone signaling pathways. Integration of DESeq2 and WGCNA identified 12 key stress-responsive genes strongly correlated with phenotypic traits. This study provides insights into regulatory mechanisms underlying stress responses and highlights candidate genes for developing stress-resilient S. undatus through breeding programs.

Keywords: Selenicereus undatus L.; WGCNA; abiotic stresses; physiology; transcriptomic.


Conflict of interest statement

The authors declare no conflicts of interest.

Figures

Figure 1
Figure 1
Influence of single and combined stresses treatments of melatonin (M), salt (S), and copper (Cu) on the growth of pitaya seedlings. (a) Overview of the experimental steps and treatment conditions followed for the experiment. Plants were harvested and photographed on day 52. (b) Phenotype of seedlings on day 52, treated with a total of 8 different treatment combinations [control (CK), M, S, SM, Cu, CuM, SCu, and SCuM]. (c) Phenotypic attributes of the seedlings were measured as RL, SL, CL (unit = cm), RW, SW (unit = gm), and CD (unit = mm). According to the Duncan test, different letters indicate a significant difference (p < 0.05) among the treatments. (d) Quantification of Cu heavy metal (unit = μg/g) in cladode tissue under single and combined abiotic stress treatments. (e) Significant phenotypic correlation between the root length (RL), root weight (RW), cladode length (CL), cladode diameter (CD), shoot length (SL), and shoot weight (SW). Significant and highly significant correlations are represented by * (p < 0.05), ** (p < 0.01) and *** (p < 0.001). The error bars represent the mean ± SE.
Figure 2
Figure 2
Antioxidative response of pitaya towards single and combined abiotic stress treatments including control (CK), melatonin (M), salt (S), and copper (Cu). (a) Generation of ROS (H2O2) under all treatments, (b) Superoxide dismutase (SOD), (c) Peroxidase (POD), (d) Catalase (CAT), (e) Ascorbate peroxidase (APX), (f) Proline. According to the Duncan test, different letters indicate a significant difference (p < 0.05) among the treatments. The error bars represent the mean ± SE.
Figure 3
Figure 3
Single and combined effect of melatonin (M), salt (S), and copper (Cu) on pitaya photosynthetic pigments. (a) chlorophyll a, (b) chlorophyll b, (c) total chlorophyll, (d) carotenoid. According to the Duncan test, different letters indicate a significant difference (p < 0.05) among the treatments. The error bars represent the mean ± SE.
Figure 4
Figure 4
RNA−sequencing overview of pitaya seedling samples under single and combined treatments of control (CK), melatonin (M), salt (S), and copper (Cu). (a) Correlation heatmap shows the gene expression levels between both the replicates of treatment, including CK, M, S, Cu, SM, CuM, SCu, and SCuM. (b) Boxplot shows differences between the samples of both replicates using log10 transformation of FPKM values.
Figure 5
Figure 5
DEGs−based analysis under single and combined treatments, including control (CK), melatonin (M), salt (S), and copper (Cu). (a) Number of DEGs in the treatments M, S, Cu, and SCu compared to CK and SM, CuM, and SCuM compared S, Cu, and SCu, respectively. Red bars show upregulated DEGs, and blue bars shows downregulated DEGs. (b,c) Venn diagram shows the number of common and unique genes in different treatments comparison as: (b) CK-vs-M/CK-vs-S/CK-vs-Cu/CK-vs-SCu and (c) S-vs-SM/Cu-vs-CuM/SCu-vs-SCuM.
Figure 6
Figure 6
Gene ontology enrichment analysis of the DEGs under melatonin (M) treatment compared to control (CK). The size of circular dots shows the number of DEGs in each GO term. The color bar from green (min.) to red (max.) shows the enrichment of GO terms based on the Q-value of the DEGs.
Figure 7
Figure 7
The Kyoto Encyclopedia of Genes and Genomes annotation and enrichment (KEGG) analysis of the DEGs identified in each melatonin (M) treatment compared to control (CK). The size of circular dots shows the number of DEGs in each pathway. The color bar from green (min.) to red (max.) shows the enrichment of pathways based on the Q-value of the DEGs.
Figure 8
Figure 8
Weighted gene co-expression network analysis. (a) Clustering dendrogram, module construction, and correlation between modules and treatments. (b) Heatmap for the relationships of modules and plant traits. Each cell comprises corresponding correlations and p-value. Red color cells show positive correlations, and blue color shows negative correlations.
Figure 9
Figure 9
Gene ontology and the Kyoto Encyclopedia of Genes and Genomes annotation and enrichment analysis of the DEGs identified in the brown module. (a) Top 20 GO enrichments in the brown module. (b) Top 20 KEGG enrichments in the brown module. The color bar from green (min.) to red (max.) shows the enrichment of pathways based on the Q-value of the DEGs.
Figure 10
Figure 10
Co-expression network of hub genes. (a) Hub genes in the brown module. (b) Hub genes in the dark green module. (c) Hub genes in the dark grey module. (d) Hub genes in the grey module. Red, orange, and yellow color shows highest, moderate, and low interaction of genes. Top 14 nodes were predicted using the cytoHubba program in Cytoscape.
Figure 11
Figure 11
RT−qPCR analysis of candidate genes and comparison with RNA-seq. Variables at left side indicate expression of RT-qPCR and variables at right side indicate expression of RNA-seq. Blue bars show expression results of RT-qPCR and red lines with dots show expression of RNA-seq.

Similar articles

Cited by

References

    1. Chen J., Xie F., Cui Y., Chen C., Lu W., Hu X., Hua Q., Zhao J., Wu Z., Gao D., et al. A chromosome-scale genome sequence of pitaya (Hylocereus undatus) provides novel insights into the genome evolution and regulation of betalain biosynthesis. Hortic. Res. 2021;8:164. doi: 10.1038/s41438-021-00612-0. - DOI - PMC - PubMed
    1. Nerd A., Tel-Zur N., Mizrahi Y. Fruits of vine and columnar cacti. In: Nobel P.S., editor. Cacti, Biology and Uses. University of California Press; Los Angeles, CA, USA: 2002. pp. 185–198.
    1. Khan D., Harris A., Zaman Q.U., Wang H.X., Wen J., Landis J.B., Wang H.F. The evolutionary history and distribution of cactus germplasm resources, as well as potential domestication under a changing climate. J. Syst. Evol. 2024;62:858–875. doi: 10.1111/jse.13042. - DOI
    1. Le Bellec F., Vaillant F., Imbert E. Pitahaya (Hylocereus spp.): A new fruit crop, a market with a future. Fruits. 2006;61:237–250. doi: 10.1051/fruits:2006021. - DOI
    1. Ibrahim S.R.M., Mohamed G.A., Khedr A.I.M., Zayed M.F., El-Kholy A.A.E.S. Genus Hylocereus: Beneficial phytochemicals, nutritional importance, and biological relevance—A review. J. Food Biochem. 2018;42:e12491. doi: 10.1111/jfbc.12491. - DOI

LinkOut - more resources