. 2024 Dec 10;16(24):3450.
doi: 10.3390/polym16243450.

Biodegradation Assessment of Bioplastic Carrier Bags Under Industrial-Scale Composting Conditions

Affiliations

Biodegradation Assessment of Bioplastic Carrier Bags Under Industrial-Scale Composting Conditions

Mária Mörtl et al. Polymers (Basel). .

Abstract

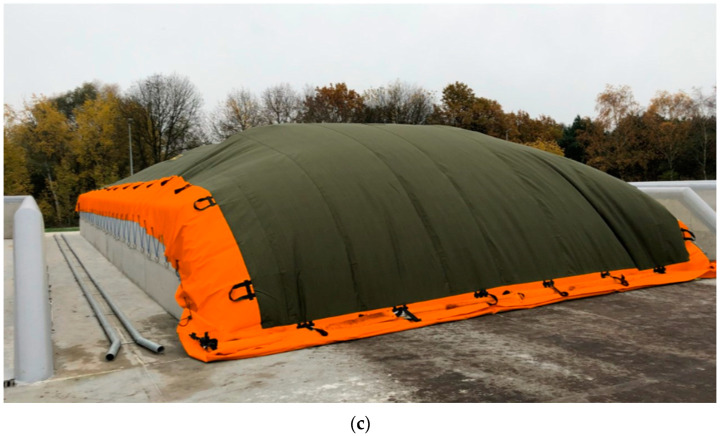
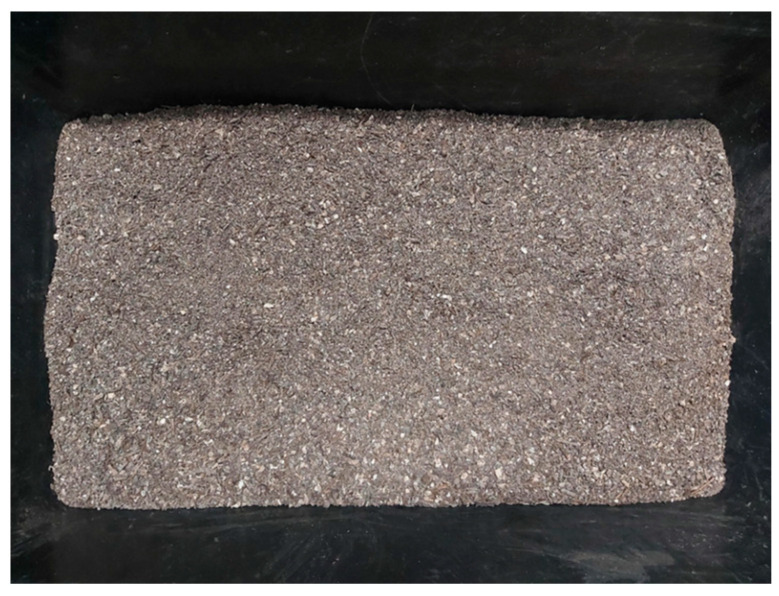
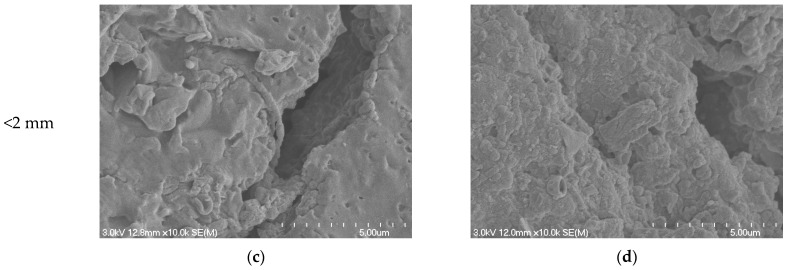
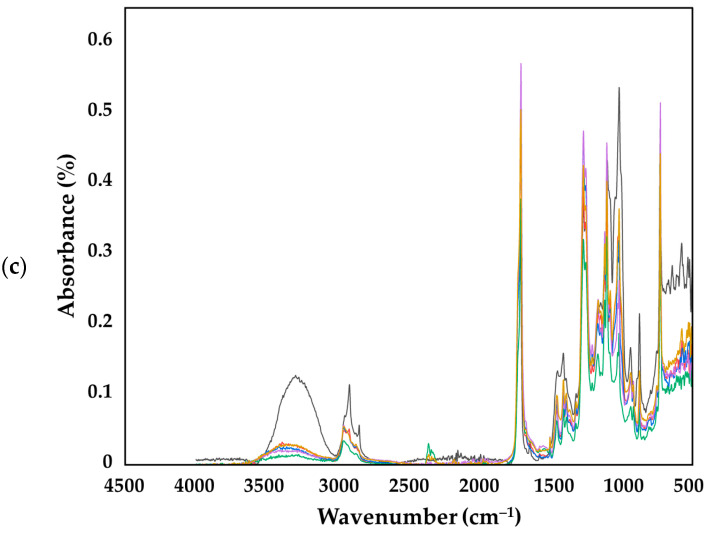
In recent years, the environmental impacts of plastic production and consumption have become increasingly significant, particularly due to their petroleum-based origins and the substantial waste management challenges they pose. Currently, global plastic waste production has reached 413.8 million metric tons across 192 countries, contributing notably to greenhouse gas emissions. Bioplastics have emerged as eco-friendly alternatives, with bioplastic carrier bags composed of 20% starch, 10% additives, and 70% polybutylene adipate terephthalate (PBAT) being the focus of this research. This study aimed to evaluate the biodegradation of these bioplastic bags under industrial composting conditions, addressing the gap in the existing literature that often lacks real-world applicability. A large-scale composting experiment was conducted using 37.5 tons of manure/wood and 50 tons of biopolymer bags over 12 weeks. Results showed that compost temperatures peaked at 70 °C and remained above 50 °C, pH levels stabilized at 8.16, and electrical conductivity was recorded at 1251 μs cm-1. Significant changes were observed in key metrics, such as the carbon-to-nitrogen ratio and organic matter content. Disintegration tests revealed that 95% of the bags disintegrated by the 12th week, though ecotoxicity tests indicated varying germination inhibition rates. Advanced analytical methods (Fourier transform infrared spectroscopy, gas chromatography coupled with mass spectrometry) highlighted morphological and chemical transformations in the bags. This research enhances understanding of bioplastic degradation in real-world composting environments and suggests potential improvements to existing standards, promoting sustainable waste management solutions.

Keywords: FTIR; GC-MS; PBAT; biodegradation; biopolymer; composting.


Conflict of interest statement

Authors Mariem Damak, Zsolt István Varga, György Fekete, and László Aleksza were employed by the company Profikomp Environmental Technologies Inc. The remaining authors declare that the research was conducted in the absence of any commercial or financial relationships that could be construed as a potential conflict of interest.

Figures

Figure 1
Figure 1
Composting of polybutylene adipate terephthalate-based bioplastic carrier bags, composed of 20% starch, 10% additives, and 70% polybutylene adipate terephthalate at the industrial scale (50 tons), in a membrane-covered side-walled aerated static pile (ASP) system covered with expanded polytetrafluoroethylene membrane cover ProfiCover®, Profikomp Environmental Technologies Inc., Gödöllő, Hungary), located near Orosháza, Békés County, Hungary. (a,b) Composting setup before the experiment. (c) ASP during composting.
Figure 1
Figure 1
Composting of polybutylene adipate terephthalate-based bioplastic carrier bags, composed of 20% starch, 10% additives, and 70% polybutylene adipate terephthalate at the industrial scale (50 tons), in a membrane-covered side-walled aerated static pile (ASP) system covered with expanded polytetrafluoroethylene membrane cover ProfiCover®, Profikomp Environmental Technologies Inc., Gödöllő, Hungary), located near Orosháza, Békés County, Hungary. (a,b) Composting setup before the experiment. (c) ASP during composting.
Figure 2
Figure 2
Temperature curve during the 12 weeks of the composting process.
Figure 3
Figure 3
Evolution of respiration activity (AT4) during the 12 weeks of the composting process.
Figure 4
Figure 4
Degree of disintegration of biopolymer during the 12 weeks of the composting process.
Figure 5
Figure 5
Representative pictures taken during the disintegration of the biopolymer fraction greater than 2 mm (a) on the first day, (b) on the 6th week, and (c) on the 12th week of the composting process.
Figure 6
Figure 6
Visual compost matrix after 1 year of maturation.
Figure 7
Figure 7
(ad) Images of fragments retained in the compost matrix after the 2nd week of composting; (eh) images of fragments retained in the compost matrix after the 12th week of composting.
Figure 7
Figure 7
(ad) Images of fragments retained in the compost matrix after the 2nd week of composting; (eh) images of fragments retained in the compost matrix after the 12th week of composting.
Figure 8
Figure 8
Scanning electron microscope micrographs of a sample material captured at varying magnifications. (a) 35× magnification offering a broad overview of the surface. (b) 700× magnification showcasing a unique fibrous texture. (c) 7.02 k magnification detailing intricate surface nodules and irregularities. (d) 10.0 k magnification showing granular formations and the intricate nature of the surface.
Figure 9
Figure 9
Scanning electron microscope micrographs depicting morphological changes in carrier bag fragments over the course of composting. (a) Week 6 fragment from the >2 mm compost fraction, revealing initial surface disruptions and cracks. (b) Week 12 fragment from the >2 mm compost fraction, highlighting intensified degradation with pronounced irregularities. (c) Week 6 fragment from the <2 mm compost fraction, showcasing initial signs of wear and surface cracks. (d) Week 12 fragment from the <2 mm compost fraction, exhibiting marked surface degradation and increased cracking patterns.
Figure 9
Figure 9
Scanning electron microscope micrographs depicting morphological changes in carrier bag fragments over the course of composting. (a) Week 6 fragment from the >2 mm compost fraction, revealing initial surface disruptions and cracks. (b) Week 12 fragment from the >2 mm compost fraction, highlighting intensified degradation with pronounced irregularities. (c) Week 6 fragment from the <2 mm compost fraction, showcasing initial signs of wear and surface cracks. (d) Week 12 fragment from the <2 mm compost fraction, exhibiting marked surface degradation and increased cracking patterns.
Figure 10
Figure 10
Fourier transform infrared (FTIR) spectra of the polybutylene adipate terephthalate-based bioplastic bag material. (a) Comparing the raw sample (gray line) to the sample after 12 weeks (blue line) of composting. (b) The bioplastic bag fragments (>2 mm) comparing the raw sample fraction (gray line) to sample fractions after 2 weeks (red line), 4 weeks (blue line), 6 weeks (green line), 8 weeks (purple line), 10 weeks (yellow line), and 12 weeks (turquois line) of composting. (c) The PBAT-based bioplastic carrier bag fragments (>2 mm) comparing the raw sample fraction (gray line) to sample fractions after 4 weeks (red line), 6 weeks (blue line), 8 weeks (green line), 10 weeks (purple line), and 12 weeks (yellow line) of composting.
Figure 10
Figure 10
Fourier transform infrared (FTIR) spectra of the polybutylene adipate terephthalate-based bioplastic bag material. (a) Comparing the raw sample (gray line) to the sample after 12 weeks (blue line) of composting. (b) The bioplastic bag fragments (>2 mm) comparing the raw sample fraction (gray line) to sample fractions after 2 weeks (red line), 4 weeks (blue line), 6 weeks (green line), 8 weeks (purple line), 10 weeks (yellow line), and 12 weeks (turquois line) of composting. (c) The PBAT-based bioplastic carrier bag fragments (>2 mm) comparing the raw sample fraction (gray line) to sample fractions after 4 weeks (red line), 6 weeks (blue line), 8 weeks (green line), 10 weeks (purple line), and 12 weeks (yellow line) of composting.
Figure 11
Figure 11
GC-MS chromatogram of the sample showing the distribution and abundance of key compounds after 2 weeks of composting (a) and after 1-year maturation (b).
Figure 12
Figure 12
Mass spectra recorded for bis(trimethylsilyl) derivatives of the intermediate metabolites 4-hydroxybutyl)adipate (AA+) (a), bis(4-hydroxybutyl)adipate (AA++) (b), and (4-hydroxybutyl)terephalate (PTA+) (c).
Figure 12
Figure 12
Mass spectra recorded for bis(trimethylsilyl) derivatives of the intermediate metabolites 4-hydroxybutyl)adipate (AA+) (a), bis(4-hydroxybutyl)adipate (AA++) (b), and (4-hydroxybutyl)terephalate (PTA+) (c).
Figure 13
Figure 13
GC-MS chromatograms for <2 mm and >2 mm fractions at 2 (a), 6 (b), and 12 (c) weeks.
Figure 14
Figure 14
Concentrations in the polybutylene adipate terephthalate-based bioplastic bag fragments from >2 mm (a,b) and <2 mm (c,d) compost fraction observed at the 2nd, 6th, and 12th weeks of composting experiment. (a,b) shows the levels of AA (■ red) and PTA (▲ green). 1,4-butanediol (♦ blue). (c,d) present the estimated levels for AA+ (□ red), PTA+ (∆ green), and AA++ (◊ blue) based on m/z = 111.

References

    1. Üveges Z., Damak M., Klátyik S., Ramay M.W., Fekete G., Varga Z., Gyuricza C., Székács A., Aleksza L. Biomethane potential in anaerobic biodegradation of commercial bioplastic materials. Fermentation. 2023;9:261. doi: 10.3390/fermentation9030261. - DOI
    1. Statista . Annual Production of Plastics Worldwide from 1950 to 2023. Statista Research Department; New York, NY, USA: 2024. [(accessed on 25 November 2024)]. Available online: https://www.statista.com/statistics/282732/global-production-of-plastics....
    1. OECD . Policy Scenarios for Eliminating Plastic Pollution by 2040. OECD; Paris, France: 2024. [(accessed on 25 November 2024)]. Available online: https://www.oecd.org/en/publications/policy-scenarios-for-eliminating-pl.... - DOI
    1. OECD . Increased Plastic Leakage and Greenhouse Gas Emissions. OECD; Paris, France: 2022. [(accessed on 25 November 2024)]. Available online: https://www.oecd.org/environment/plastics/increased-plastic-leakage-and-....
    1. Cabernard L., Pfister S., Oberschelp C., Hellweg S. Growing environmental footprint of plastics driven by coal combustion. Nat. Sustain. 2021;5:139–148. doi: 10.1038/s41893-021-00807-2. - DOI

LinkOut - more resources