. 2024 Dec 14;16(24):3491.
doi: 10.3390/polym16243491.

Accounting for the Structure-Property Relationship of Hollow-Fiber Membranes in Modeling Hemodialyzer Clearance

Affiliations

Accounting for the Structure-Property Relationship of Hollow-Fiber Membranes in Modeling Hemodialyzer Clearance

Anton Kozmai et al. Polymers (Basel). .

Abstract

The relevance of the hemodialysis procedure is increasing worldwide due to the growing number of patients suffering from chronic kidney disease. Taking into account the structure of dialysis polymer membranes is an important aspect in their development to achieve the required performance of hemodialyzers. We propose a new mathematical model of mass transfer that allows hollow-fiber membrane structural parameters to be taken into account in simulating the clearance (CL) of hemodialyzers in a way that does not require difficult to achieve close approximation to the exact geometry of the membrane porous structure. The model was verified by a comparison of calculations with experimental data on CL obtained using a lab-made dialyzer as well as commercially available ones. The simulations by the model show the non-trivial behavior of the dialyzer clearance as a function of membrane porosity (fp) and the arrangement of pores (α). The analysis of this behavior allows one to consider two strategies for increasing the CL of the dialyzer by optimizing the polymer membrane structure: (1) creating a membrane with a well-structured pore system (where α → 1) since doubling α at a high enough fp can lead to an almost tenfold increase in CL; (2) increasing the porosity of the membrane characterized by a random arrangement of pores (α → 0), where, at a relatively low α, a sharp increase in CL is observed with a small increase in fp over a certain threshold value.

Keywords: clearance; creatinine; hemodialysis; mathematical modeling; membrane; phosphate; porosity; structure–property relationship; urea.


Conflict of interest statement

Authors D.L. and A.R. are employed by the LLC New Service Company. Author I.V. is employed by LLC KKZ. The remaining authors declare that the research was conducted in the absence of any commercial or financial relationships that could be construed as a potential conflict of interest.

Figures

Figure 1
Figure 1
Scheme of the simulated system geometry. DBL1 and DBL2 are diffusion boundary layers adjacent to the membrane at the side of compartments A and B, respectively. The arrow indicates the direction of solutes transport.
Figure 2
Figure 2
Distribution of the phosphoric acid species (in mole fractions) as a function of pH.
Figure 3
Figure 3
Scheme of the method for preparing flat-sheet membranes. In figure: 1 is the polymer solution, 2 is the glass substrate and 3 is the membrane.
Figure 4
Figure 4
Scheme of the setup for manufacturing a hollow-fiber membrane. In figure: 1 is the polymer feed tank, 2 is the coagulant feed tank, 3 is the spinnerets, 4 is the coagulation bath, 5 is the washing bath, 6 is the winding roller, and 7 is the auxiliary rollers.
Figure 5
Figure 5
Scheme of the lab-made dialyzer.
Figure 6
Figure 6
Membrane diffusion permeability coefficient P as a function of (a) the volume fraction of pores in the membrane fp at a fixed value of structural parameter α (indicated near the corresponding curve) and (b) parameter α at a fixed value of fp (indicated near the corresponding curve). Calculations were made using Equation (24) for the NaCl solution.
Figure 7
Figure 7
Concentration dependence of the membrane (indicated near the corresponding curve) diffusion permeability coefficient. Markers indicate the experimental data; solid lines indicate the results of calculations with Equation (24).
Figure 8
Figure 8
SEM images of surfaces and cross sections (indicated near the figure) of the (a) PSF, (b) PSF-PEG and (c) PSF-PVP membranes.
Figure 8
Figure 8
SEM images of surfaces and cross sections (indicated near the figure) of the (a) PSF, (b) PSF-PEG and (c) PSF-PVP membranes.
Figure 9
Figure 9
SEM images of the HF-PSF-PVP membrane in cross section.
Figure 10
Figure 10
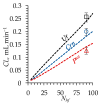
Clearance of urea (Ur), creatinine (Crn) and phosphates (Ptot) (indicated near the corresponding curve) as a function of the number of hollow fibers Nhf in the dialyzer. Markers indicate the experiment; dashed lines indicate the results of simulations.
Figure 11
Figure 11
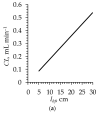
Simulated clearance of urea as a function of (a) fiber length (lhf); (b) fiber inner diameter (dhf); (c) the number of fibers in the dialyzer (Nhf). In figures (a,b) Nhf = 90, as indicated in Table 3.
Figure 11
Figure 11
Simulated clearance of urea as a function of (a) fiber length (lhf); (b) fiber inner diameter (dhf); (c) the number of fibers in the dialyzer (Nhf). In figures (a,b) Nhf = 90, as indicated in Table 3.
Figure 12
Figure 12
Simulated clearance of urea as a function of (a) membrane (fiber wall) thickness (d); (b) the volume fraction of pores in the membrane (fp) at various values of structural parameter α (indicated near the corresponding curve). The red square marker indicates the experimentally determined value of CL for the lab-made dialyzer containing the HF-PSF-PVP membranes.
Figure 13
Figure 13
Simulated (dashed lines) and experimentally obtained (markers) (a) Baxter; (b) Fresenius and (c) B. Braun clearance of Ur, Crn and Ptot (indicated near the corresponding curve) as a function of the effective membrane area at the volumetric flow rates in the diluate compartment, QA, indicated in the plots.
Figure 14
Figure 14
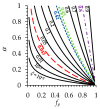
Simulated α vs. fp dependence at various values of ξ (indicated near the corresponding curve). Red-dashed line corresponds to a lab-made HF-PSF-PVP membrane, the blue-dashed line denotes the Baxter membrane, the green-dotted line denotes the Fresenius membrane and the purple-dash–dotted line denotes the B. Braun membrane.
Figure 15
Figure 15
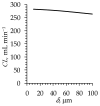
Simulated urea clearance for the Nephral ST 300 dialyzer as a function of the diffusion boundary layer thickness.

Similar articles

References

    1. Verified Market Reports Hemodialyzer and Dialysis Filter Market. 2024. [(accessed on 24 October 2024)]. Available online: https://www.verifiedmarketreports.com/product/hemodialyzer-and-dialysis-...
    1. Hill N.R., Fatoba S.T., Oke J.L., Hirst J.A., O’Callaghan C.A., Lasserson D.S., Hobbs F.D.R. Global Prevalence of Chronic Kidney Disease—A Systematic Review and Meta-Analysis. PLoS ONE. 2016;11:e0158765. doi: 10.1371/journal.pone.0158765. - DOI - PMC - PubMed
    1. Centers for Disease Control and Prevention Chronic Kidney Disease in the United States, 2023. [(accessed on 24 October 2024)];2024 Available online: https://www.cdc.gov/kidney-disease/php/data-research/index.html.
    1. United Nations World Population Prospects 2022: Summary of Results. 2022. [(accessed on 24 October 2024)]. Available online: https://desapublications.un.org/publications/world-population-prospects-....
    1. United Nations World Population Prospects 2024: Summary of Results. 2024. [(accessed on 24 October 2024)]. Available online: https://desapublications.un.org/publications/world-population-prospects-....

LinkOut - more resources