. 2024 Dec 18;24(24):8071.
doi: 10.3390/s24248071.

Light-Emitting Diode Array with Optical Linear Detector Enables High-Throughput Differential Single-Cell Dielectrophoretic Analysis

Affiliations

Light-Emitting Diode Array with Optical Linear Detector Enables High-Throughput Differential Single-Cell Dielectrophoretic Analysis

Emerich Kovacs et al. Sensors (Basel). .

Abstract

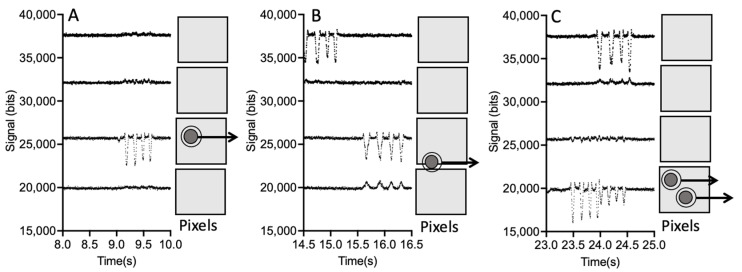
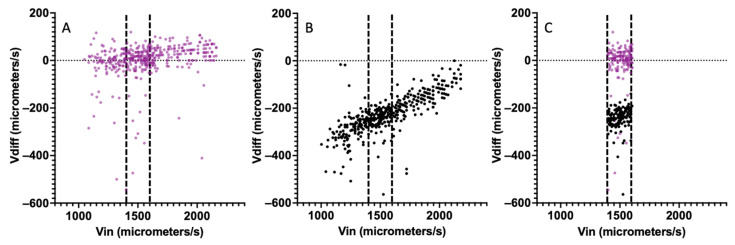
This paper presents a lens-free imaging approach utilizing an array of light sources, capable of measuring the dielectric properties of many particles simultaneously. This method employs coplanar electrodes to induce velocity changes in flowing particles through dielectrophoretic forces, allowing the inference of individual particle properties from differential velocity changes. Both positive and negative forces are detectable. The light source utilized in this system is composed of LEDs with a wavelength of 470 nm, while detection is performed using a 256-element optical array detector. Measurements with 10 μm polystyrene beads demonstrate this method can resolve changes equivalent to a Clausius-Mossotti factor of 0.18. Simulations in this work, using values from the literature, predict that Clausius-Mossotti factor differences of 0.18 are sufficient to differentiate viable from nonviable cells and cancerous from multidrug-resistant cancerous cells. We demonstrate that for Chinese hamster ovary (CHO) cells, the method can collect a dielectric response spectrum for a large number of cells in several minutes. We demonstrate that for CHO cells, Clausius-Mossotti factor differences of 0.18 can be discriminated. Due to its simple detection apparatus and the utilization of high-throughput, wide, clog-resistant channels, this method holds promise for a wide range of applications.

Keywords: dielectric spectrum; dielectrophoresis; differential detection; in-flow analysis; lens-free; single-cell sensor.


Conflict of interest statement

The authors declare no conflicts of interest.

Figures

Figure 1
Figure 1
Violin plots from a Monte Carlo simulation of the real part of the Clausius–Mossotti factor (CMF) versus frequency for both normal and altered cells. (A) Viable (black) and nonviable CHO cells, (B) K562 and K562R (black) cells, and (C) breast cancer cells (black) and monocytes (WBC). Horizontal lines are for the 10th and 90th percentiles for CHO and K562 cells at 6 MHz.
Figure 2
Figure 2
Schematic of the lensless DEP cytometer. Particles flow into the channel via the inlet port. The particles then flow down the channel to the channel outlet. At about halfway between the inlet and outlet, the particles pass over the electrodes that induce DEP motion. The LEDs above the channel illuminate the channel, including the detector array located below the electrodes. As a particle passes between an LED and the detector array, the light is partially blocked, resulting in a small decrease in the optical signal detected on the array.
Figure 3
Figure 3
(A) Four LEDs illuminate the channel. When a particle passes between one LED and the detector, located below the channel, a minimum in the signal is produced. (B) Signal for a particle with a 4-LED light source experiencing no DEP force. (C) Typical signal for a particle passing with a repulsive n-DEP motion of the cell. The cell is repulsed to higher velocities after passing over the electrodes.
Figure 4
Figure 4
Signal traces for 4 adjacent pixels. (A) The cell is centered on one pixel and the signal comes from one pixel. (B) The cell overlaps two adjacent pixels and the signal occurs on both pixels. (C) The two cells are coincident in space, resulting in the signals overlapping in time.
Figure 5
Figure 5
Analysis of a typical CHO cell signal. The cell velocity before and after is calculated using (t2 − t1) and (t4 − t3), respectively. In this case, (t2 − t1) is smaller than (t4 − t3), indicating p-DEP.
Figure 6
Figure 6
Scatter plots of incoming velocity against differential velocity for polystyrene microbeads. (A) With no DEP actuation, (B) with DEP actuation using a voltage of 2.5 Vpp at 1 MHz applied to the electrodes, and (C) filtered to include only incoming velocities between 1400 and 1600 μm/s for cases A and B.
Figure 7
Figure 7
(A) Measured differential velocity for 10 μm diameter polystyrene beads in deionized water for different DEP voltages at 1 MHz. A parabolic best-fit line is also plotted. (B) Violin plots for 10 μm polystyrene beads in deionized water for voltages between the electrodes of 0.0 Vpp (no DEP), 2.0 Vpp, and 2.5 Vpp at a frequency of 1 MHz. The 10 to 90% bounds are plotted as horizontal lines.
Figure 8
Figure 8
(A) Scatter plot of differential velocity versus incoming velocity for CHO cells at an excitation frequency of 6 MHz and 300 kHz in a medium with conductivity 0.17 S/m. The 6 MHz is black and the 300 kHz is purple. (B) Distributions over differential velocity for the cells, using cells between the two dashed lines in Figure 8A. The 10th and 90th percentiles are shown as horizontal lines.
Figure 9
Figure 9
Mean value of differential velocity versus frequency for high-viability CHO cells and polystyrene beads.
Figure 10
Figure 10
Differential velocity distributions for CHO cells with no excitation and excitation at frequencies of 600 kHz (CMF = 0.11) and 1 MHz (CMF = 0.16). The horizontal line is the 10th to 90th percentile boundary for each distribution.

Similar articles

References

    1. Elitas M., Yildizhan Y., Islam M., Martinez-Duarte R., Ozkazanc D. Dielectrophoretic characterization and separation of monocytes and macrophages using 3D carbon-electrodes. Electrophoresis. 2019;40:315–321. doi: 10.1002/elps.201800324. - DOI - PubMed
    1. Liu J., Qiang Y., Du E. Dielectric spectroscopy of red blood cells in sickle cell disease. Electrophoresis. 2021;42:667–675. doi: 10.1002/elps.202000143. - DOI - PubMed
    1. Di Trapani M., Manaresi N., Medoro G. DEPArrayTM system: An automatic image-based sorter for isolation of pure circulating tumor cells. Cytom. Part A. 2018;93:1260–1266. doi: 10.1002/cyto.a.23687. - DOI - PMC - PubMed
    1. O’Shannessy D.J., Davis D.W., Anderes K., Somers E.B. Isolation of Circulating Tumor Cells from Multiple Epithelial Cancers with ApoStream® for Detecting (or Monitoring) the Expression of Folate Receptor Alpha. Biomark. Insights. 2016;11:7–18. doi: 10.4137/BMI.S35075. - DOI - PMC - PubMed
    1. Coley H.M., Labeed F.H., Thomas H., Hughes M.P. Biophysical characterization of MDR breast cancer cell lines reveals the cytoplasm is critical in determining drug sensitivity. Biochim. Biophys. Acta Gen. Subj. 2007;1770:601–608. doi: 10.1016/j.bbagen.2006.12.002. - DOI - PubMed

LinkOut - more resources