. 2024 Dec 22;24(24):8202.
doi: 10.3390/s24248202.

Silicon Drift Detectors for the Measurement and Reconstruction of Beta Spectra

Affiliations

Silicon Drift Detectors for the Measurement and Reconstruction of Beta Spectra

Andrea Nava et al. Sensors (Basel). .

Abstract

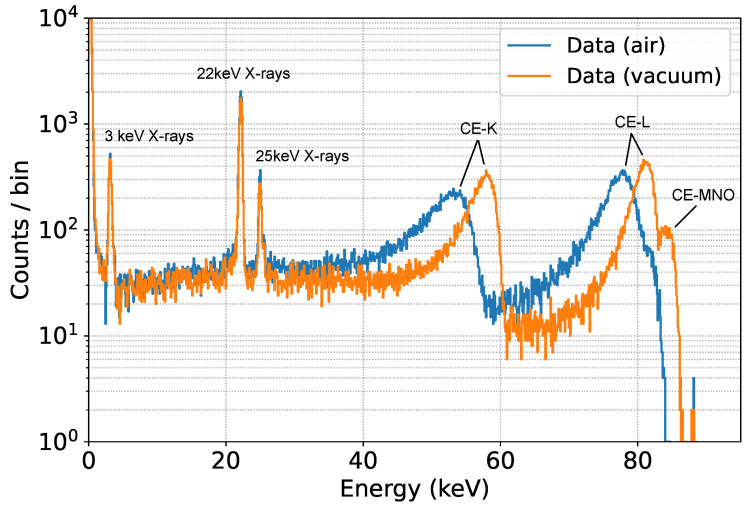
The ASPECT-BET project, or An sdd-SPECTrometer for BETa decay studies, aims to develop a novel technique for the precise measurement of forbidden beta spectra in the 10 keV-1 MeV range. This technique employs a Silicon Drift Detector (SDD) as the main spectrometer with the option of a veto system to reject events exhibiting only partial energy deposition in the SDD. A precise understanding of the spectrometer's response to electrons is crucial for accurately reconstructing the theoretical shape of the beta spectrum. To compute this response, GEANT4 simulations optimized for low-energy electron interactions are used and validated with a custom-made electron gun. In this article we present the performance of these simulations in reconstructing the electron spectra measured with SDDs of a 109Cd monochromatic source, both in vacuum and in air. The allowed beta spectrum of a 14C source was also measured and analyzed, proving that this system is suitable for the application in ASPECT-BET.

Keywords: GEANT4 simulations; silicon drift detectors; β spectra.


Conflict of interest statement

The authors declare no conflicts of interest. The funders had no role in the design of the study; in the collection, analyses, or interpretation of data; in the writing of the manuscript; or in the decision to publish the results.

Figures

Figure 1
Figure 1
47-pixel SDD matrix used for all the measurements here reported (left). Scheme of the 47 pixels: only the 7 red ones were acquired (right).
Figure 2
Figure 2
Vacuum chamber in the Milano-Bicocca laboratory. The main detectors operated in this setup, a 47-pixel SDD matrix and a Pixet, are indicated. The e-gun, attached to a xy-movable stage, is also highlighted.
Figure 3
Figure 3
(Left): picture of the e-gun. (Center): anode with 7 LEDs used to illuminate the cathode and the aluminum cylinder with UV light. (Right): gold-coated cathode used to collimate the electron beam. The aluminum cylinder, where electrons are produced, is visible in its center.
Figure 4
Figure 4
(Left): CAD drawing of the e-gun. The most important components are highlighted. (Right): COMSOL simulation of the electron beam produced with the e-gun.
Figure 5
Figure 5
(Top): measurement of the e-gun beam spot performed with the Pixet. A beam size of ∼0.5 mm and a rate 104 electrons/s were found. (Bottom): measurement of a 10 keV electron spectrum acquired with an SDD. Only the central part of the pixel was hit with the e-gun beam. The best fit of the spectrum done with the detector model is also shown.
Figure 6
Figure 6
CAD schematics of the setup used in the measurements. Section of source and detector (top), and side view (bottom).
Figure 7
Figure 7
M1 Data acquired with the SDD main pixel in a 3-h measurement. The energy of the X-ray peaks and the tag of the different IC electrons are shown.
Figure 8
Figure 8
Data-MC comparison for different values of the effective Mylar thickness (top). Reduced χ2 as a function of the effective Mylar thickness (bottom). The best-fit value of 7.2 μm is extracted through a parabolic fit.
Figure 9
Figure 9
Best fit of MC prediction to the data set acquired with the 109Cd source in vacuum. The fit is done only in the non-shaded area.
Figure 10
Figure 10
Comparison of MC prediction to the dataset acquired with the 109Cd source in air. The comparison is done only in the non-shaded area.
Figure 11
Figure 11
Data acquired with the main SDD in a 6 h measurement using a 14C source (top). χ2 as a function of the effective Mylar thickness for the two models: the Fermi theory prediction and the one including the experimental shape factor (bottom). The best fit for the effective Mylar thickness is 4.5 μm.
Figure 12
Figure 12
Fit to the data set acquired with the 14C source in vacuum using the MC prediction. The fit is performed only in the non-shaded area. The theoretical input is also shown.
Figure 13
Figure 13
Fits obtained by varying λ (top), the baseline resolution σ (center) and the charge cloud width in Si (bottom).
Figure 13
Figure 13
Fits obtained by varying λ (top), the baseline resolution σ (center) and the charge cloud width in Si (bottom).
Figure 14
Figure 14
Fits obtained by varying the production cut for secondaries in GEANT4 (top) or the physics list used (bottom) in the simulations.

References

    1. Barea J., Kotila J., Iachello F. Nuclear matrix elements for double-β decay. Phys. Rev. C. 2013;87:014315. doi: 10.1103/PhysRevC.87.014315. - DOI
    1. Hayes A.C., Friar J.L., Garvey G.T., Jungman G., Jonkmans G. Systematic Uncertainties in the Analysis of the Reactor Neutrino Anomaly. Phys. Rev. Lett. 2014;112:202501. doi: 10.1103/PhysRevLett.112.202501. - DOI
    1. Kostensalo J., Haaranen M., Suhonen J. Electron spectra in forbidden β decays and the quenching of the weak axial-vector coupling constant gA. Phys. Rev. C. 2017;95:044313. doi: 10.1103/PhysRevC.95.044313. - DOI
    1. Quarati F.G.A., Bollen G., Dorenbos P., Eibach M., Gulyuz K., Hamaker A., Izzo C., Keblbeck D.K., Mougeot X., Puentes D., et al. Measurements and computational analysis of the natural decay of 176Lu. Phys. Rev. C. 2023;107:024313. doi: 10.1103/PhysRevC.107.024313. - DOI
    1. Bodenstein-Dresler L., Chu Y., Gehre D., Gößling C., Heimbold A., Herrmann C., Hodak R., Kostensalo J., Kröninger K., Küttler J., et al. Quenching of gA deduced from the β-spectrum shape of 113Cd measured with the COBRA experiment. Phys. Lett. B. 2020;800:135092. doi: 10.1016/j.physletb.2019.135092. - DOI

LinkOut - more resources