

Longitudinal Comparison of Three T-Cell Assays and Three Antibody Assays Against SARS-CoV-2 Following Homologous mRNA-1273/mRNA-1273/mRNA-1273 and Heterologous ChAdOx1/ChAdOx1/BNT162b2 Vaccination: A Prospective Cohort in Naïve Healthcare Workers
- PMID: 39772013
- PMCID: PMC11679843
- DOI: 10.3390/vaccines12121350
Longitudinal Comparison of Three T-Cell Assays and Three Antibody Assays Against SARS-CoV-2 Following Homologous mRNA-1273/mRNA-1273/mRNA-1273 and Heterologous ChAdOx1/ChAdOx1/BNT162b2 Vaccination: A Prospective Cohort in Naïve Healthcare Workers
Abstract
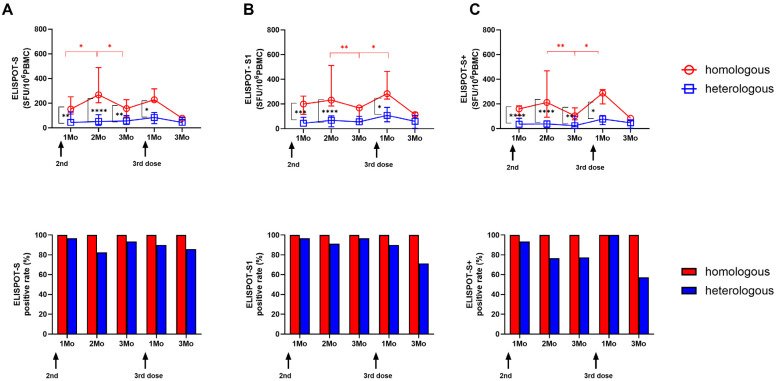
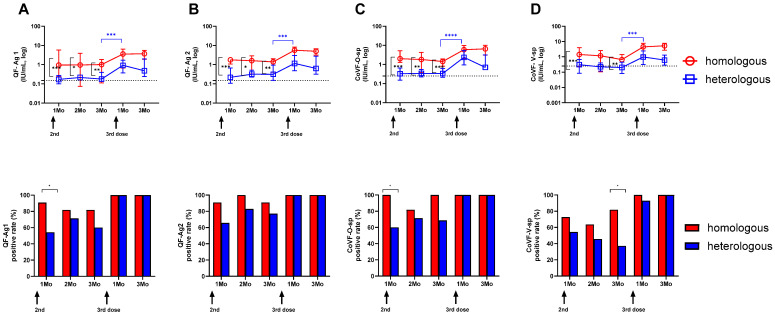
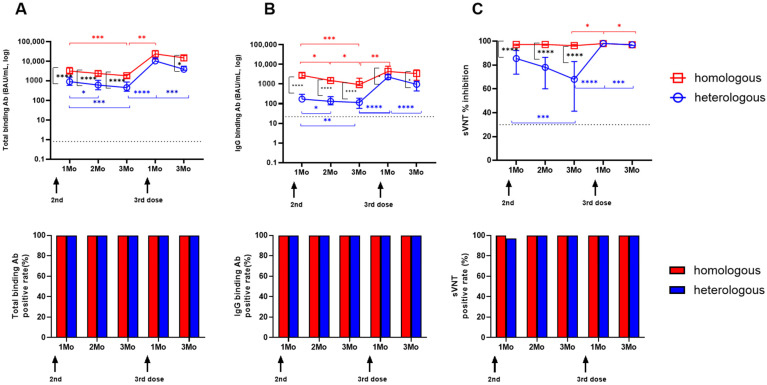
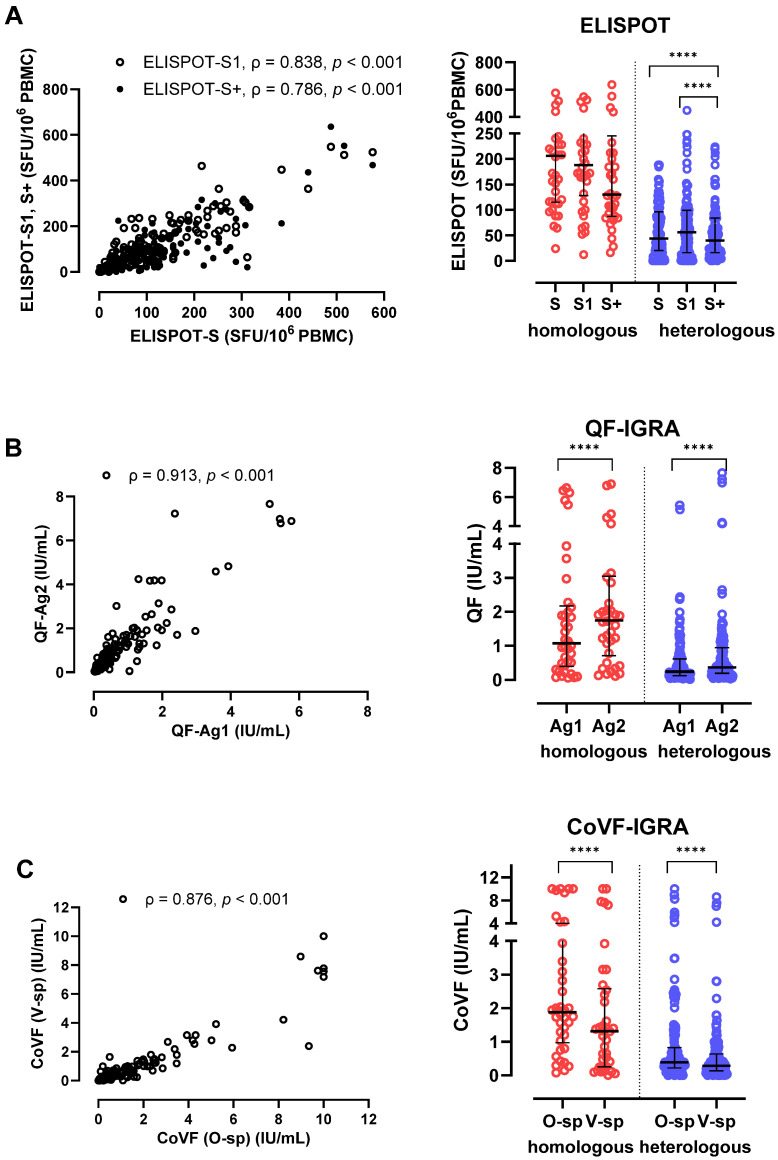
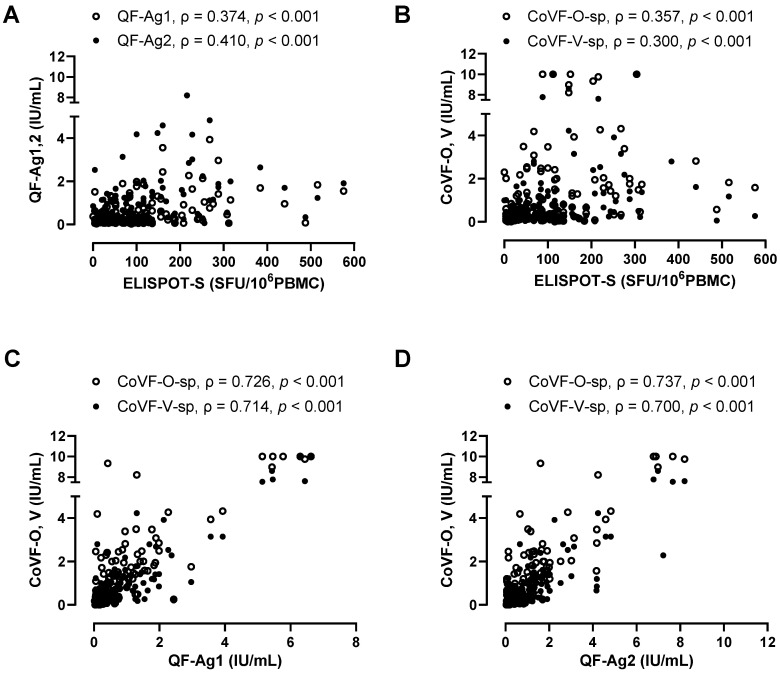
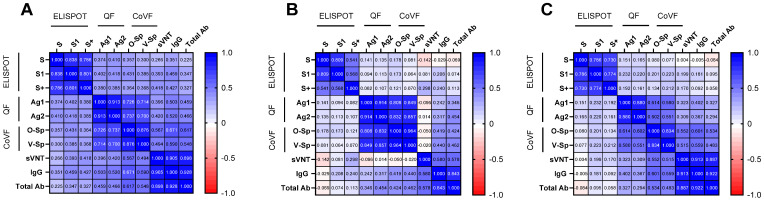
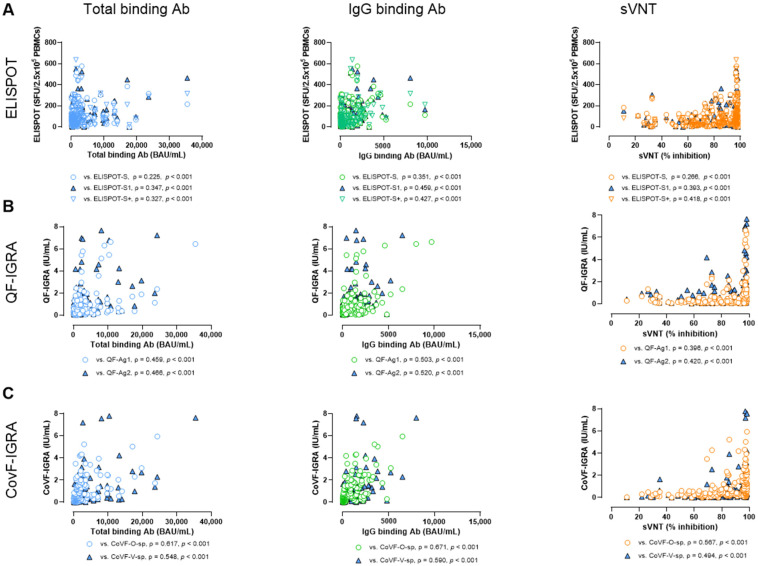
Background: Cellular and humoral immunity are key to the immune response against SARS-CoV-2, but the comparability and correlation across different assays remain underexplored. This study compares three T-cell and three antibody assays in two vaccine groups. Methods: This prospective longitudinal cohort study involved 46 naïve healthcare workers: a total of 11 in the homologous mRNA-1273 group (three doses) and 35 in the heterologous ChAd group (two ChAd doses followed by a BNT booster). Blood samples were collected at five time points. Cellular immunity was assessed using ELISPOT and two commercial interferon-gamma release assays: (IGRA)-QuantiFERON SARS-CoV-2 (QF) and Covi-FERON ELISA (CoVF). Humoral immunity was evaluated using total and IgG antibody assays and a surrogate virus neutralization test. Results: The mRNA-1273 group exhibited stronger and more consistent responses than the ChAd group. The correlations between ELISPOT and IGRA varied from weak to moderate (ρ = 0.300-0.410), while QF-IGRA and CoVF-IGRA showed stronger correlations (ρ = 0.700-0.737). The ELISPOT assay showed substantial agreement with QF [Ag2]-IGRA (k = 0.697-0.774) and CoVF [O-sp]-IGRA (k = 0.641-0.718), and an 80.4% agreement rate (k = 0.608) was found between the QF [Ag2]- and CoVF [O-sp]-IGRA tests. Three antibody assays demonstrated very strong correlations with each other and substantial to near-perfect agreement with ELISPOT (k = 0.866-0.949), QF [Ag2]-IGRA (k = 0.807-0.831), and CoVF [O-sp]-IGRA (k = 0.753-0.777). Conclusions: SARS-CoV-2-specific cellular and antibody responses vary by platform and vaccine type, highlighting the importance of measuring both T-cell and B-cell responses using multiple assays to comprehensively assess immune status.
Keywords: ELISPOT; SARS-CoV-2; cellular response; humoral response; interferon-gamma release assay; vaccine.
Conflict of interest statement
The authors declare no conflicts of interest. SD biosensor (Korea) had no role in the design of this study, data collection, data analyses, data interpretation, writing of the manuscript, or decision to publish the results.
Figures
Similar articles
-
Comparison of humoral and cellular immune responses between ChAd-BNT heterologous vaccination and BNT-BNT homologous vaccination following the third BNT dose: A prospective cohort study.Front Immunol. 2023 Mar 2;14:1120556. doi: 10.3389/fimmu.2023.1120556. eCollection 2023. Front Immunol. 2023. PMID: 36936965 Free PMC article.
-
Comparison of Four T-cell Assays and Two Binding Antibody Assays in SARS-CoV-2 Vaccinees With or Without Omicron Breakthrough Infection.Ann Lab Med. 2023 Nov 1;43(6):596-604. doi: 10.3343/alm.2023.43.6.596. Epub 2023 Jun 30. Ann Lab Med. 2023. PMID: 37387492 Free PMC article.
-
Duration of SARS-CoV-2 Immune Responses Up to Six Months Following Homologous or Heterologous Primary Immunization with ChAdOx1 nCoV-19 and BNT162b2 mRNA Vaccines.Vaccines (Basel). 2022 Feb 24;10(3):359. doi: 10.3390/vaccines10030359. Vaccines (Basel). 2022. PMID: 35334989 Free PMC article.
-
To mix or not to mix? A rapid systematic review of heterologous prime-boost covid-19 vaccination.Expert Rev Vaccines. 2021 Oct;20(10):1211-1220. doi: 10.1080/14760584.2021.1971522. Epub 2021 Sep 1. Expert Rev Vaccines. 2021. PMID: 34415818 Free PMC article.
-
The Effects of Heterologous Immunization with Prime-Boost COVID-19 Vaccination against SARS-CoV-2.Vaccines (Basel). 2021 Oct 11;9(10):1163. doi: 10.3390/vaccines9101163. Vaccines (Basel). 2021. PMID: 34696271 Free PMC article. Review.
References
-
- Ssentongo P., Ssentongo A.E., Voleti N., Groff D., Sun A., Ba D.M., Nunez J., Parent L.J., Chinchilli V.M., Paules C.I. SARS-CoV-2 vaccine effectiveness against infection, symptomatic and severe COVID-19: A systematic review and meta-analysis. BMC Infect. Dis. 2022;22:439. doi: 10.1186/s12879-022-07418-y. - DOI - PMC - PubMed
-
- Chen Y., Chen L., Yin S., Tao Y., Zhu L., Tong X., Mao M., Li M., Wan Y., Ni J., et al. The Third dose of CoronVac vaccination induces broad and potent adaptive immune responses that recognize SARS-CoV-2 Delta and Omicron variants. Emerg. Microbes Infect. 2022;11:1524–1536. doi: 10.1080/22221751.2022.2081614. - DOI - PMC - PubMed
Grants and funding
LinkOut - more resources
Full Text Sources
Miscellaneous
