. 2024 Dec 1;12(12):1361.
doi: 10.3390/vaccines12121361.

The Protective Effect of IL-17A in Pneumonic Plague Can Be Compensated by Effective Vaccines and Immunization Strategies in Mice

Affiliations

The Protective Effect of IL-17A in Pneumonic Plague Can Be Compensated by Effective Vaccines and Immunization Strategies in Mice

Emily K Hendrix et al. Vaccines (Basel). .

Abstract

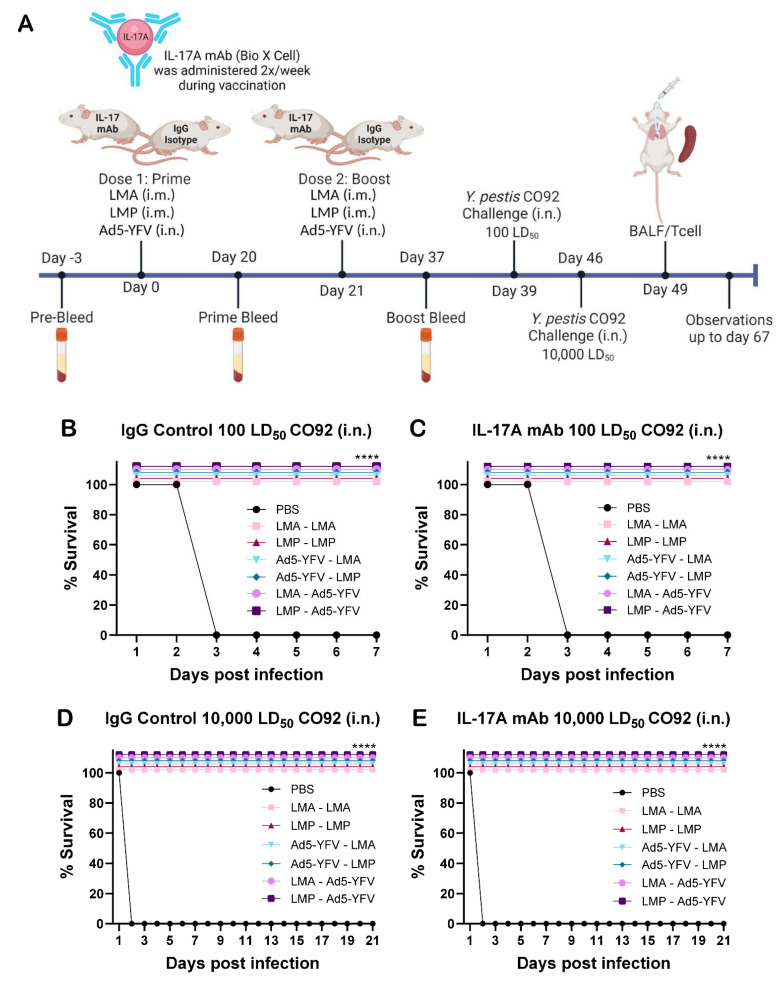
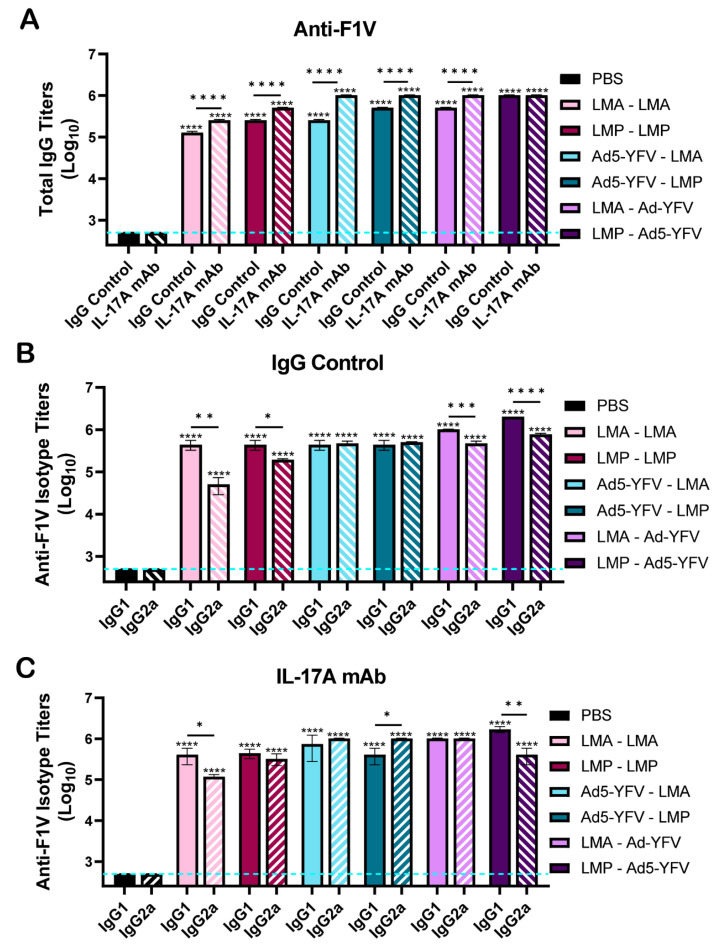
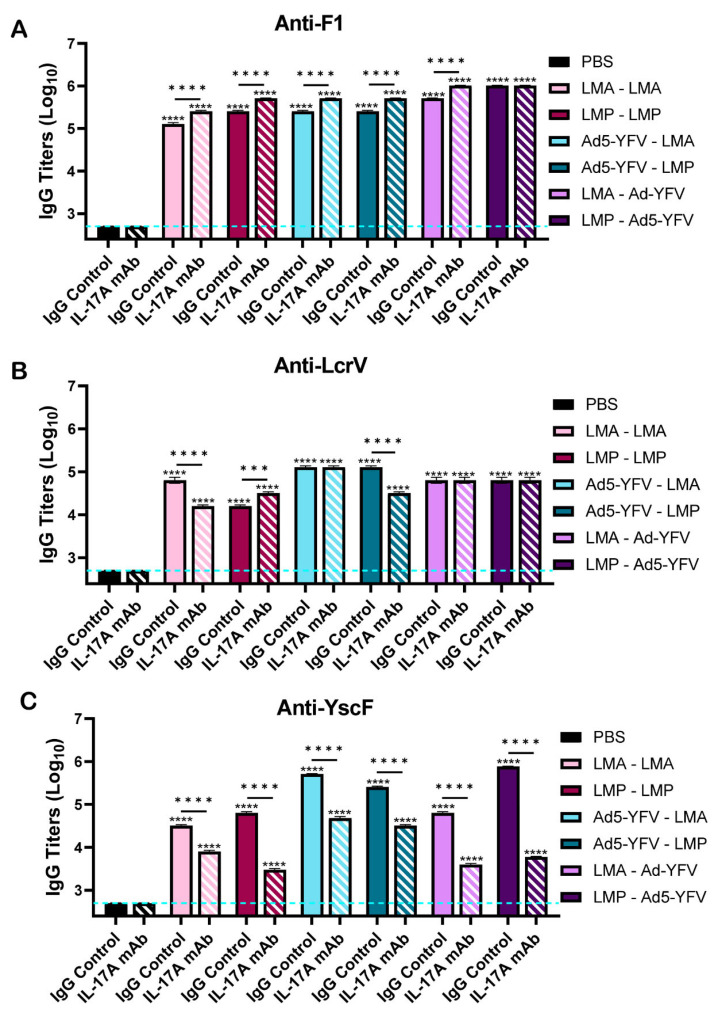
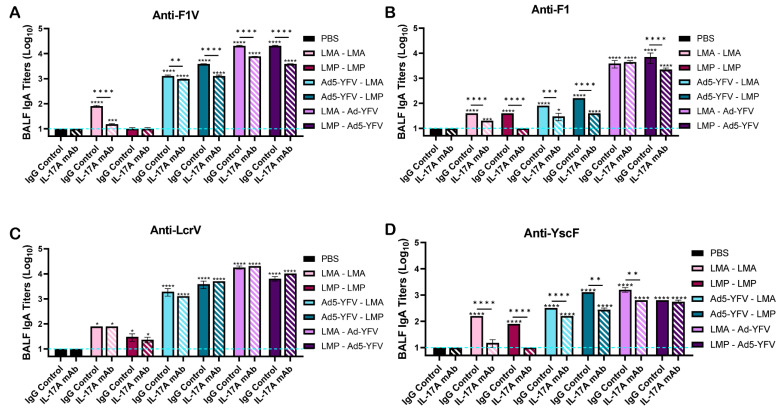
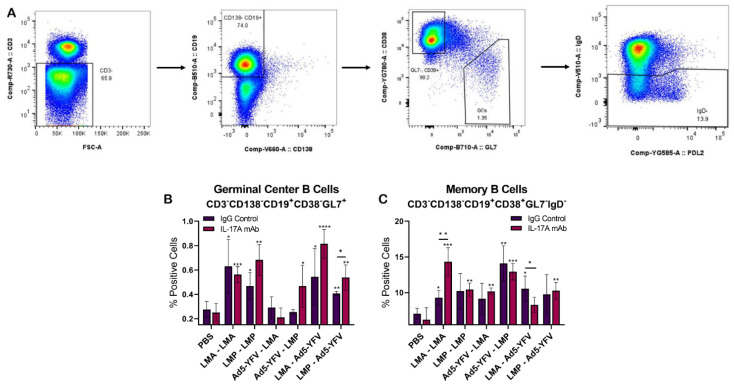
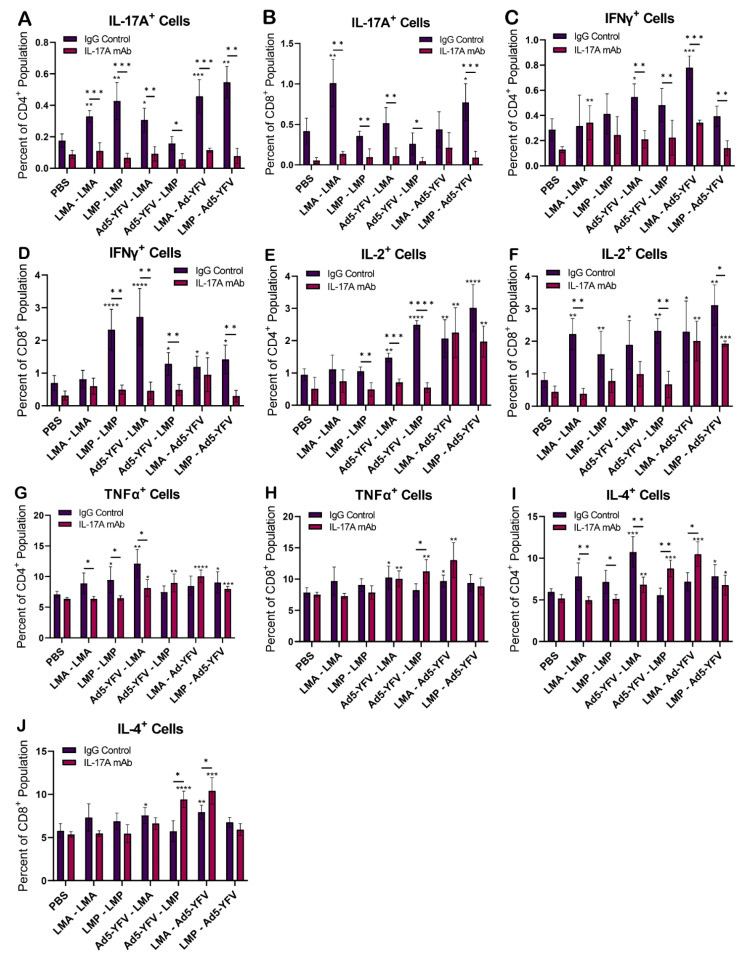
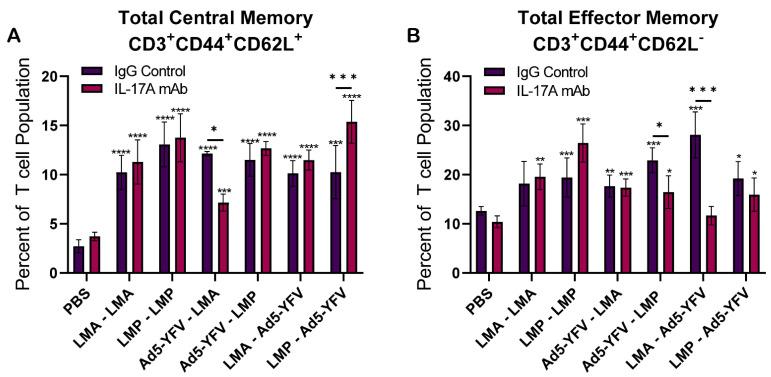
Plague, caused by Yersinia pestis, poses a public health threat not only due to sporadic outbreaks across the globe but also due to its potential as a biothreat agent. Ironically, among the seven deadliest pandemics in global history, three were caused by Y. pestis. Pneumonic plague, the more contagious and severe form of the disease, is difficult to contain, requiring either prophylactic antibiotic treatment or vaccination. However, no vaccine (live attenuated or subunit) is currently approved by the Food and Drug Administration, requiring rigorous preclinical studies in different animal models, thus forming the basis of this study. Objectives: The aim of this study was to evaluate the efficacy and immune responses of two live attenuated vaccines (LAVs), LMA and LMP, either alone or in combination with a trivalent adenoviral vector-based vaccine (Ad5-YFV), in IL-17A-depleted and IgG control mice by using an anti-IL-17A monoclonal antibody (mAb) or its matched isotype IgG, respectively. Methods: IL-17A mAb or IgG isotype control was administered to mice twice per week to their respective groups during the course of immunization. Serum, spleens, and broncho-alveolar lavage fluid (BALF) were collected for assessing immunological responses, and another cohort of mice was intranasally challenged with a lethal dose of parental Y. pestis CO92. Results: Robust humoral and cellular immune responses followed by complete protection were observed in all vaccinated animals against highly lethal intranasal challenge doses of parental Y. pestis CO92. Serum IgG titers to YscF and overall mucosal IgA titers to all three antigens of the Ad5-YFV vaccine were significantly lower, with slightly reduced serum LcrV-neutralizing antibodies when IL-17A was depleted compared to IgG control animals during the course of immunization. A remarkable reduction in Th1 (IFNγ or IL-2) and Th17 cell populations was observed in IL-17A-depleted mice compared to IgG controls in response to vaccination. On the other hand, B cell activities in germinal centers, overall activated antigen-specific T cells, and memory B and T cells remained at comparable levels in both vaccinated IL-17A-depleted and IgG control mice. Conclusions: These data demonstrated the effectiveness of our vaccines even under the reduced levels of both Th1 and Th17 responses and thus should be suitable for those individuals associated with certain immune deficiencies.

Keywords: IL-17A-depleted mice; Y. pestis; flow cytometry; homologous and heterologous vaccinations; immunogenicity; live attenuated and adenovirus-based plague vaccines; pneumonic plague.


Conflict of interest statement

The authors declare no conflicts of interest. The funders had no role in the design of the study; in the collection, analyses, or interpretation of data; in the writing of the manuscript; or in the decision to publish the results.

Figures

Figure 1
Figure 1
Vaccination protected both IL-17A-depleted and IgG control mice against lethal pulmonary Y. pestis challenge. (A) Experimental time course. Swiss Webster mice (n = 10 per group) administered anti-IL-17A or its IgG isotype control mAbs twice per week were immunized with either LMA or LMP alone by i.m. injection or in combination with i.n. instillation of Ad5-YFV in a 2-dose regimen, 21 days apart. Mice receiving PBS were used as challenge controls. (B,C) Approximately 3 weeks after the completion of the vaccination schedule, mice were i.n. challenged with 100 LD50 of Y. pestis CO92. (D,E) Seven days post-initial challenge, survivors among vaccinated mice, along with age-matched naïve control mice, were re-challenged i.n. with 10,000 LD50 of Y. pestis CO92 and observed for morbidity and mortality for 21 days. Kaplan–Meier analysis with log-rank (Mantel–Cox) test was used to analyze survival. Asterisks represent the statistical significance of vaccinated groups compared to naïve control mice. **** p < 0.0001.
Figure 2
Figure 2
Serum IgG titers and their sub-isotypes to the F1V fusion protein in vaccinated IL-17A-depleted and IgG control mice. Boost sera were collected on day 37 as described in Figure 1A and ELISAs were performed to evaluate (A) total IgG and (B,C) IgG isotype titers to F1V. Significance was determined by either one-way ANOVA with Tukey’s post hoc test (A) or two-way ANOVA with Tukey’s post hoc test (B,C). The geometric means ± standard deviations are plotted. The blue dashed line represents the baseline values of naïve control samples at the dilution of 1:500. Asterisks with comparison bars represent statistical significance between respective vaccinated groups, while asterisks directly above the bars represent statistical significance of vaccinated groups compared to naïve control mice. *, p < 0.05; **, p < 0.01; ***, p < 0.001; ****, p < 0.0001. These data were combined from three independent ELISA assays.
Figure 3
Figure 3
Serum IgG antibody responses to specific individual plague antigens in vaccinated IL-17A-depleted and IgG control mice. Boost sera were collected on day 37 as described in Figure 1A and ELISAs were performed to evaluate IgG titers to individual plague antigens (A) F1, (B) LcrV, and (C) YscF. The geometric means ± standard deviations are plotted. Statistical significance was determined by one-way ANOVA with Tukey’s post hoc test. The blue dashed line represents the baseline values of naïve control samples at the dilution of 1:500. Asterisks with comparison bars represent statistical significance between respective vaccinated groups, while asterisks directly above the bars represent statistical significance of vaccinated groups compared to naïve control mice. *** p < 0.001, **** p < 0.0001. These data are combined from three independent ELISA assays.
Figure 4
Figure 4
Neutralizing antibodies in vaccinated IL-17A-depleted mice. Animals were immunized and serum was collected as described in Figure 1A. Competitive ELISAs were performed using biotinylated neutralizing and protective LcrV Mab7.3 against serum from animals vaccinated with (A) Ad5-YFV–LMA, (B) Ad5-YFV–LMP, (C) LMA–Ad5-YFV, or (D) LMP–Ad5-YFV in binding of rV. The percentage inhibition of biotinylated LcrV Mab7.3 binding to rV by immunized sera was plotted. The blue dashed line represents 50% of the biotinylated LcrV Mab7.3 outcompeted for binding. The area to the left of the vertical solid line depicts the competitive binding capacity of sera at 2-fold increasing dilutions. The area to the right of the vertical solid line depicts the comparison of competitive binding ability of serum at a 1:80 dilution with biotinylated LcrV Mab7.3 between IL-17A-depleted (striped blue bar) and IgG control (solid blue bar) groups. Averages from representative experiments are plotted.
Figure 5
Figure 5
BALF IgA titers in vaccinated IL-17A-depleted and IgG control mice. Animals were immunized and BALF was collected as described in Figure 1A. IgA ELISAs were performed to evaluate titers to (A) F1V fusion plague antigen and individual plague antigens (B) F1, (C) LcrV, and (D) YscF. The geometric means ± standard deviations are plotted. Statistical significance was determined by one-way ANOVA with Tukey’s post hoc test. The blue dashed line represents the baseline values of naïve control samples at the dilution of 1:500. Asterisks with comparison bars represent statistical significance between respective vaccinated groups, while asterisks directly above the bars represent statistical significance of vaccinated groups compared to naïve control mice. * p < 0.05, ** p < 0.01, *** p < 0.001, **** p < 0.0001. These data are combined from three independent ELISA assays.
Figure 6
Figure 6
Germinal center B cell activities and memory B cell populations in vaccinated IL-17A depleted and IgG control mice. Spleens were collected 4 weeks post-boost immunization from vaccinated and naïve control mice (n = 5 per group). (A) Splenocytes were surface-stained with various B cell markers and subjected to flow cytometry. The percentage of B cells in (B) germinal centers was gated as CD3-CD138-CD19+CD38-GL7+, while (C) memory B cells were identified as CD3-CD138-CD19+CD38+GL7-IgD-. The arithmetic means ± standard deviations are plotted. Statistical significance was determined using one-way ANOVA with Tukey’s post hoc test. Asterisks with comparison bars represent statistical significance between respective vaccinated groups, while asterisks directly above the bars represent the statistical significance of vaccinated groups compared to naïve control mice. *, p < 0.05; **, p < 0.01; ***, p < 0.001; ****, p < 0.0001.
Figure 7
Figure 7
Cytokine-positive T cells in vaccinated IL-17A-depleted and IgG control mice. Spleens were collected 4 weeks post-boost immunization from vaccinated and naïve control mice (n = 5 per group). The isolated splenocytes were stimulated with rF1V (100 µg/mL) for 48 h at 37°C, followed by an additional 4 h with Brefeldin A. Splenocytes were surface- and intracellularly stained with various cytokine and T cell markers and subjected to flow cytometry. (A,C,E,G,I). The percentages of cytokine-positive CD4+ and (B,D,F,H,J) CD8+ populations were acquired. The arithmetic means ± standard deviations are plotted. Statistical significance was determined using one-way ANOVA with Tukey’s post hoc test. Asterisks with comparison bars represent statistical significance between respective vaccinated groups, while asterisks directly above the bars represent the statistical significance of vaccinated groups compared to naïve control mice. * p < 0.05, ** p < 0.01, *** p < 0.001, **** p < 0.0001.
Figure 8
Figure 8
Evaluation of T cell response through the activation-induced marker (AIM) assay. Spleens were collected 4 weeks post-boost immunization from vaccinated and naïve control mice (n = 5 per group). The isolated splenocytes were stimulated with rF1V (100 µg/mL) for 48 h at 37 °C, followed by an additional 4 h with Brefeldin A. T cells were then harvested and stained with specific T cell AIM markers for flow cytometry analysis. The percentages of positive AIM populations in (A) CD4+CD44+CD134+CD25+ and (B) CD8+CD44+CD69+CD25+ were acquired. The arithmetic means ± standard deviations are plotted. Statistical significance was determined using one-way ANOVA with Tukey’s post hoc test. Asterisks with comparison bars represent statistical significance between respective vaccinated groups, while asterisks directly above the bars represent the statistical significance of vaccinated groups compared to naïve control mice. * p < 0.05, ** p < 0.01, *** p < 0.001, ****, p < 0.0001.
Figure 9
Figure 9
Memory T cell populations in vaccinated IL-17A-depleted and IgG control mice. Spleens were collected 4 weeks post-boost immunization from vaccinated and naïve control mice (n = 5 per group). The isolated splenocytes were stimulated with rF1V (100 µg/mL) for 48 h at 37 °C, followed by an additional 4 h with Brefeldin A. Cells were then harvested and stained with various T cell markers and subjected to flow cytometry. (A) Central memory T cells (TCM) were identified as CD44+CD127+CD62L+, while (B) effector memory T cells (TEM) were identified as CD44+CD127+CD62L-. The arithmetic means ± standard deviations are plotted. Statistical significance was determined using one-way ANOVA with Tukey’s post hoc test. Asterisks with comparison bars represent statistical significance between respective vaccinated groups, while asterisks directly above the bars represent the statistical significance of vaccinated groups compared to naïve control mice. * p < 0.05; ** p < 0.01; *** p < 0.001; **** p < 0.0001.

Similar articles

References

    1. Perry R.D., Fetherston J.D. Yersinia pestis—Etiologic agent of plague. Clin. Microbiol. Rev. 1997;10:35–66. doi: 10.1128/CMR.10.1.35. - DOI - PMC - PubMed
    1. Williamson E.D., Kilgore P.B., Hendrix E.K., Neil B.H., Sha J., Chopra A.K. Progress on the research and development of plague vaccines with a call to action. NPJ Vaccines. 2024;9:162. doi: 10.1038/s41541-024-00958-1. - DOI - PMC - PubMed
    1. Lei C., Kumar S. Yersinia pestis antibiotic resistance: A systematic review. Osong Public Health Res. Perspect. 2022;13:24. doi: 10.24171/j.phrp.2021.0288. - DOI - PMC - PubMed
    1. Rosenzweig J.A., Hendrix E.K., Chopra A.K. Plague vaccines: New developments in an ongoing search. Appl. Microbiol. Biotechnol. 2021;105:4931–4941. doi: 10.1007/s00253-021-11389-6. - DOI - PMC - PubMed
    1. Feodorova V.A., Lyapina A.M., Khizhnyakova M.A., Zaitsev S.S., Sayapina L.V., Arseneva T.E., Trukhachev A.L., Lebedeva S.A., Telepnev M.V., Ulianova O.V., et al. Humoral and cellular immune responses to Yersinia pestis Pla antigen in humans immunized with live plague vaccine. PLoS Neglected Trop. Dis. 2018;12:e0006511. doi: 10.1371/journal.pntd.0006511. - DOI - PMC - PubMed

LinkOut - more resources