Review
. 2024 Dec 11;12(12):1394.
doi: 10.3390/vaccines12121394.

Seroprevalence of Antibodies to Filoviruses with Outbreak Potential in Sub-Saharan Africa: A Systematic Review to Inform Vaccine Development and Deployment

Affiliations
Review

Seroprevalence of Antibodies to Filoviruses with Outbreak Potential in Sub-Saharan Africa: A Systematic Review to Inform Vaccine Development and Deployment

Christopher S Semancik et al. Vaccines (Basel). .

Abstract

Background/Objectives: Orthoebolaviruses and orthomarburgviruses are filoviruses that can cause viral hemorrhagic fever and significant morbidity and mortality in humans. The evaluation and deployment of vaccines to prevent and control Ebola and Marburg outbreaks must be informed by an understanding of the transmission and natural history of the causative infections, but little is known about the burden of asymptomatic infection or undiagnosed disease. This systematic review of the published literature examined the seroprevalence of antibodies to orthoebolaviruses and orthomarburgviruses in sub-Saharan Africa. Methods: The review protocol was registered on PROSPERO (ID: CRD42023415358) and previously published. Eighty-seven articles describing 85 studies were included, of which seventy-six measured antibodies to orthoebolaviruses and forty-one measured antibodies to orthomarburgviruses. Results: The results highlight three central findings that may have implications for vaccine development and deployment. First, substantial antibody seropositivity to Ebola virus (EBOV) and Sudan virus (SUDV) was observed in populations from outbreak-affected areas (≤33% seroprevalence among general populations; ≤41% seroprevalence among healthcare workers and close contacts of disease cases). Second, antibody seropositivity to EBOV, SUDV, and Marburg virus (MARV) was observed among populations from areas without reported outbreaks, with seroprevalence ranging from <1 to 21%. Third, in Central and East Africa, MARV antibody seroprevalence was substantially lower than EBOV or SUDV antibody seroprevalence, even in outbreak-affected areas and in populations at a moderate or high risk of infection (with MARV seroprevalence mostly ranging from 0 to 3%). Conclusions: Whilst gaps remain in our understanding of the significance of antibody seropositivity in some settings and contexts, these findings may be important in considering target indications for novel filovirus vaccines, in defining study designs and strategies for demonstrating vaccine efficacy or effectiveness, and in planning and evaluating vaccine deployment strategies to prevent and control outbreaks.

Keywords: filoviruses; human infection; seroprevalence; sub-Saharan Africa; systematic review.


Conflict of interest statement

The authors declare that they have no direct financial interest or personal relationships that could influence the content of this manuscript. However, it is important to note that IAVI is actively engaged in the research and development of filovirus vaccines, which may be relevant to the topics covered in the systematic review. Some of the authors are currently employed by IAVI, while others are previously employed with IAVI. This work is funded by BARDA and the affiliation may be considered potential conflicts of interest.

Figures

Figure 1
Figure 1
Systematic review flowchart. Abbreviations: n, number; SSA, sub-Saharan Africa. a Records describing studies that measured the prevalence of active infection (i.e., through viral detection) were eligible for inclusion in the systematic review. However, they were excluded from this paper, which presents the results on antibody seroprevalence (excluded as part of “ineligible study design”). “Other” refers to excluded systematic reviews, methods papers, or non-virus studies that came up during the search.
Figure 2
Figure 2
EBOV outbreaks and antibody seroprevalence studies in sub-Saharan Africa from (a) 1975 to 1987, (b) 1988 to 2000, (c) 2001–2013, and (d) 2014–2024. The outbreaks are indicated with grey spots and annotated (number of cases, year(s)) with grey boxes. Antibody seroprevalence studies are indicated with yellow spots (or an X if no [i.e., 0%] antibody seropositivity was reported). Brief study details (the dates of sample collection, country/-ies where the study was conducted, type of assay used, and risk level of study population) are provided in white boxes. The red circles and highlighting identify studies that were conducted during or after an EBOV outbreak. Some studies (which are labeled with “a”) used assays that measured antibody responses to multiple orthoebolaviruses combined (i.e., they did not distinguish between the antibodies to the different viruses). Where studies were conducted in an area affected by an outbreak of EBOV, we assumed that the seropositivity identified primarily reflects responses to EBOV [36,37,38,39,40,41,42,43,44,45,46,47,48,49,50,51,52,53,54,55,56,57,58,59,60,61,62,63,64,65,66,67,68,69,70,71,72,73,74,75,76,77,78,79,80,81,82,83,84,85,86,87,88,89,90,91,92,93,94,95,96,97,98,99,100,101,102,103,104,105,106,107,108].
Figure 2
Figure 2
EBOV outbreaks and antibody seroprevalence studies in sub-Saharan Africa from (a) 1975 to 1987, (b) 1988 to 2000, (c) 2001–2013, and (d) 2014–2024. The outbreaks are indicated with grey spots and annotated (number of cases, year(s)) with grey boxes. Antibody seroprevalence studies are indicated with yellow spots (or an X if no [i.e., 0%] antibody seropositivity was reported). Brief study details (the dates of sample collection, country/-ies where the study was conducted, type of assay used, and risk level of study population) are provided in white boxes. The red circles and highlighting identify studies that were conducted during or after an EBOV outbreak. Some studies (which are labeled with “a”) used assays that measured antibody responses to multiple orthoebolaviruses combined (i.e., they did not distinguish between the antibodies to the different viruses). Where studies were conducted in an area affected by an outbreak of EBOV, we assumed that the seropositivity identified primarily reflects responses to EBOV [36,37,38,39,40,41,42,43,44,45,46,47,48,49,50,51,52,53,54,55,56,57,58,59,60,61,62,63,64,65,66,67,68,69,70,71,72,73,74,75,76,77,78,79,80,81,82,83,84,85,86,87,88,89,90,91,92,93,94,95,96,97,98,99,100,101,102,103,104,105,106,107,108].
Figure 3
Figure 3
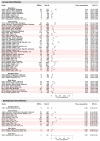
Forest plots showing EBOV antibody seroprevalence with 95% CIs from studies that evaluated population groups at a (a) low, (b) moderate, or (c) high risk of infection. Within each forest plot, the studies are stratified by African region and then ordered by study date (the year that the study was conducted, or the year of sample collection if earlier). The study details provided include the publication date, first author name, study location, and risk of bias rating. For each study, the plot shows the number of individuals who were seropositive (EBOV+) out of the total number sampled. Studies conducted within the context of an EBOV outbreak are shaded in red. Some studies used assays that measured antibody responses to multiple orthoebolaviruses combined (i.e., they did not distinguish between the antibodies to the different viruses) (see Figure 3 and Tables S4 and S6). Where studies were conducted in an area affected by an outbreak of EBOV, we assumed that the seropositivity identified primarily reflects responses to EBOV [36,37,38,39,40,41,42,43,44,45,46,47,48,49,50,51,52,53,54,55,56,57,58,59,60,61,62,63,64,65,66,67,68,69,70,71,72,73,74,75,76,77,78,79,80,81,82,83,84,85,86,87,88,89,90,91,92,93,94,95,96,97,98,99,100,101,102,103,104,105,106,107,108].
Figure 3
Figure 3
Forest plots showing EBOV antibody seroprevalence with 95% CIs from studies that evaluated population groups at a (a) low, (b) moderate, or (c) high risk of infection. Within each forest plot, the studies are stratified by African region and then ordered by study date (the year that the study was conducted, or the year of sample collection if earlier). The study details provided include the publication date, first author name, study location, and risk of bias rating. For each study, the plot shows the number of individuals who were seropositive (EBOV+) out of the total number sampled. Studies conducted within the context of an EBOV outbreak are shaded in red. Some studies used assays that measured antibody responses to multiple orthoebolaviruses combined (i.e., they did not distinguish between the antibodies to the different viruses) (see Figure 3 and Tables S4 and S6). Where studies were conducted in an area affected by an outbreak of EBOV, we assumed that the seropositivity identified primarily reflects responses to EBOV [36,37,38,39,40,41,42,43,44,45,46,47,48,49,50,51,52,53,54,55,56,57,58,59,60,61,62,63,64,65,66,67,68,69,70,71,72,73,74,75,76,77,78,79,80,81,82,83,84,85,86,87,88,89,90,91,92,93,94,95,96,97,98,99,100,101,102,103,104,105,106,107,108].
Figure 4
Figure 4
SUDV, BDBV, and TAFV outbreaks and antibody seroprevalence studies in sub-Saharan Africa from 1975 to 2024. Outbreaks are indicated with grey spots and annotated (number of cases, causative virus(es), year(s)) with grey boxes. No human RESTV infections have been reported in sub-Saharan Africa to date. Antibody seroprevalence studies are indicated with yellow spots (or an X if no antibody seropositivity was reported). Brief study details (the dates of sample collection, country/-ies where the study was conducted, type of assay used, and risk level of study population) are provided in white boxes. The red circles and highlighting identify studies that were conducted during or after an outbreak. a Some studies used assays that measured antibody responses to multiple orthoebolaviruses combined (i.e., they did not distinguish between the antibodies to the different viruses). Where studies were conducted in an area affected by an outbreak of SUDV, we assumed that the seropositivity identified primarily reflects responses to SUDV [37,41,42,43,53,60,64,72,77,82,98,102,103,104,106,108,109,110].
Figure 5
Figure 5
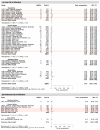
Forest plots showing SUDV antibody seroprevalence with 95% CIs from studies that evaluated population groups at a (a) low, (b) moderate, or (c) high risk of infection. Within each forest plot, the studies are stratified by African region and then ordered by study date (the year that the study was conducted, or the year of sample collection if earlier). The study details provided include the publication date, first author name, study location, and risk of bias rating. For each study, the plot shows the number of individuals who were seropositive (SUDV+) out of the total number sampled. Studies conducted within the context of a SUDV outbreak are shaded in red. Some studies used assays that measured antibody responses to multiple orthoebolaviruses combined (i.e., they did not distinguish between the antibodies to the different viruses) (see Figure 4 and Tables S4 and S6). Where studies were conducted in an area affected by an outbreak of SUDV, we assumed that the seropositivity identified primarily reflects responses to SUDV [37,41,42,43,53,60,64,72,77,82,98,102,103,104,106,108,109,110].
Figure 6
Figure 6
MARV and RAVV outbreaks and antibody seroprevalence studies in sub-Saharan Africa from 1975 to 2024. Outbreaks are indicated with grey spots and annotated (number of cases, causative virus(es), year(s)) with grey boxes. Full details are not yet available for the 2024 Rwandan Marburg outbreak, which is ongoing with 49 confirmed cases and 12 fatalities at the time of writing. The viral sequencing results from the Rwandan outbreak are pending, so the specific causative virus is unknown. Antibody seroprevalence studies are indicated with yellow spots (or an X if no antibody seropositivity was reported). Brief study details (the dates of sample collection, country/-ies where the study was conducted, type of assay used, and risk level of study population) are provided in white boxes. The red circles and highlighting identify studies that were conducted during or after a MARV/RAVV outbreak. The orange circles and shading identify studies that were conducted in areas from where an index case of a MARV outbreak traveled. All studies evaluated MARV antibody seroprevalence [36,37,38,39,41,42,43,44,53,59,60,61,63,64,65,72,75,76,77,81,82,83,84,98,101,102,103,104,105,106,107,108,111,112,113,114,115,116,117,118,119,120,121].
Figure 7
Figure 7
Forest plots showing MARV antibody seroprevalence with 95% CIs from studies that evaluated population groups at a (a) low, (b) moderate, or (c) high risk of infection. Within each forest plot, the studies are stratified by African region and then ordered by the study date (the year that the study was conducted, or the year of sample collection if earlier). The study details provided include the publication date, first author name, study location, and risk of bias rating. For each study, the plot shows the number of individuals that were seropositive (MARV+) out of the total number sampled. Studies conducted within the context of a MARV outbreak are shaded in red. Three studies that were conducted in areas where the index case of a MARV outbreak traveled from are shaded in orange [36,37,38,39,41,42,43,44,53,59,60,61,63,64,65,72,75,76,77,81,82,83,84,98,101,102,103,104,105,106,107,108,111,112,113,114,115,116,117,118,119,120,121].
Figure 7
Figure 7
Forest plots showing MARV antibody seroprevalence with 95% CIs from studies that evaluated population groups at a (a) low, (b) moderate, or (c) high risk of infection. Within each forest plot, the studies are stratified by African region and then ordered by the study date (the year that the study was conducted, or the year of sample collection if earlier). The study details provided include the publication date, first author name, study location, and risk of bias rating. For each study, the plot shows the number of individuals that were seropositive (MARV+) out of the total number sampled. Studies conducted within the context of a MARV outbreak are shaded in red. Three studies that were conducted in areas where the index case of a MARV outbreak traveled from are shaded in orange [36,37,38,39,41,42,43,44,53,59,60,61,63,64,65,72,75,76,77,81,82,83,84,98,101,102,103,104,105,106,107,108,111,112,113,114,115,116,117,118,119,120,121].

References

    1. Feldmann H., Klank H.-D. Filoviruses. In: Baron S., editor. Medical Microbiology. Volume 4 University of Texas Medical Branch at Galveston; Galveston, TX, USA: 1996.
    1. Biedenkopf N., Bukreyev A., Chandran K., Di Paola N., Formenty P.B.H., Griffiths A., Hume A.J., Muhlberger E., Netesov S.V., Palacios G., et al. Renaming of genera Ebolavirus and Marburgvirus to Orthoebolavirus and Orthomarburgvirus, respectively, and introduction of binomial species names within family Filoviridae. Arch. Virol. 2023;168:220. doi: 10.1007/s00705-023-05834-2. - DOI - PubMed
    1. Ebola Virus Disease. [(accessed on 10 October 2024)]. Available online: https://www.paho.org/en/topics/ebola-virus-disease#:~:text=The%20average....
    1. Marburg Virus Disease. [(accessed on 10 October 2024)]. Available online: https://www.who.int/health-topics/marburg-virus-disease#tab=tab_1.
    1. Marburg Virus Disease—Ghana. [(accessed on 10 October 2024)]. Available online: https://www.who.int/emergencies/disease-outbreak-news/item/2022-DON409.

LinkOut - more resources