. 2024 Dec 23;12(12):1451.
doi: 10.3390/vaccines12121451.

T Cell Responses to BA.2.86 and JN.1 SARS-CoV-2 Variants in Elderly Subjects

Affiliations

T Cell Responses to BA.2.86 and JN.1 SARS-CoV-2 Variants in Elderly Subjects

Irene Segato et al. Vaccines (Basel). .

Abstract

Background/objectives: New SARS-CoV-2 variants are continuously emerging, making it essential to assess the efficacy of vaccine-induced immune protection. Limited information is available regarding T cell responses to BA.2.86 and JN.1 variants, particularly in elderly individuals.

Methods: We evaluated T cell and total IgG responses against the receptor-binding domain (RBD) of the ancestral SARS-CoV-2 strain, as well as BA.2.86 and JN.1 omicron subvariants, in two groups of subjects. One group consisted of SARS-CoV-2-exposed elderly individuals who were fully vaccinated with the BNT162B2 mRNA vaccine, with a booster dose of the updated 2023-2024 COVID-19 vaccine (XBB.1.5) at least 15 days after receiving a booster dose of the updated 2023-2024 COVID-19 vaccine. The second group consisted of healthcare workers who were unexposed to SARS-CoV-2 one month after the booster dose of the first-generation BNT162b2 mRNA vaccine. T cell activation-induced markers (AIM) and IFN-γ secretion were evaluated by flow cytometry and ELISpot assays, respectively.

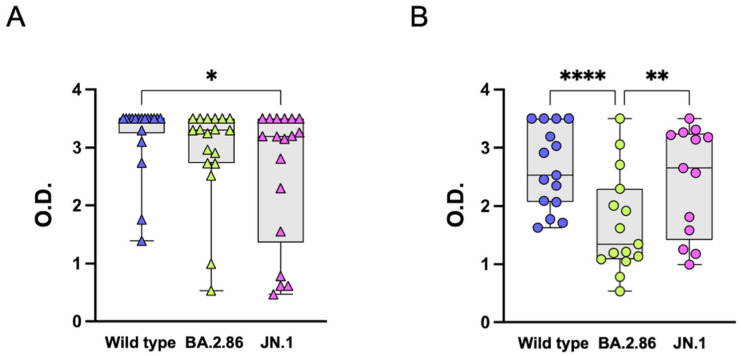
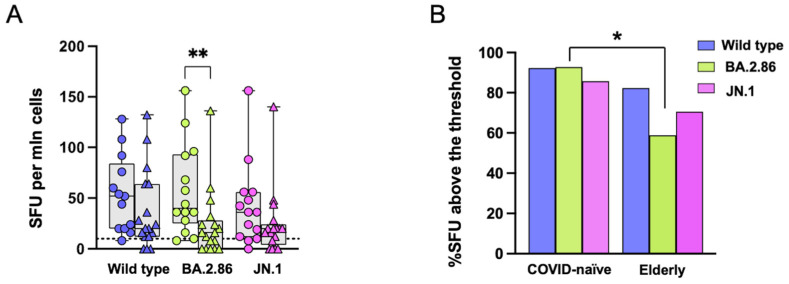
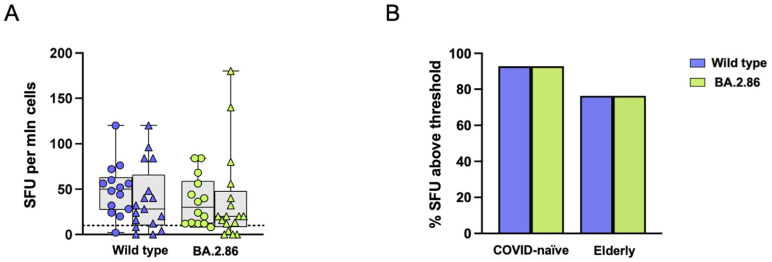
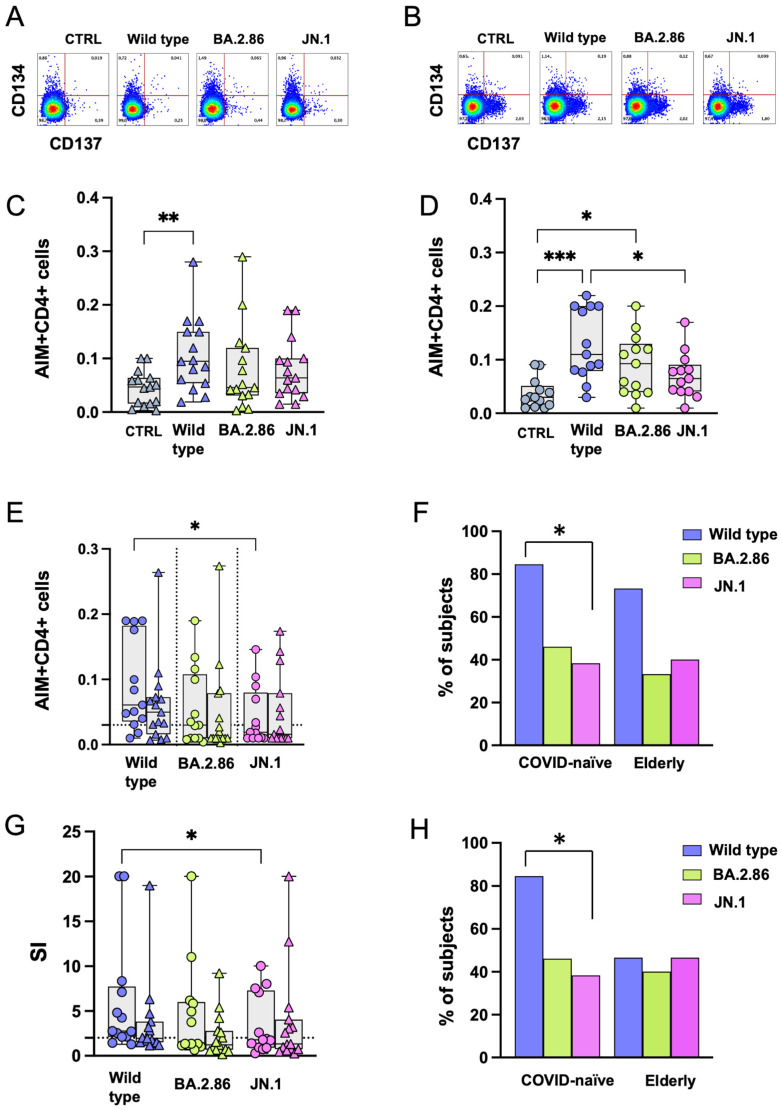
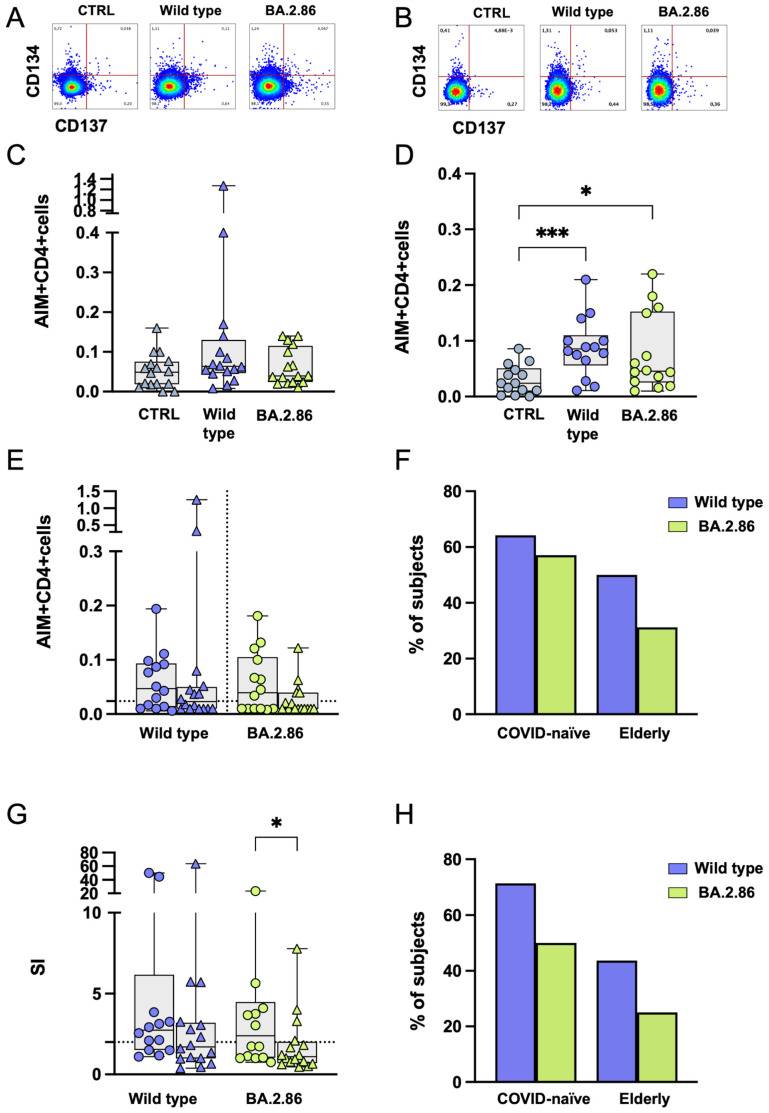
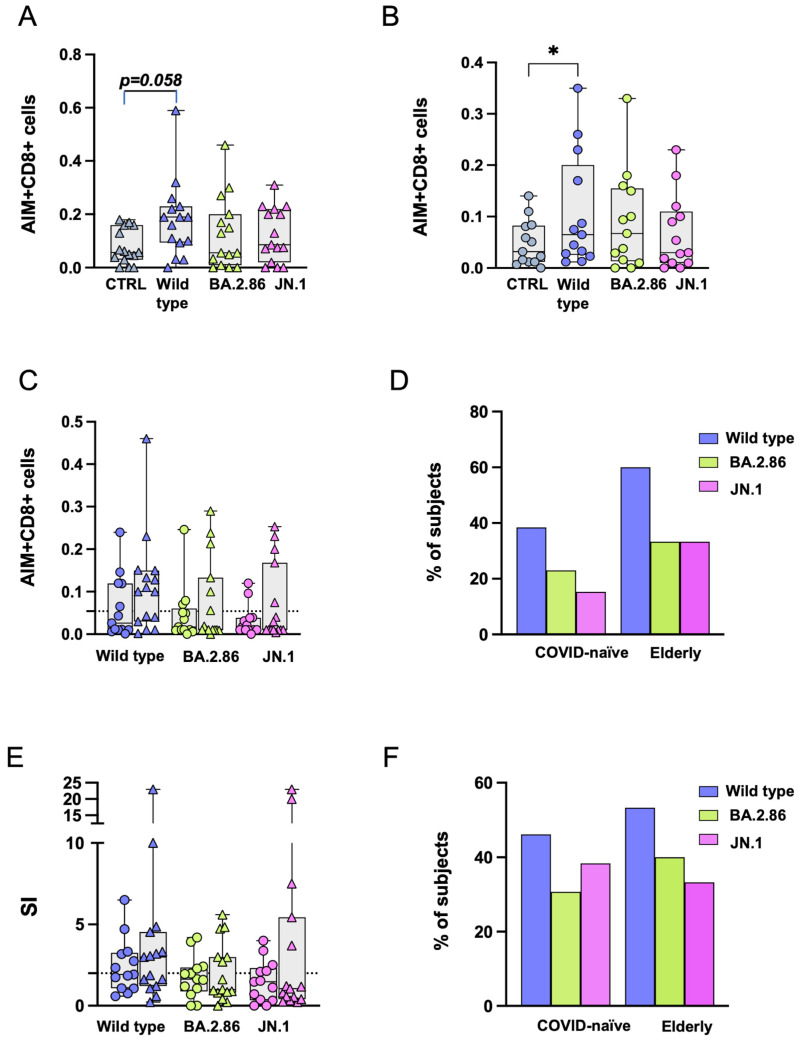
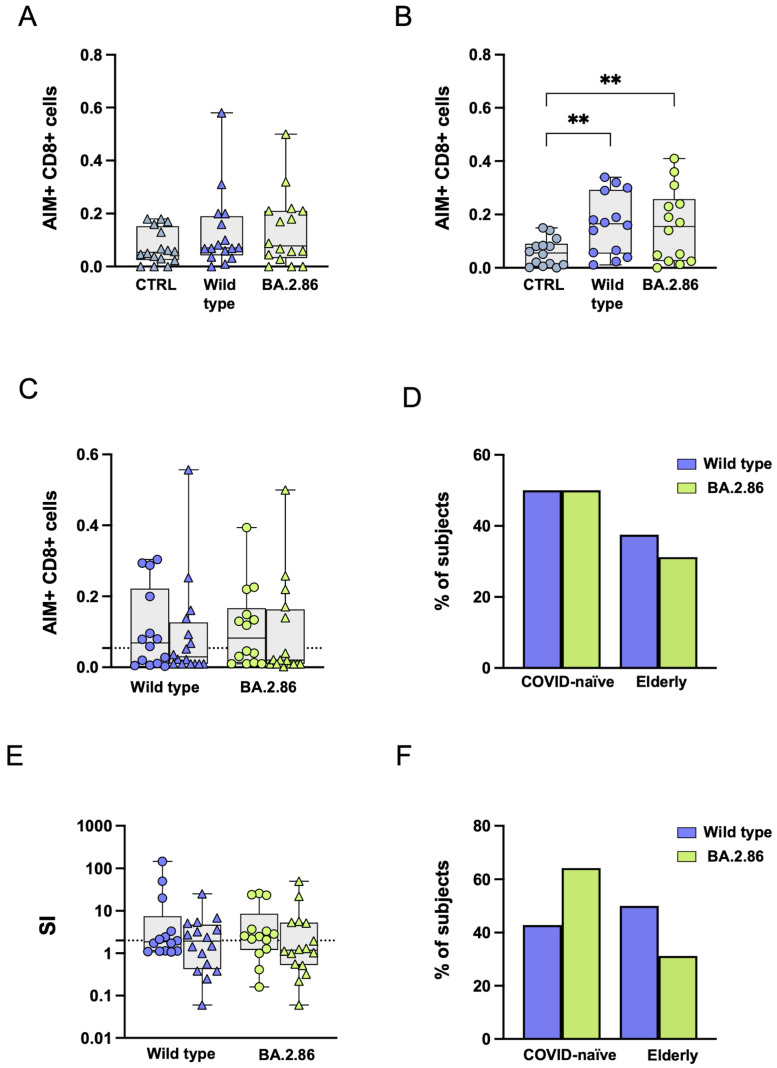
Results: Elderly subjects showed reduced IgG levels against JN.1 compared with the ancestral strain. BA.2.86 stimulation resulted in lower IFN-γ levels in the elderly versus the COVID-19-naïve group. AIM analysis showed that among T cells, CD4+ were the most responsive, with a reduced proportion of JN.1-reactive CD4+ T cells compared with the ancestral strain in the SARS-CoV-2-unexposed group. Despite receiving the updated booster, the elderly group showed reduced CD4+ T cell reactivity to BA.2.86.

Conclusions: The XBB.1.5-containing vaccine induced lower CD4+ T cell responses against BA.2.86 in the elderly. CD4+ T cells from BNT16b2-vaccinated, COVID-19-naïve subjects recognized ancestral and BA.2.86 RBD strains while showing reduced responses to JN.1. These results emphasize the need for tailored vaccine strategies for emerging variants, particularly in vulnerable populations.

Keywords: BA.2.86; COVID-19; JN.1; SARS-CoV-2; elderly; vaccine.


Conflict of interest statement

The authors declare no conflicts of interest.

Figures

Figure 1
Figure 1
Anti-RBD IgG responses to ancestral wild-type, BA.2.86, and JN.1 Omicron subvariants. (A) Serum IgG from XBB.1.5-vaccinated elderly subjects (triangles) specific for the RBD ancestral wild-type (blue symbols), BA.2.86 (green symbols), or JN.1 (pink symbols) proteins. (B) Serum IgG from BNT162b2 mRNA-vaccinated, COVID-19-naïve healthcare workers (circles) specific for the RBD ancestral wild-type (blue symbols), BA.2.86 (green symbols), or JN.1 (pink symbols) proteins. RBD—receptor-binding domain, O.D.—Optical Density. The one-way Friedman with Dunn’s multiple comparison test was used to compare data. * p < 0.05; ** p < 0.01; **** p < 0.0001.
Figure 2
Figure 2
Interferon (IFN)γ secretion following stimulation with RBD proteins. Each data point represents the spot count from one study participant. Results are given as IFN-γ spot-forming units (SFU)/106 PBMC from each study participant. (A) SFU in the elderly group (triangles) and in the COVID-19-naïve subject group (circles) following ancestral (blue symbols), BA.2.86 (green symbols), or JN.1 (pink symbols) RBD protein stimulation, after subtraction of the unstimulated control. (B) Proportion of responders above the SFU threshold. The positive cut-off was set at 10 IFN-γ SFU/106 PBMC. SFU—spot-forming units; RBD—receptor-binding domain. Statistical differences between groups were assessed by the non-parametric Mann–Whitney U test. Fisher’s exact test was used to compare proportions. * p < 0.05; ** p < 0.01.
Figure 3
Figure 3
Interferon (IFN)γ secretion following stimulation with RBD overlapping peptides. Each data point represents the spot count from one study participant. Results are given as IFN-γ spot-forming units (SFU)/106 PBMC. (A) No differences in SFU were observed in the elderly group (triangles) or the COVID-19-naïve group (circles) following ancestral (blue symbols) or BA.2.86 (green symbols) RBD peptide stimulation after subtraction of the unstimulated control. (B) The proportion of responders above the threshold was not significantly different following ancestral or BA.2.86 peptide stimulation in the elderly group compared with the COVID-19-naïve group. The positive cut-off was set at 10 IFN-γ SFU/106 PBMC. SFU—spot-forming units; RBD—receptor-binding domain Statistical differences between groups were assessed by the non-parametric Mann–Whitney U test. Statistical differences within the same group were assessed by the Wilcoxon matched-pairs signed-rank test.
Figure 4
Figure 4
Expression of Activation-Induced Markers (AIMs) in CD4+ T cells following stimulation with RBD proteins. Representative AIM dot plots from (A) one elderly and (B) one COVID-19-naïve subject. Frequency of AIM-expressing CD4+ T cells following ancestral wild-type (blue symbols), BA.2.86 (green symbols), or JN.1 (pink symbols) RBD stimulation in (C) the elderly group (triangles) and (D) in the COVID-19-naïve group (circles). (E) Reactive CD4+ T cells following wild-type (blue symbols), BA.2.86 (green symbols), or JN.1 (pink symbols) RBD protein stimulation in COVID-19-naïve subjects (circles) and elderly subjects (triangles) after subtraction of the negative control. (F) Frequency of subjects responding above the threshold in the two groups. (G) Stimulation Index in the elderly group and in the COVID-19-naïve group. (H) Frequency of subjects responding 2-fold above the stimulation index. RBD—receptor-binding domain; SI—Stimulation Index. The one-way Friedman with Dunn’s multiple comparison test was used to compare data within the same group. Statistical differences between groups were assessed by the non-parametric Mann–Whitney U test. Fisher’s exact test was used to compare proportions. * p < 0.05; ** p < 0.01; *** p < 0.001.
Figure 5
Figure 5
Expression of Activation-Induced Markers (AIMs) in CD4+ T cells following stimulation with RBD overlapping peptides. Representative AIM dot plots from (A) one elderly and (B) one COVID-19-naïve subject. Frequency of AIM-expressing CD4+ T cells following stimulation with ancestral RBD wild-type (blue symbols) or BA.2.86 (green symbols) overlapping peptides in (C) the elderly group (triangles) and (D) in the COVID-19-naïve group (circles). (E) RBD-reactive CD4+ T cells following stimulation with wild-type (blue symbols) or BA.2.86 (green symbols) RBD overlapping peptides in COVID-19-naïve and elderly subjects after subtraction of the negative control. (F) Frequency of subjects responding above the threshold in the two groups. (G) Stimulation Index in the elderly group and in the COVID-19-naïve group. (H) Frequency of subjects responding 2-fold above the stimulation index. RBD—receptor-binding domain; SI—Stimulation Index. Statistical differences between data within the same group were assessed by the non-parametric Friedman test followed by Dunn’s multiple comparisons test. The one-way Friedman with Dunn’s multiple comparison test was used to compare data within the same group. Statistical differences between groups were assessed by the non-parametric Mann–Whitney U test. Fisher’s exact test was used to compare proportions. * p < 0.05; *** p < 0.001.
Figure 6
Figure 6
Expression of Activation-Induced Markers (AIMs) in CD8+ T cells following stimulation with RBD proteins. Frequency of AIM-expressing CD8+ T cells following ancestral wild-type (blue symbols), BA.2.86 (green symbols), or JN.1 (pink symbols) RBD protein stimulation in (A) elderly subjects (triangles) and in (B) COVID-19-naïve subjects (circles). (C) RBD-induced reactive CD8+ T cells following RBD wild-type (blue symbols), BA.2.86 (green symbols), or JN.1 (pink symbols) protein stimulation in COVID-19-naïve and elderly individuals after subtraction of the negative control. (D) Frequency of subjects responding above the threshold in COVID-19-naïve and elderly groups. (E) Stimulation Index in the elderly group and in the COVID-19-naïve group. (F) Frequency of subjects responding 2-fold above the stimulation index. RBD—receptor-binding domain; SI—Stimulation Index. The one-way Friedman with Dunn’s multiple comparison test was used to compare data within the same group. Statistical differences between groups were assessed by the non-parametric Mann–Whitney U test. Fisher’s exact test was used to compare proportions. * p < 0.05.
Figure 7
Figure 7
Expression of Activation-Induced Markers (AIMs) in CD8+ T cells following stimulation with RBD overlapping peptides. Frequency of AIM-expressing CD8+ T cells following ancestral wild-type (blue symbols) or BA.2.86 (green symbols) RBD protein stimulation in (A) elderly subjects (triangles) and in COVID-19-naïve subjects (circles) (B). (C) RBD-induced reactive CD8+ T cells following stimulation with wild-type (blue symbols) or BA.2.86 (green symbols) RBD overlapping peptides in COVID-19-naïve and elderly subjects after subtraction of the negative control. (D) Frequency of subjects responding above the threshold in the COVID-19-naïve and in the elderly groups. (E) Stimulation Index in the elderly group and in the COVID-19-naïve group. (F) Frequency of subjects responding 2-fold above the stimulation index. RBD—receptor-binding domain; SI—Stimulation Index. The one-way Friedman with Dunn’s multiple comparison test was used to compare data within the same group. Statistical differences between groups were assessed by the non-parametric Mann–Whitney U test. Fisher’s exact test was used to compare proportions. ** p < 0.01.

Similar articles

Cited by

References

    1. Favresse J., Gillot C., Closset M., Cabo J., Wauthier L., David C., Elsen M., Dogné J., Douxfils J. Durability of humoral and cellular immunity six months after the BNT162b2 bivalent booster. J. Med. Virol. 2024;96:e29365. doi: 10.1002/jmv.29365. - DOI - PubMed
    1. Arunachalam P.S., Lai L., Samaha H., Feng Y., Hu M., Hui H.S.-Y., Wali B., Ellis M., Davis-Gardner M.E., Huerta C., et al. Durability of immune responses to mRNA booster vaccination against COVID-19. J. Clin. Investig. 2023;133:e167955. doi: 10.1172/JCI167955. - DOI - PMC - PubMed
    1. Chenchula S., Chandra M.B., Adusumilli M.B., Ghanta S.N., Bommasani A., Kuttiappan A., Padmavathi R., Amerneni K.C., Chikatipalli R., Ghanta M.K., et al. Immunogenicity, clinical efficacy and safety of additional second COVID-19 booster vaccines against Omicron and its subvariants: A systematic review. Rev. Med. Virol. 2024;34:e2515. doi: 10.1002/rmv.2515. - DOI - PubMed
    1. Moustsen-Helms I.R., Bager P., Larsen T.G., Møller F.T., Vestergaard L.S., Rasmussen M., Hansen C.H., Christiansen L.E., Gubbels S., Trebbien R., et al. Relative vaccine protection, disease severity, and symptoms associated with the SARS-CoV-2 omicron subvariant BA.2.86 and descendant JN.1 in Denmark: A nationwide observational study. Lancet Infect. Dis. 2024;24:964–973. doi: 10.1016/S1473-3099(24)00220-2. - DOI - PubMed
    1. Lin D.-Y., Du Y., Xu Y., Paritala S., Donahue M., Maloney P. Durability of XBB.1.5 Vaccines against Omicron Subvariants. N. Engl. J. Med. 2024;390:2124–2127. doi: 10.1056/NEJMc2402779. - DOI - PMC - PubMed

LinkOut - more resources