Comparative Study
. 2024 Dec 18;16(12):1936.
doi: 10.3390/v16121936.

A Global Collaborative Comparison of SARS-CoV-2 Antigenicity Across 15 Laboratories

Affiliations
Comparative Study

A Global Collaborative Comparison of SARS-CoV-2 Antigenicity Across 15 Laboratories

Polina Brangel et al. Viruses. .

Abstract

Setting up a global SARS-CoV-2 surveillance system requires an understanding of how virus isolation and propagation practices, use of animal or human sera, and different neutralisation assay platforms influence assessment of SARS-CoV-2 antigenicity. In this study, with the contribution of 15 independent laboratories across all WHO regions, we carried out a controlled analysis of neutralisation assay platforms using the first WHO International Standard for antibodies to SARS-CoV-2 variants of concern (source: NIBSC). Live virus isolates (source: WHO BioHub or individual labs) or spike plasmids (individual labs) for pseudovirus production were used to perform neutralisation assays using the same serum panels. When comparing fold drops, excellent data consistency was observed across the labs using common reagents, including between pseudovirus and live virus neutralisation assays (RMSD of data from mean fold drop was 0.59). Utilising a Bayesian model, geometric mean titres and assay titre magnitudes (offsets) can describe the data efficiently. Titre magnitudes were seen to vary largely even for labs within the same assay group. We have observed that overall, live Microneutralisation assays tend to have the lowest titres, whereas Pseudovirus Neutralisation have the highest (with a mean difference of 3.2 log2 units between the two). These findings are relevant for laboratory networks, such as the WHO Coronavirus Laboratory Network (CoViNet), that seek to support a global surveillance system for evolution and antigenic characterisation of variants to support monitoring of population immunity and vaccine composition policy.

Keywords: Bayesian model; COVID-19; SARS-CoV-2; antigenicity; global surveillance; neutralisation.


Conflict of interest statement

I.O.D., J.O.A., F.A.S., T.H. (Taweewun Hunsawong), M.B. (Matthias Budt), M.M.S. (Melanie M. Schmitt), C.D., B.M., L.F.L.T., M.F.d.A., A.C.A.d.O., P.A.N., P.D.B.C.C., M.M.S. (Marilda Mendonça Siqueira), J.-M.G., M.B. (Meriem Bekliz), T.W., S.T., B.L.H., A.Z.M., D.S., S.M.S.C., J.K.C.L., L.L.M.P., M.P., N.L., J.O.A., I.O.O., D.Z., O.E., I.H.-G., T.H. (Tandile Hermanus), K.R., J.L., J.N.B., C.C., S.I.R., P.D., T.H. (Tarteel Hassan), J.C., M.D.V.K., S.T., P.B., G.M., D.S. and L.S. declare no competing interests I.E. has received research funding for an unrelated project (IIT) and speaker and consultancy fees from Moderna. V.M.C. is a co-inventor on a patent application entitled “Methods and reagents for diagnosis of SARS-CoV-2 infection” (patent application no eP3809137a1). J.K. is listed as inventor on patents related to VSV-based oncolytic viruses. A.S. has received an honorarium from Pfizer for consulting.

Figures

Figure 1
Figure 1
Titres of WHO International Standard NIBSC 21/338 measured in 15 labs using WHO BioHub virus isolates and estimated GMTs. (A) Dots in each panel indicate the measured titres of variants (with the colours indicating the variant as shown in the key) by each lab against the International Standard (for multiple repeats, the geometric mean is shown). The grey line indicates the geometric mean titre (GMT) of each of these measurements across all datasets. Up or down arrows, respectively, indicate titres at upper and lower limits of detection. The labels at the bottom of each figure indicate the lab making the measurement (the abbreviations are available in Table S1). Data are grouped according to assay types, which are indicated at the top-left corner for each group (MicroNeut, FRNT, PRNT, or PseudoVirusNeut). Labs labelled as (in-house) or labs using assay type of PseudoVirusNeut have isolated their own viruses for these measurements, whereas all the other measurements were made with virus stocks received from the WHO BioHub (and propagated according to each lab’s specified method, accession numbers 2021-WHO-LS-001, 2021-WHO-LS-003, 2022-WHO-LS-014, 2021-WHO-LS-016, 2022-WHO-LS-028, 2023-WHO-LS-001). (B) Each panel in this figure shows the data in Figure 3 after controlling for titre magnitude fitted by the model. The grey line shows the GMT fitted by the model. The bars indicate the 95% high-density interval (HDI) of the posterior for the GMT. The details of the model are given in the SI section Modelling Assay-wise Effects and GM Titres. The number of repeats performed by each lab is given in Table S1.
Figure 2
Figure 2
Posterior distributions for lab-wise and assay-wise offset means. (A) This shows the posterior distribution for the offset parameter for each lab where each lab’s offset is a normal distribution whose mean is given by the assay-type offset whose posterior distributions are shown. (B) The white marker shows the mean, the thin vertical black line shows the 94% HDI, and the thick vertical black line shows the interquartile range.
Figure 3
Figure 3
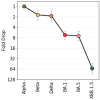
Fold-change reduction compared to Alpha. The figure shows the estimated fold drops of variant titres compared to Alpha. The bars indicate the 94% HDI for the posterior of estimated fold drops.
Figure 4
Figure 4
The cluster groups, landscapes, and metadata. (A) The plot shows the three non-outlier clusters and the outlier cluster obtained from clustering the labs’ collated serum data. The black line shows the (mean centred) representative titre of the cluster, and the bars indicate the 94% HDI for the estimate. The coloured lines indicate individual serum titres after each serum’s titre magnitude (with respect to black line) was subtracted. Lower and upper triangles indicate titres censored from below and above. Colouring of the sera indicates the type of encounter, and encounter types’ colours are given in the legend. n+ indicates that the serum had encounters of infection and vaccination (at least n different times) with Alpha, earlier than Alpha, or unknown variants. Beta/Delta 2+ means that the serum had at least two encounters, one of which was confirmed Beta or Delta. BA.1+ indicates that the serum had at least one encounter with a BA.1 or later variant. The markers (and line segments left of these markers) for thresholded titres are shown in a more transparent colour. This figure shows only the sera whose probability of belonging to any other cluster is less than 0.1, see Figure S14 for others. (B) This shows the landscapes fitted to the non-outlier clusters of sera shown in (A). The base map is from [23]. There is no unique lower limit of detection for the data since different labs have different ranges of dilutions. However they are all generally close to 10 (after the bias estimated in the first section is removed); therefore, in this figure, the lower limit of detection is also set to 10, which is shown by the base plane. One landscape per group is fitted due to the low number of antigens involved in this study. Interactive html plots can be found in the code repo [40]. (C) Bar plots indicate the distribution of encounters (infection or vaccination) of the sera for each cluster (as shown in (B)) as well as the overall distribution for the whole dataset (last bar plot). See Figure S13 for further breakdown of these categories.

References

    1. Markov P.V., Ghafari M., Beer M., Lythgoe K., Simmonds P., Stilianakis N.I., Katzourakis A. The evolution of SARS-CoV-2. Nat. Rev. Microbiol. 2023;21:361–379. doi: 10.1038/s41579-023-00878-2. - DOI - PubMed
    1. Wang L., Møhlenberg M., Wang P., Zhou H. Immune evasion of neutralizing antibodies by SARS-CoV-2 Omicron. Cytokine Growth Factor Rev. 2023;70:13–25. doi: 10.1016/j.cytogfr.2023.03.001. - DOI - PMC - PubMed
    1. Chatterjee S., Bhattacharya M., Nag S., Dhama K., Chakraborty C. A Detailed Overview of SARS-CoV-2 Omicron: Its Sub-Variants, Mutations and Pathophysiology, Clinical Characteristics, Immunological Landscape, Immune Escape, and Therapies. Viruses. 2023;15:167. doi: 10.3390/v15010167. - DOI - PMC - PubMed
    1. Subissi L., Otieno J.R., Worp N., Attar Cohen H., Oude Munnink B.B., Abu-Raddad L.J., Alm E., Barakat A., Barclay W.S., Bhiman J.N., et al. An updated framework for SARS-CoV-2 variants reflects the unpredictability of viral evolution. Nat. Med. 2024;30:1–4. doi: 10.1038/s41591-024-02949-0. - DOI - PubMed
    1. Khoury D.S., Cromer D., Reynaldi A., Schlub T.E., Wheatley A.K., Juno J.A., Subbarao K., Kent S.J., Triccas J.A., Davenport M.P. Neutralizing antibody levels are highly predictive of immune protection from symptomatic SARS-CoV-2 infection. Nat. Med. 2021;27:1205–1211. doi: 10.1038/s41591-021-01377-8. - DOI - PubMed

Publication types

MeSH terms

Supplementary concepts