. 2024 Dec 19;16(12):1947.
doi: 10.3390/v16121947.

Respiratory Virus-Specific and Time-Dependent Interference of Adenovirus Type 2, SARS-CoV-2 and Influenza Virus H1N1pdm09 During Viral Dual Co-Infection and Superinfection In Vitro

Affiliations

Respiratory Virus-Specific and Time-Dependent Interference of Adenovirus Type 2, SARS-CoV-2 and Influenza Virus H1N1pdm09 During Viral Dual Co-Infection and Superinfection In Vitro

Maria Alfreda Stincarelli et al. Viruses. .

Abstract

Background: Understanding the interference patterns of respiratory viruses could be important for shedding light on potential strategies to combat these human infectious agents.

Objective: To investigate the possible interactions between adenovirus type 2 (AdV2), severe acute respiratory syndrome coronavirus 2 (SARS-CoV-2) and influenza A/H1N1 pandemic (H1N1pdm09) using the A549 cell line.

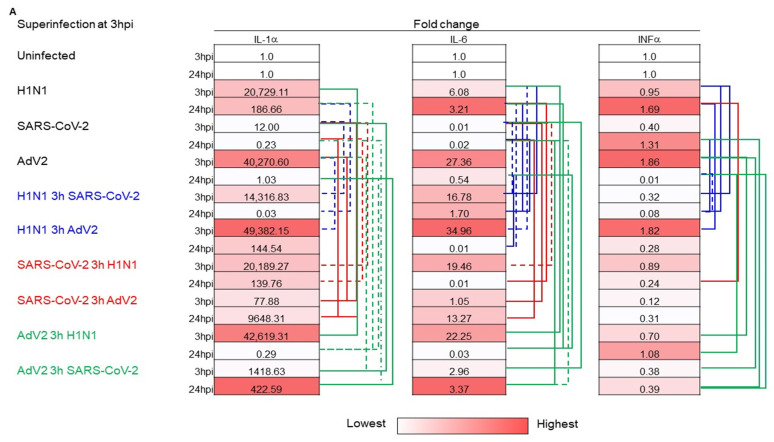
Methods: Single infections, co-infections, and superinfections (at 3 and 24 h after the first virus infection) were performed by varying the multiplicity of infection (MOI). Virus replication kinetics and the mRNA expression of IFN-α, IL-1α and IL-6 were assessed by real-time qPCR.

Results: Co-infection experiments showed different growth dynamics, depending on the presence of the specific virus and time. AdV2 replication remained stable or possibly enhanced in the presence of co-infection with each of the two H1N1pdm09 and SARS-CoV-2 viruses used. In contrast, SARS-CoV-2 replication was facilitated by H1N1pdm09 but hindered by AdV2, indicating possible different interactions. Finally, H1N1pdm09 replication exhibited variably effectiveness in the presence of AdV2 and SARS-CoV-2. Superinfection experiments showed that the replication of all viruses was affected by time and MOI. The mRNA expression of IFN-α, IL-1α and IL-6 showed divergent results depending on the virus used and the time of infection.

Conclusions: Further investigation of co-infection or superinfection may be helpful in understanding the potential relationship involved in the outcome of viral respiratory infection in the human population.

Keywords: SARS-CoV-2; adenovirus; co-infection; influenza virus; superinfection.


Conflict of interest statement

The authors declare no conflicts of interest.

Figures

Figure 1
Figure 1
Effect of co-infection on virus replication. A549 cells were co-infected with the combination of the two indicated viruses at multiplicity of infection (MOI) values of 0.1, 0.01 and 0.001. The upper panels report each individual viral replication at the indicated MOI. The lower panels report the viral replication of the indicate virus used at a fixed MOI of 0.01 in the presence of co-infection with one of the other viruses at three different MOIs (lower, equal and higher). The supernatant of the infected cells was collected after 24, 48 and 72 h post-infection (hpi) and used to extract RNA or DNA. One hundred nanograms of total RNA or DNA were amplified using primers and probes specific for AdV2, H1N1pdm09 and the genomic region of SARS-CoV-2, as reported in the Section 2. Amplification of a specific viral target in the co-infection is indicated with a different color (black and red) and using the same symbol as the related virus in the single infection. The kinetics of viral growth was obtained by comparing the ct values of each virus used in the co-infection with the ct values of the same virus used in the single infection at each time following infection. The values reported are the mean + standard deviation obtained in 3 independent experiments. Virus co-infection with significant differences from the single infection is highlighted in bold. * p < 0.05, Student’s t-test).
Figure 2
Figure 2
Effect of superinfection on viral replication. A549 cells were infected with a first virus at a multiplicity of infection (MOI) of 0.01. Then, after 3 hpi (A) or 24 hpi (B), a second infection was performed with viral inoculum at three indicated MOIs and prepared under the same conditions as described for the first infection. In (A,B), the upper panels show each individual virus replication at the indicated MOI, which was performed as described in the Section 2. In addition, a schematic of the superinfection virus addition and temporal sampling is shown. The lower panels report viral replication of the indicated virus used at a fixed MOI of 0.01 in the presence of co-infection with one of the other viruses performed at three different MOIs (lower, equal and higher). The supernatant of the infected cells was collected at 3, 24 and 48 hpi after infection (panel A, superinfection performed at 3 hpi after initial infection) or 24, 48 and 72 hpi after infection (panel B, superinfection performed at 24 hpi after initial infection) and used for RNA or DNA extraction. One hundred nanograms of total RNA or DNA was amplified using primers and probes specific for AdV2, H1N1pdm09 and the genomic region of SARS-CoV-2 as reported in the Section 2. Amplification of a specific viral target in the superinfection is shown in different colors (black and red) and with the same symbol as the corresponding virus in the song. The kinetic of viral growth was obtained comparing ct values of each virus used in superinfection to ct values of the same virus used in single infection at each time post-infection. Values shown are mean + standard deviation obtained in 3 independent experiments. Virus co-infection with significant difference compared to single infection is highlighted in bold. * p < 0.05, Student’s t-test.
Figure 2
Figure 2
Effect of superinfection on viral replication. A549 cells were infected with a first virus at a multiplicity of infection (MOI) of 0.01. Then, after 3 hpi (A) or 24 hpi (B), a second infection was performed with viral inoculum at three indicated MOIs and prepared under the same conditions as described for the first infection. In (A,B), the upper panels show each individual virus replication at the indicated MOI, which was performed as described in the Section 2. In addition, a schematic of the superinfection virus addition and temporal sampling is shown. The lower panels report viral replication of the indicated virus used at a fixed MOI of 0.01 in the presence of co-infection with one of the other viruses performed at three different MOIs (lower, equal and higher). The supernatant of the infected cells was collected at 3, 24 and 48 hpi after infection (panel A, superinfection performed at 3 hpi after initial infection) or 24, 48 and 72 hpi after infection (panel B, superinfection performed at 24 hpi after initial infection) and used for RNA or DNA extraction. One hundred nanograms of total RNA or DNA was amplified using primers and probes specific for AdV2, H1N1pdm09 and the genomic region of SARS-CoV-2 as reported in the Section 2. Amplification of a specific viral target in the superinfection is shown in different colors (black and red) and with the same symbol as the corresponding virus in the song. The kinetic of viral growth was obtained comparing ct values of each virus used in superinfection to ct values of the same virus used in single infection at each time post-infection. Values shown are mean + standard deviation obtained in 3 independent experiments. Virus co-infection with significant difference compared to single infection is highlighted in bold. * p < 0.05, Student’s t-test.
Figure 3
Figure 3
Expression of cellular innate immune response gene transcription during co-infection at different endpoints. A549 cells were co-infected with the combination of the two indicated viruses at a multiplicity of infection (MOI) of 0.01. The infected cells were collected 3 and 24 h after infection and used to extract RNA. One hundred nanograms of total RNA were amplified using primers and probes specific for interleukin-1 alpha (IL-1α), interferon-alpha (IFN-α) and interleukin-6 (IL-6). The mRNA expression levels of interleukin-1 (IL-1α), interferon-alpha (IFN-α) and interleukin-6 (IL-6) as indicators of cellular innate immune response were measured at 3 and 24 h after infection. The expression of selected genes in three independent co-infected cultures was visualized as a fold change compared with sham-infected cultures and cells infected with a single virus using the ΔΔCt method. The mRNA expression of target genes was normalized to 18S gene expression. Values reported are the average obtained in 3 independent experiments. Cytokine mRNA expression between co-infection and single infection with significant differences (solid line p < 0.05, dashed line p < 0.01, Student’s t-test) is reported.
Figure 4
Figure 4
Expression of cellular innate immune response gene transcription during superinfection at different endpoints. A549 cells were infected with a first virus at a multiplicity of infection (MOI) of 0.01. Then, after 3 or 24 h, the second infection was performed at a multiplicity of infection (MOI) of 0.01. Superinfection experiments performed at 3 hpi (A) and 24 hpi (B) with different combinations of H1N1, SARS-CoV-2 and AdV2 are reported. Infected cells were collected after 3 and 24 hpi and used to extract RNA. One hundred nanograms of total RNA were amplified using primers and probes specific for interleukin-1 (IL-1α), interferon-alpha (IFN-α), and interleukin-6 (IL-6) The mRNA expression levels of interleukin-1 (IL-1α), interferon-alpha (IFN-α), and interleukin-6 (IL-6) were measured at 3 and 24 hpi after the first infection. The expression of selected genes in three independent superinfected cultures was visualized as fold change compared with mock-infected cultures and cells infected with a single virus using the ΔΔCt method. Target gene expression was normalized to 18S gene expression. Values reported are the average obtained in 3 independent experiments. Cytokine mRNA expression between superinfection and single infection with significant differences (solid line p < 0.05, dashed line p < 0.01, Student’s t-test) is reported.
Figure 4
Figure 4
Expression of cellular innate immune response gene transcription during superinfection at different endpoints. A549 cells were infected with a first virus at a multiplicity of infection (MOI) of 0.01. Then, after 3 or 24 h, the second infection was performed at a multiplicity of infection (MOI) of 0.01. Superinfection experiments performed at 3 hpi (A) and 24 hpi (B) with different combinations of H1N1, SARS-CoV-2 and AdV2 are reported. Infected cells were collected after 3 and 24 hpi and used to extract RNA. One hundred nanograms of total RNA were amplified using primers and probes specific for interleukin-1 (IL-1α), interferon-alpha (IFN-α), and interleukin-6 (IL-6) The mRNA expression levels of interleukin-1 (IL-1α), interferon-alpha (IFN-α), and interleukin-6 (IL-6) were measured at 3 and 24 hpi after the first infection. The expression of selected genes in three independent superinfected cultures was visualized as fold change compared with mock-infected cultures and cells infected with a single virus using the ΔΔCt method. Target gene expression was normalized to 18S gene expression. Values reported are the average obtained in 3 independent experiments. Cytokine mRNA expression between superinfection and single infection with significant differences (solid line p < 0.05, dashed line p < 0.01, Student’s t-test) is reported.

Similar articles

References

    1. Moriyama M., Hugentobler W.J., Iwasaki A. Seasonality of respiratory viral infections. Annu. Rev. Virol. 2020;7:83–101. doi: 10.1146/annurev-virology-012420-022445. - DOI - PubMed
    1. Clementi N., Ghosh S., De Santis M., Castelli M., Criscuolo E., Zanoni I., Clementi M., Mancini N. Viral respiratory pathogens and lung injury. Clin. Microbiol. Rev. 2021;34:e00103-20. doi: 10.1128/CMR.00103-20. - DOI - PMC - PubMed
    1. Zhang A.J., Lee A.C., Chan J.F., Liu F., Li C., Chen Y., Chu H., Lau S.Y., Wang P., Chan C.C., et al. Coinfection by severe acute respiratory syndrome coronavirus 2 and influenza A(H1N1)pdm09 virus enhances the severity of pneumonia in golden syrian hamsters. Clin. Infect. Dis. 2021;72:e978–e992. doi: 10.1093/cid/ciaa1747. - DOI - PMC - PubMed
    1. Li Z., Chen Z.M., Chen L.D., Zhan Y.Q., Li S.Q., Cheng J., Zhu A.R., Chen L.Y., Zhong N.S., Li S.Y., et al. Coinfection with SARS-CoV-2 and other respiratory pathogens in patients with COVID-19 in Guangzhou, China. J. Med. Virol. 2020;92:2381–2383. doi: 10.1002/jmv.26073. - DOI - PMC - PubMed
    1. Maltezou H.C., Papanikolopoulou A., Vassiliu S., Theodoridou K., Nikolopoulou G., Sipsas N.V. COVID-19 and respiratory virus co-infections: A systematic review of the literature. Viruses. 2023;15:865. doi: 10.3390/v15040865. - DOI - PMC - PubMed

Publication types

LinkOut - more resources