. 2025 Jan 28;44(1):115172.
doi: 10.1016/j.celrep.2024.115172. Epub 2025 Jan 7.

Metabolic reprogramming of macrophages by PKM2 promotes IL-10 production via adenosine

Affiliations

Metabolic reprogramming of macrophages by PKM2 promotes IL-10 production via adenosine

Juliana Escher Toller-Kawahisa et al. Cell Rep. .

Abstract

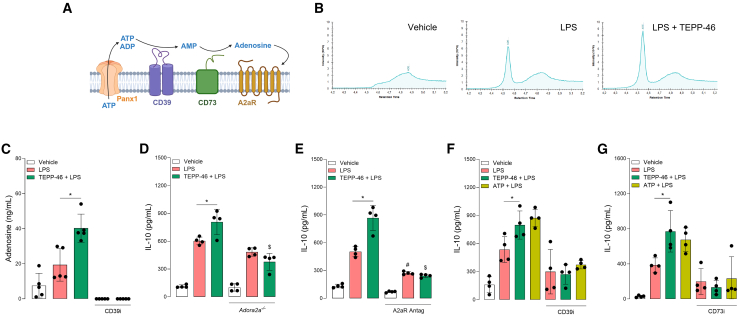
Macrophages play a crucial role in immune responses and undergo metabolic reprogramming to fulfill their functions. The tetramerization of the glycolytic enzyme pyruvate kinase M2 (PKM2) induces the production of the anti-inflammatory cytokine interleukin (IL)-10 in vivo, but the underlying mechanism remains elusive. Here, we report that PKM2 activation with the pharmacological agent TEPP-46 increases IL-10 production in LPS-activated macrophages by metabolic reprogramming, leading to the production and release of ATP from glycolysis. The effect of TEPP-46 is abolished in PKM2-deficient macrophages. Extracellular ATP is converted into adenosine by ectonucleotidases that activate adenosine receptor A2a (A2aR) to enhance IL-10 production. Interestingly, IL-10 production induced by PKM2 activation is associated with improved mitochondrial health. Our results identify adenosine derived from glycolytic ATP as a driver of IL-10 production, highlighting the role of tetrameric PKM2 in regulating glycolysis to promote IL-10 production.

Keywords: CP: Immunology; CP: Metabolism; IL-10; PKM2; adenosine; macrophage; mitochondria dynamics.


Conflict of interest statement

Declaration of interests The authors declare no competing interests.

Figures

None
Graphical abstract
Figure 1
Figure 1
PKM2 activation boosts macrophage metabolism and IL-10 production (A) Immunoblot analysis of PKM2 conformational states in BMDMs pre-treated with TEPP-46 (30 μM) for 1 h and activated with LPS (100 ng/mL) for 24 h. (B) Confocal immunofluorescence analysis stained for PKM2 (green) in BMDMs pre-treated with TEPP-46 for 1 h and activated with LPS for 24 h. (C) il-10 mRNA expression in BMDMs pre-treated with TEPP-46 for 1 h and activated with LPS for indicated time points. Data were normalized to Gapdh (glyceraldehyde 3-phosphate dehydrogenase); fold change is relative to unstimulated BMDMs. n = 3. (D) IL-10 production by BMDMs pre-treated with TEPP-46 for 1 h and activated with LPS for indicated time points. n = 4. (E) IL-10 production by control (Pkm2fl/fl) and PKM2-deficient (Pkm2ΔLyz2) BMDMs pre-treated with TEPP-46 for 1 h and activated with LPS for 24 h. n = 5. (F) Kinetic profile of ECAR (extracellular acidification rate) in BMDMs pre-treated with TEPP-46 for 1 h and activated with LPS for 6 h. n = 6. (G) Lactate production by BMDMs pre-treated with TEPP-46 for 1 h and activated with LPS for indicated time points. n = 4. (H) Kinetic profile of OCR in BMDMs pre-treated with TEPP-46 for 1 h and activated with LPS for 4 h. n = 3. (I) Pyruvate kinase activity in control and PKM2-deficient BMDMs pre-treated with TEPP-46 for 1 h and activated with LPS for 24 h. n = 4. (J) Lactate production by control and PKM2-deficient BMDMs pre-treated with TEPP-46 for 1 h and activated with LPS for 24 h. n = 4. Data are represented as mean ± SEM. , p < 0.05. p values were determined by one-way ANOVA followed by Tukey’s post hoc test. Scale bars: 5 μm.
Figure 2
Figure 2
PKM2 activation improves mitochondrial health (A) Kinetic profile of OCR in BMDMs pre-treated with αIL-10R (20 μg/mL) for 1 h, treated with TEPP-46 (30 μM) or IL-10 (100 ng/mL) for 1 h, and activated with LPS (100 ng/mL) for 24 h. n = 5. (B) Representative confocal immunofluorescence analysis stained with MitoTracker Red (red) and Hoechst (blue) in BMDMs pre-treated with αIL-10R for 1 h, treated with TEPP-46 or IL-10 for 1 h, and activated with LPS for 24 h. Mitochondrial morphology was classified as fragmented (≤1 μm), tubular (1–3 μm), or elongated (≥3 μm). (C) Fluorescence intensity of mitochondrial membrane potential determined with MitoTracker Red in BMDMs pre-treated with TEPP-46 for 1 h and activated with LPS for 24 h determined by confocal. n = 6. (D) Representative confocal immunofluorescence analysis stained for PKM2 (red), mitochondria (MitoTracker Red), and nucleus (blue). Bar graph represents the quantification of PKM2 expression in the mitochondria. (E) Immunoprecipitation of PKM2 in BMDMs pre-treated with TEPP-46 for 1 h and activated with LPS for 24 h. Data are represented as mean ± SEM. , p < 0.05. p values were determined by one-way ANOVA followed by Tukey’s post hoc test. Scale bars: 5 μm.
Figure 3
Figure 3
IL-10 production by PKM2 activation requires ATP release in LPS-activated BMDMs (A and B) (A) Intracellular and (B) released ATP in BMDMs pre-treated with TEPP-46 (100 μM) for 1 h and activated with LPS (100 ng/mL) for indicated time points. n = 5. (C and D) (C) Intracellular and (D) released ATP production by control and PKM2-deficient BMDMs pre-treated with TEPP-46 for 1 h and activated with LPS for 24 h. n = 5. (E) Lactate production by BMDMs pre-treated with TEPP-46 for 1 h and activated with LPS for 24 h in the presence of different glucose concentrations. n = 4. (F and G) (F) Intracellular and (G) released ATP in BMDMs pre-treated with TEPP-46 for 1 h and then activated with LPS for 24 h in the presence of different glucose concentrations. n = 5. (H) IL-10 production by BMDMs pre-treated with TEPP-46 for 1 h and activated with LPS for 24 h in the presence of different glucose concentrations. n = 5. (I) IL-10 production by BMDMs pre-treated with TEPP-46, oligomycin (1.5 μM), and/or heptelidic acid (5 μM) for 1 h and activated with LPS for 4 h. n = 3. (J) Illustration showing CBX blocking the pannexin-1 channel and the subsequent ATP release. (K) IL-10 production by BMDMs pre-treated with TEPP-46 for 1 h and then activated with LPS for 24 h in the presence of CBX (100 μM). n = 4. (L) IL-10 production by control and Panx1-deficient (Panx1−/−) BMDMs pre-treated with TEPP-46 for 1 h and activated with LPS for 24 h. n = 5. (M) Lactate production by BMDMs pre-treated with TEPP-46 for 1 h and activated with LPS for 24 h in the presence of CBX. n = 4. (N) Lactate production by control and Panx1-deficient BMDMs pre-treated with TEPP-46 for 1 h and activated with LPS for 24 h. n = 4. Data are represented as mean ± SEM. , p < 0.05. p values were determined by one-way ANOVA followed by Tukey’s post hoc test.
Figure 4
Figure 4
PKM2 activation boosts IL-10 production by an adenosine-dependent mechanism (A) Illustration showing adenosine production through ATP hydrolysis by CD39 and CD73. (B and C) (B) Representative liquid chromatography-tandem mass spectrometry (LC-MS/MS) chromatograms and (C) adenosine concentration in the supernatant of BMDMs pre-treated with TEPP-46 (100 μM) for 6 h and activated with LPS (100 ng/mL) for 3 h. n = 5. (D) IL-10 production by control and A2aR-deficient (Adora2a−/−) BMDMs pre-treated with TEPP-46 for 1 h and activated with LPS for 24 h. n = 4. (E) IL-10 production by BMDMs pre-treated with TEPP-46 for 1 h and activated with LPS for 24 h in the presence of A2aR antagonist (100 μM). n = 4. (F) IL-10 production by BMDMs pre-treated with TEPP-46 for 1 h and activated with LPS for 24 h in the presence of CD39 inhibitor (ARL 67156 trisodium salt, 200 μM). ATP (100 μM) was used as positive control. n = 4. (G) IL-10 production by BMDMs pre-treated with TEPP-46 for 1 h and activated with LPS for 24 h in the presence of CD73 inhibitor (Adenosine 5'-(α,β-methylene)diphosphate sodium salt, 100 μM). ATP was used as positive control. n = 4. Data are represented as mean ± SEM. , p < 0.05. p values were determined by one-way ANOVA followed by Tukey’s post hoc test.

References

    1. Viola A., Munari F., Sánchez-Rodríguez R., Scolaro T., Castegna A. The Metabolic Signature of Macrophage Responses. Front. Immunol. 2019;10:1462. doi: 10.3389/fimmu.2019.01462. - DOI - PMC - PubMed
    1. Freemerman A.J., Johnson A.R., Sacks G.N., Milner J.J., Kirk E.L., Troester M.A., Macintyre A.N., Goraksha-Hicks P., Rathmell J.C., Makowski L. Metabolic reprogramming of macrophages: glucose transporter 1 (GLUT1)-mediated glucose metabolism drives a proinflammatory phenotype. J. Biol. Chem. 2014;289:7884–7896. doi: 10.1074/jbc.M113.522037. - DOI - PMC - PubMed
    1. Fukuzumi M., Shinomiya H., Shimizu Y., Ohishi K., Utsumi S. Endotoxin-induced enhancement of glucose influx into murine peritoneal macrophages via GLUT1. Infect. Immun. 1996;64:108–112. doi: 10.1128/iai.64.1.108-112.1996. - DOI - PMC - PubMed
    1. Tannahill G.M., Curtis A.M., Adamik J., Palsson-McDermott E.M., McGettrick A.F., Goel G., Frezza C., Bernard N.J., Kelly B., Foley N.H., et al. Succinate is an inflammatory signal that induces IL-1β through HIF-1α. Nature. 2013;496:238–242. doi: 10.1038/nature11986. - DOI - PMC - PubMed
    1. Jha A.K., Huang S.C.C., Sergushichev A., Lampropoulou V., Ivanova Y., Loginicheva E., Chmielewski K., Stewart K.M., Ashall J., Everts B., et al. Network integration of parallel metabolic and transcriptional data reveals metabolic modules that regulate macrophage polarization. Immunity. 2015;42:419–430. doi: 10.1016/j.immuni.2015.02.005. - DOI - PubMed

Publication types

LinkOut - more resources