. 2025 Feb 19;25(7):2600-2609.
doi: 10.1021/acs.nanolett.4c04290. Epub 2025 Jan 8.

Regulation of Cell-Nanoparticle Interactions through Mechanobiology

Affiliations

Regulation of Cell-Nanoparticle Interactions through Mechanobiology

Marco Cassani et al. Nano Lett. .

Abstract

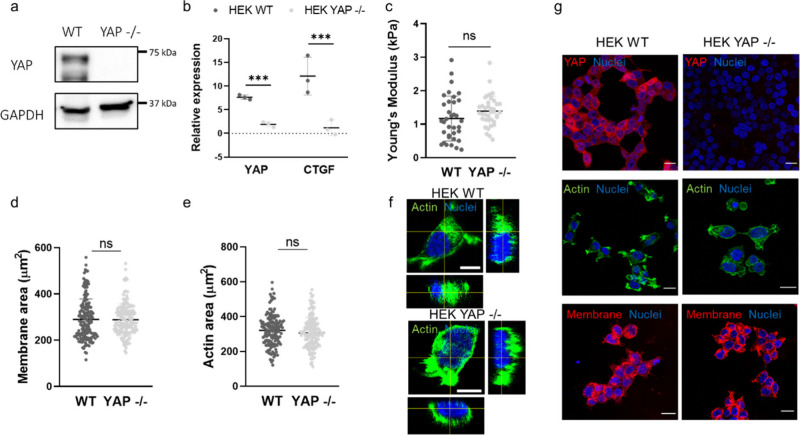
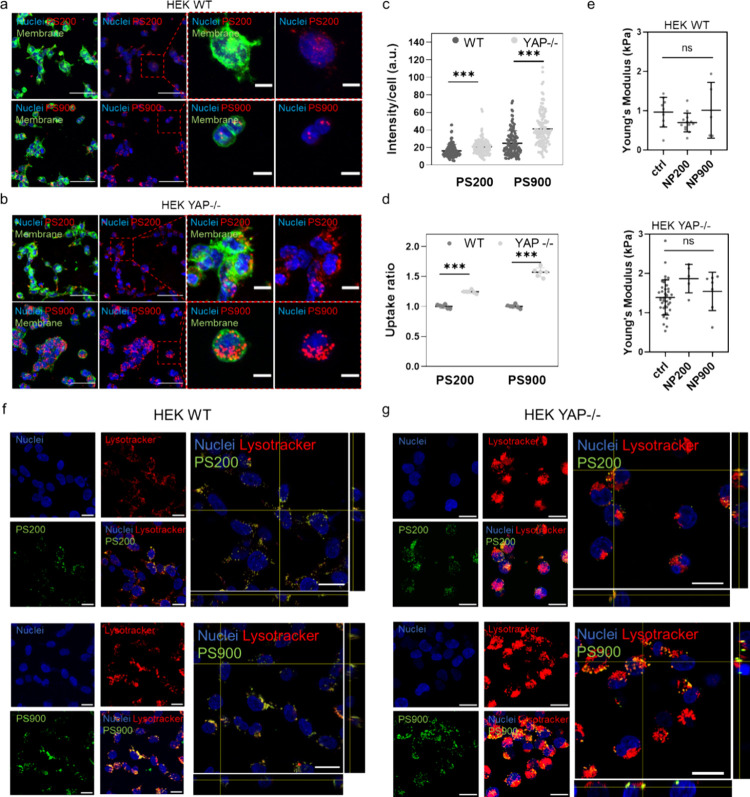
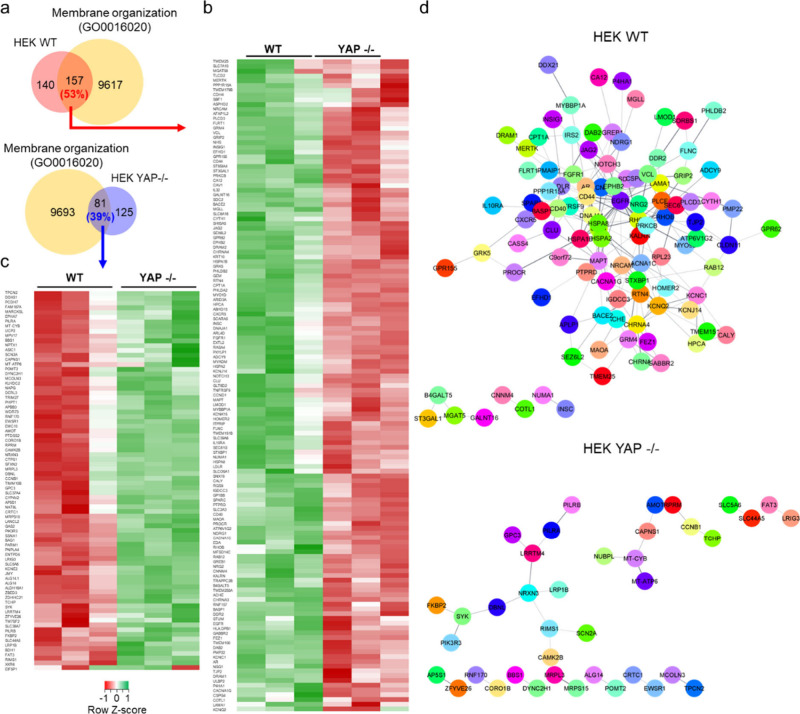
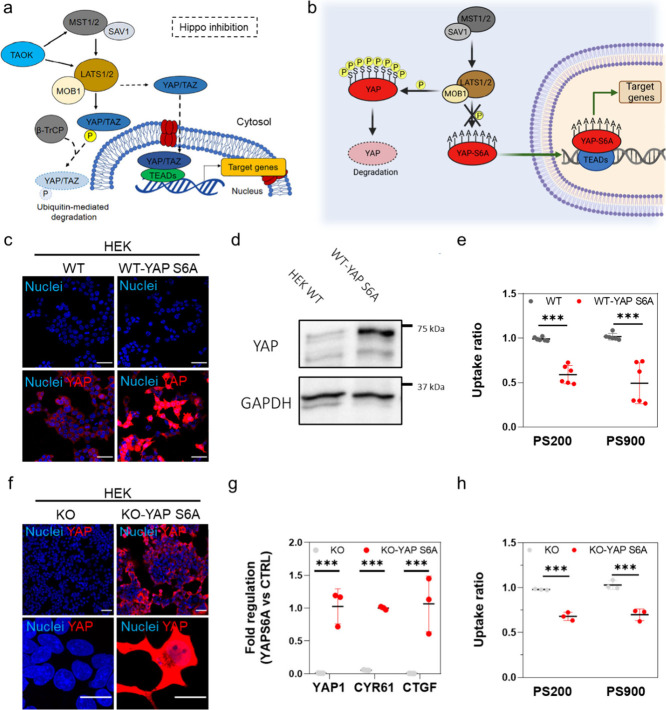
Bio-nano interactions have been extensively explored in nanomedicine to develop selective delivery strategies and reduce systemic toxicity. To enhance the delivery of nanocarriers to cancer cells and improve the therapeutic efficiency, different nanomaterials have been developed. However, the limited clinical translation of nanoparticle-based therapies, largely due to issues associated with poor targeting, requires a deeper understanding of the biological phenomena underlying cell-nanoparticle interactions. In this context, we investigate the molecular and cellular mechanobiology parameters that control such interactions. We demonstrate that the pharmacological inhibition or the genetic ablation of the key mechanosensitive component of the Hippo pathway, i.e., yes-associated protein, enhances nanoparticle internalization by 1.5-fold. Importantly, this phenomenon occurs independently of nanoparticle properties, such as size, or cell properties such as surface area and stiffness. Our study reveals that the internalization of nanoparticles in target cells can be controlled by modulating cell mechanosensing pathways, potentially enhancing nanotherapy specificity.

Keywords: bio−nano interactions; mechanobiology; mechanotransduction; nanoparticles.


Conflict of interest statement

The authors declare no competing financial interest.

Figures

Figure 1
Figure 1
YAP depletion does not influence the adhesion, mechanics, or morphology properties of HEK cells. (a) The levels of YAP protein in WT and YAP −/– HEK cells as analyzed via Western blot. For protein loading normalization, β-tubulin was used. (b) RT-qPCR analysis of YAP and CTGF in WT and YAP −/– HEK cells. Statistical analysis was performed using multiple t-test; n = 3; ***p < 0.001. (c) Dot plots of the Young’s moduli of WT and YAP −/– HEK cells, as measured by AFM. Statistical analysis was performed using an unpaired t-test with Welch’s correction; ns, nonsignificant. (d) Dot plot of the total membrane area of WT and YAP −/– HEK cells. Alexa Fluor 488-labeled wheat germ agglutinin (WGA-488) was used to stain the cells; n > 100. Statistical analysis was performed using an unpaired t-test with Welch’s correction; ns, nonsignificant. (e) Dot plot analysis of the surface area of WT and YAP −/– HEK cells, as calculated on the basis of the total actin coverage of the cells. Alexa Fluor 488-labeled phalloidin (Pha-488, green) was used to stain the cells; n > 100. Statistical analysis was done using an unpaired t-test with Welch’s correction; ns, nonsignificant. (f) Three-dimensional (3D) reconstruction of WT and YAP −/– HEK cells. Cells were stained with 4′,6′-diamidino-2-phenylindole (DAPI) and Pha-488. Scale bars: 10 μm. (g) Representative confocal images depicting YAP expression in WT and YAP −/– HEK cells. Cells were stained for YAP (Alexa Fluor 555, red, top), actin (Pha-488, green, middle), membrane (wheat germ agglutinin–Alexa Fluor 647 conjugate (WGA-647), red, bottom) and nuclei were counterstained with DAPI. Scale bars: 20 μm.
Figure 2
Figure 2
YAP regulates nanoparticle association with HEK 293T cells. (a, b) Representative confocal images of WT (a) and YAP −/– (b) HEK cells after incubation for 4 h with PS200 or PS900. Cells are stained with WGA-488 (green) and/or DAPI (blue). Magnified images of the regions within the red dashed boxes are also shown. Scale bars: 50 and 10 μm for the lower and higher magnification images, respectively. (c) Nanoparticle intensity per cell after incubation of PS200 or PS900 with WT and YAP −/– HEK cells for 4 h. Statistical analysis was performed using one-way analysis of variance (ANOVA) followed by Sidak’s multiple comparison test; n > 100; *p < 0.05; ***p < 0.001. (d) Uptake ratios of PS200 and PS900 in WT or YAP −/– HEK cells after incubation for 4 h. Statistical analysis was done using two-way ANOVA followed by Sidak’s multiple comparison test; n = 6; ***p < 0.001. (e, f) Young’s moduli of WT (e) and YAP −/– (f) HEK cells after incubation for 4 h with PS200 or PS900, as measured by AFM. Statistical analysis was performed using Kruskal–Wallis one-way ANOVA followed by Dunn’s multiple comparisons test; ns, nonsignificant. (f, g) Confocal images of the intracellular localization of PS200 (top) and PS900 (bottom) in HEK WT (f) and YAP −/– (g) cells after 4 h incubation with the nanoparticles. Cells are stained with DAPI (blue) and Lysotracker (red). Nanoparticles are displayed in green. Scale bar: 20 μm.
Figure 3
Figure 3
YAP depletion in HEK cells alters the expression of genes related to membrane organization. (a) Venn diagram showing the overlap between genes significantly downregulated in WT and YAP −/– HEK cells and belonging to the membrane organization network (GO0016020), as obtained by RNA-seq. (b, c) Heatmaps of the relative expression of representative differentially regulated genes associated with the membrane organization network, significantly downregulated (b) or upregulated (c) in YAP −/– HEK cells. n = 3 (Padj <0.05, log2 FC > |1|). (d) STRING PPI network of differentially expressed proteins involved in membrane organization in WT and YAP −/– HEK cells obtained from Cytoscape (Padj <0.05, log2 FC > |1|, confidence cutoff 0.4).
Figure 4
Figure 4
YAP overexpression or restoration in HEK 293T cells decreases their association with nanoparticles. (a) In condition of Hippo pathway activation, MST1/2 (STE20-like protein kinase 1/2) and SAV1 (protein salvador homologue 1) complex activates LATS1/2 (large tumor suppressor homologue 1/2) that, in association with MOB1 (MOB kinase activator 1), phosphorylates YAP and promotes its degradation. Conversely, when the Hippo signaling is inactive, YAP shuttles into the nucleus where it binds to TEADs (TEA domain transcription factor family members) and regulates the transcription of genes involved in cell proliferation, migration, and survival. TAOK, serine/threonine-protein kinase TAO1; β-TrCP, β-transducin repeat-containing proteins; TAZ, transcriptional coactivator with PDZ-binding motif. (b) Schematic representation of the constitutively active translocation of mutant YAP S6A to the cell nucleus. Owing to the substitutions of serine residues with alanine residues in different positions (S61A, S109A, S127A, S128A, S131A, S136A, S164A, and S381A), YAP-S6A cannot be phosphorylated by upstream kinases, mainly belonging to the Hippo pathway (LATS1/2 kinases and scaffolding protein MOB1). Created with Biorender.com. (c) Representative confocal images of WT and WT HEK cells transfected with YAP S6A (WT-YAP S6A). Cells were decorated with DAPI (blue) and YAP (red). Scale bars: 50 μm. (d) Western blot analysis of the levels of YAP protein in WT HEK cells and WT-YAP S6A cells. Glyceraldehyde 3-phosphate dehydrogenase (GAPDH) was used for protein loading normalization. (e) Uptake ratios of PS200 and PS900 by WT HEK or WT-YAP S6A cells after incubation for 4 h. Statistical analysis was done using two-way ANOVA followed by Sidak’s multiple comparison test; n = 6; ***p < 0.001. (f) Confocal images of YAP −/– HEK (KO) cells and YAP −/– HEK cells transfected with YAP S6A (KO-YAP S6A). Scale bars: 50 and 10 μm in the lower and higher magnification images, respectively. (g) RT-qPCR analysis of YAP1, CYR61, and CTGF in KO and KO-YAP S6A cells. Statistical analysis was done using multiple t-test; n = 3; ***p < 0.001. (h) Uptake ratios of PS200 and PS900 in KO or KO-YAP S6A (red) cells. Statistical analysis was performed using two-way ANOVA followed by Sidak’s multiple comparison test; n = 3; ***p < 0.001.
Figure 5
Figure 5
Suppression of the Hippo pathway with MST1/2 inhibitor XMU-MP1 in HEK 293T cells increases YAP activity and reduces cell–nanoparticle interactions. (a) Schematic representation of the effect of XMU-MP1 treatment. The drug inhibits the Hippo pathway by blocking the activity of upstream kinase MST1/2, thus suppressing the degradation of YAP and promoting its shuttling into the nucleus. Created with Biorender.com (b) Western blot showing the levels of MST1 and p-MOB1 in untreated HEK 293T cells (CTRL) or HEK 293T cells treated for 4 or 8 h with the 6 μM XMU-MP1 inhibitor. GAPDH was used for protein loading normalization. (c) Scheme of the reporter construct used in this study, as described by Maruyama et al. FLAG-His 6-YAP1 (FH-YAP1) gene is followed by IRESs and GFP gene is cloned under a CMV promoter. Histone 2B-mCherry (H2B-mCherry) gene is regulated under the TEAD-responsive element. (d) Schematic showing that treatment with XMU-MP1 increases the H2B-mCherry signal, as the YAP-mediated TEAD transcriptional activity is promoted owing to inhibition of the activity of upstream kinase MST1/2 of the Hippo pathway. (e) (Top) Violin plot of the GFP signal intensity in HEK 293T cells treated with increasing concentrations of XMU-MP1 for 8 h. (Bottom) Violin plot of the signal intensity of H2B-mCherry in HEK 293T cells treated with increasing concentrations of XMU-MP1 for 8 h. Statistical analysis was performed using one-way ANOVA followed by Tukey’s multiple comparison test; n > 200 cells; ns, nonsignificant; **p < 0.01; ***p < 0.001. (f) Representative confocal images of untreated WT HEK cells (CTRL) and WT HEK cells treated with 6 μM XMU-MP1 for 8 h. The green signal comes from GFP coexpressed with YAP, whereas the red signal comes from the YAP-TEAD-mediated gene transcription (mCherry). Cells are stained postfixation with DAPI (blue). Scale bars: 100 μm. (g) Representative confocal images of untreated HEK 293T cells (CTRL) and HEK 293T cells treated with 6 μM XMU-MP1 for 8 h. Cells are stained with DAPI (blue) and for YAP (Alexa Fluor 555, red). The magnified images show single untreated and treated cells with the nuclei delimited by the white dashed lines. Scale bars: 100 and 10 μm for the low and high magnification images, respectively. (h) Uptake ratios of PS200 and PS900 in untreated HEK 293T cells (CTRL) or HEK 293T cells treated with 6 μM XMU-MP1 for 8 h and incubated with the particles for 4 h (after 4 h of treatment with the inhibitor). Statistical analysis was performed using two-way ANOVA followed by Sidak’s multiple comparison test; n = 6; ***p < 0.001.

References

    1. Wilhelm S.; Tavares A. J.; Dai Q.; Ohta S.; Audet J.; Dvorak H. F.; Chan W. C. W. Analysis of nanoparticle delivery to tumours. Nat. Rev. Mater. 2016, 1 (5), 16014.10.1038/natrevmats.2016.14. - DOI
    1. van der Meel R.; Sulheim E.; Shi Y.; Kiessling F.; Mulder W. J. M.; Lammers T. Smart cancer nanomedicine. Nat. Nanotechnol. 2019, 14 (11), 1007–1017. 10.1038/s41565-019-0567-y. - DOI - PMC - PubMed
    1. Fernandes S.; Cassani M.; Pagliari S.; Filipensky P.; Cavalieri F.; Forte G. Tumor in 3D: In Vitro Complex Cellular Models to Improve Nanodrugs Cancer Therapy. Curr. Med. Chem. 2020, 27 (42), 7234–7255. 10.2174/0929867327666200625151134. - DOI - PubMed
    1. Fernandes S.; Cassani M.; Cavalieri F.; Forte G.; Caruso F. Emerging Strategies for Immunotherapy of Solid Tumors Using Lipid-Based Nanoparticles. Adv. Sci. 2024, 11 (8), 2305769.10.1002/advs.202305769. - DOI - PMC - PubMed
    1. Gratton S. E.; Ropp P. A.; Pohlhaus P. D.; Luft J. C.; Madden V. J.; Napier M. E.; DeSimone J. M. The effect of particle design on cellular internalization pathways. Proc. Natl. Acad. Sci. U.S.A. 2008, 105 (33), 11613–8. 10.1073/pnas.0801763105. - DOI - PMC - PubMed

Publication types

MeSH terms

Substances

LinkOut - more resources