. 2025 Jan 10;11(2):eads6660.
doi: 10.1126/sciadv.ads6660. Epub 2025 Jan 8.

Differential encoding of mammalian proprioception by voltage-gated sodium channels

Affiliations

Differential encoding of mammalian proprioception by voltage-gated sodium channels

Cyrrus M Espino et al. Sci Adv. .

Abstract

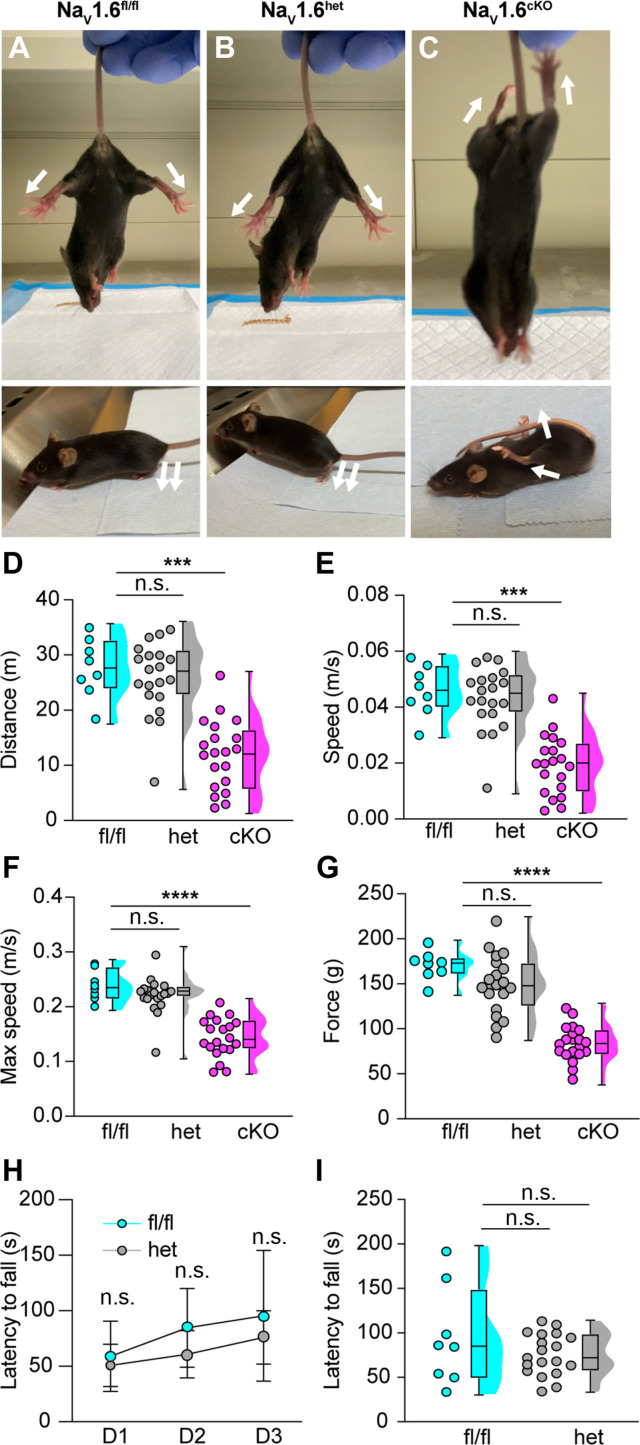
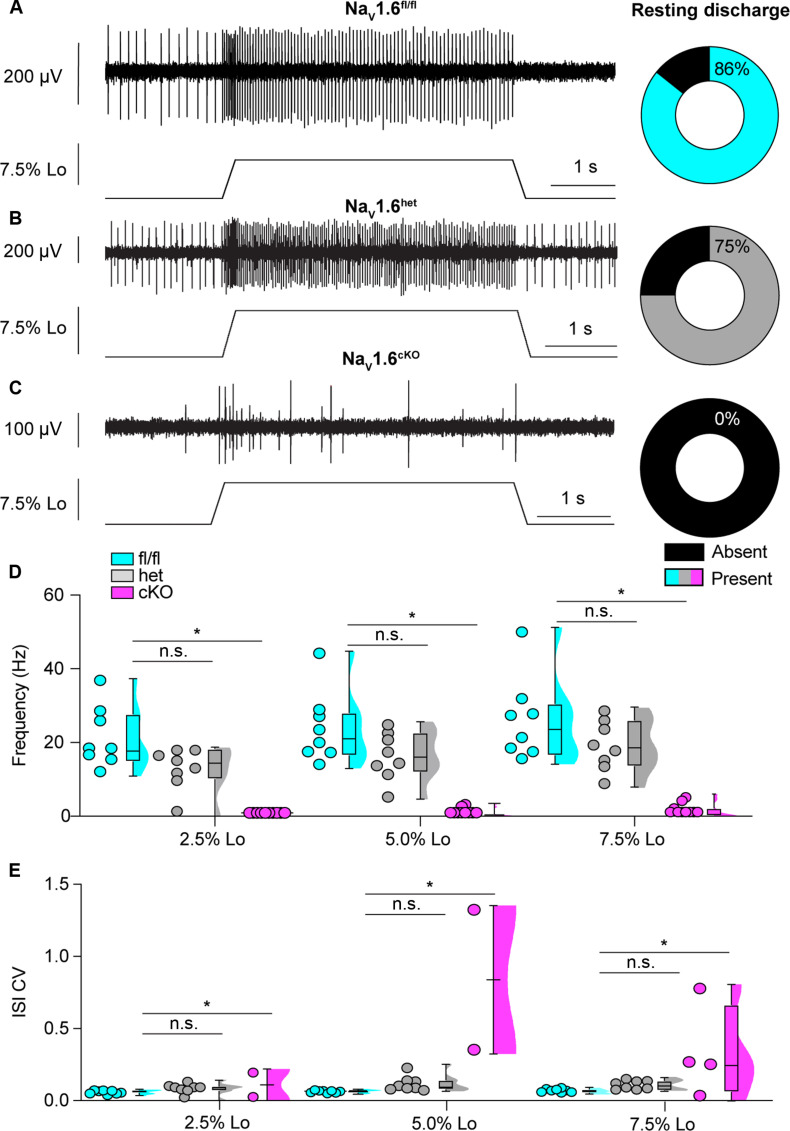
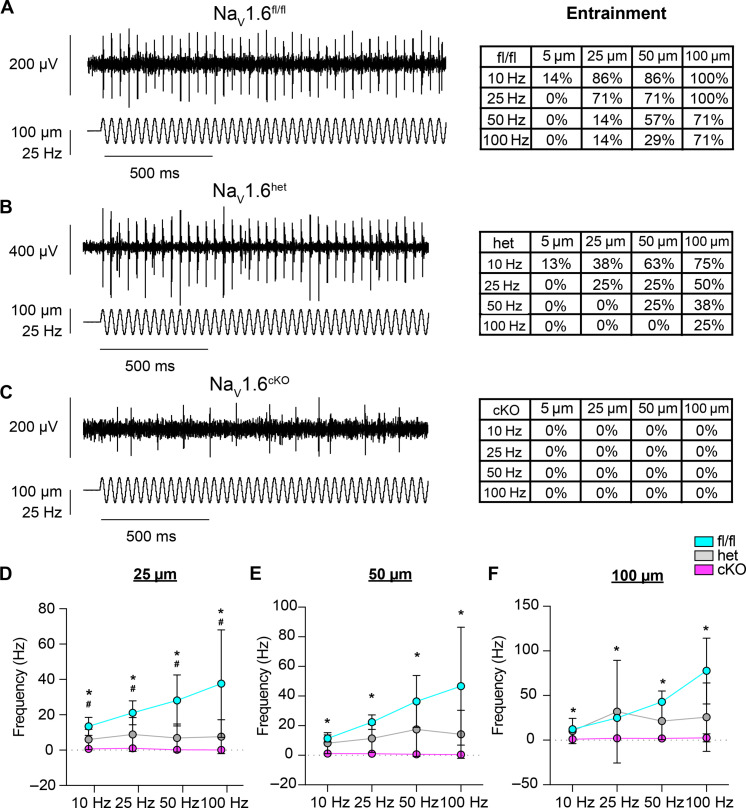
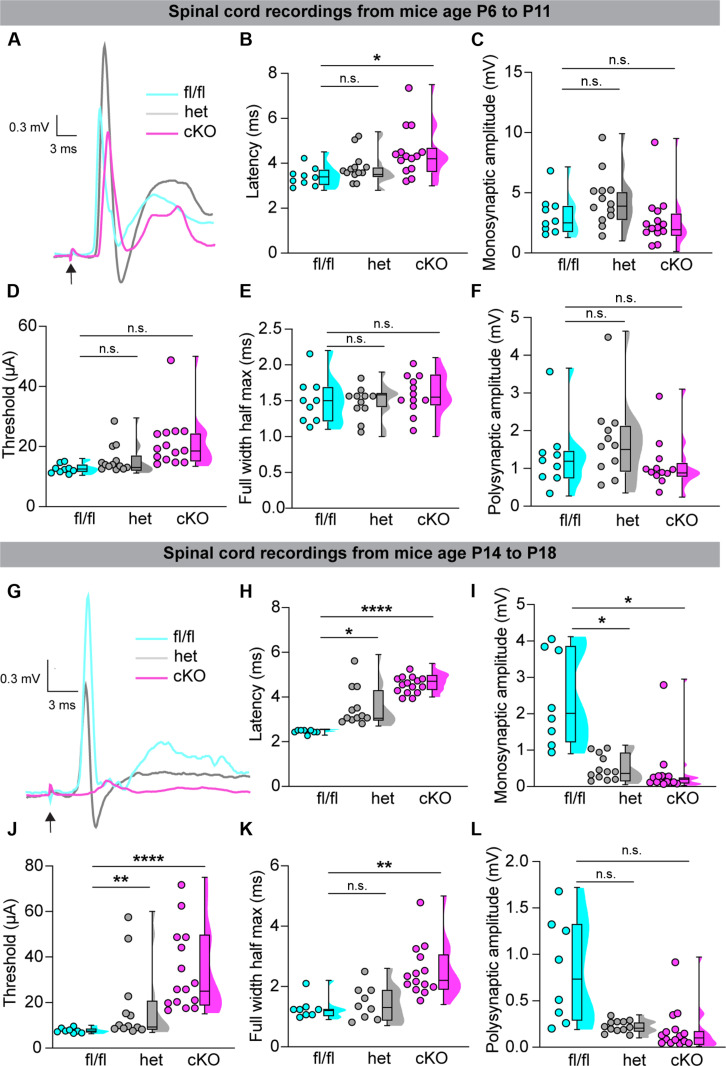
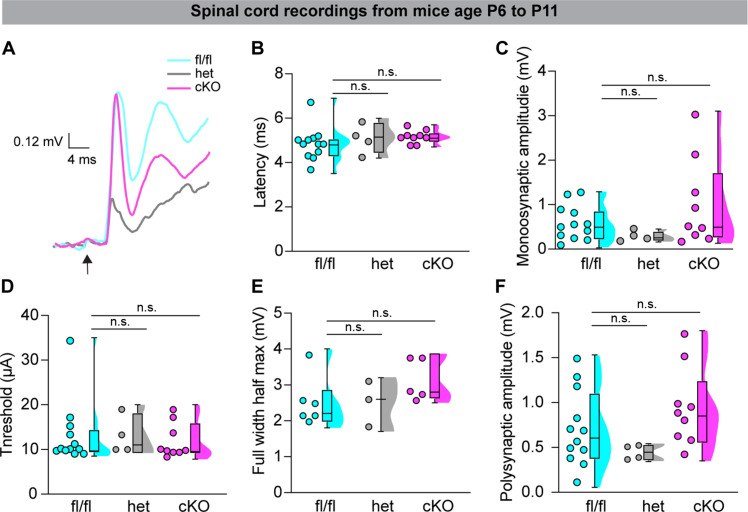
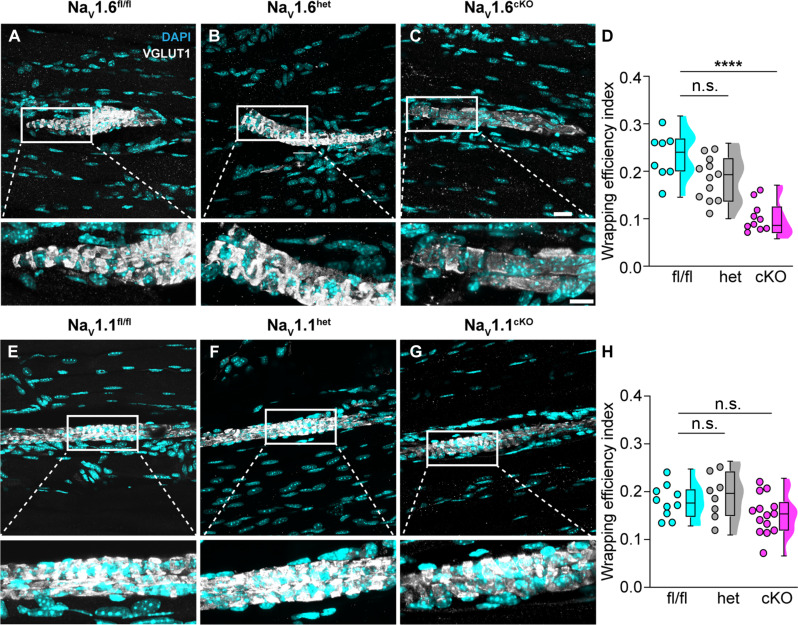
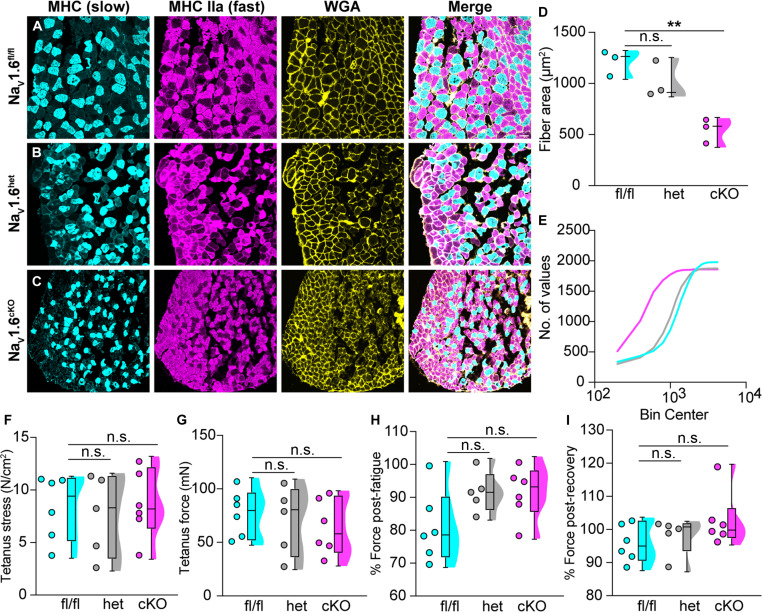
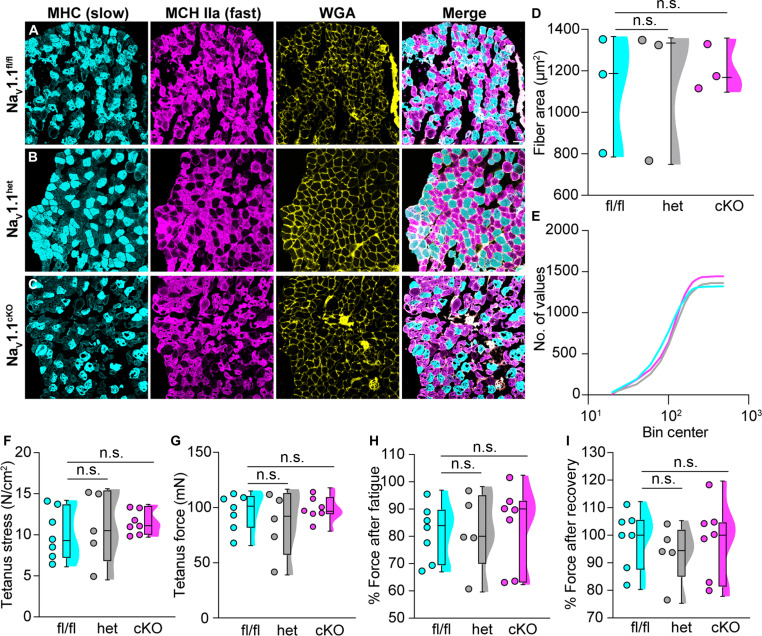
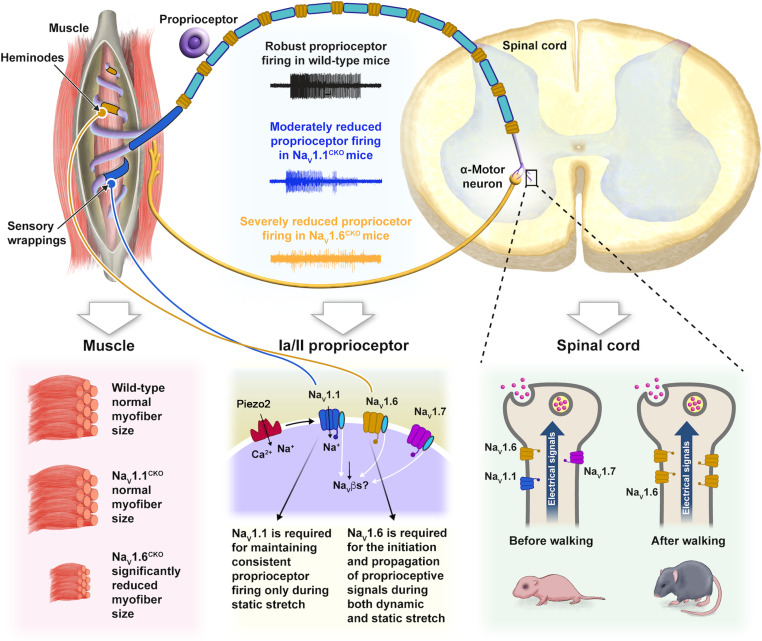
Animals requiring purposeful movement for survival are endowed with mechanoreceptors, called proprioceptors, that provide essential sensory feedback from muscles and joints to spinal cord circuits, which modulates motor output. Despite the essential nature of proprioceptive signaling in daily life, the mechanisms governing proprioceptor activity are poorly understood. Here, we identified nonredundant roles for two voltage-gated sodium channels (NaVs), NaV1.1 and NaV1.6, in mammalian proprioception. Deletion of NaV1.6 in somatosensory neurons (NaV1.6cKO mice) causes severe motor deficits accompanied by loss of proprioceptive transmission, which contrasts with our previous findings using similar mouse models to target NaV1.1 (NaV1.1cKO). In NaV1.6cKO animals, we observed impairments in proprioceptor end-organ structure and a marked reduction in skeletal muscle myofiber size that were absent in NaV1.1cKO mice. We attribute the differential contributions of NaV1.1 and NaV1.6 to distinct cellular localization patterns. Collectively, we provide evidence that NaVs uniquely shape neural signaling within a somatosensory modality.


Figures

Fig. 1.
Fig. 1.. NaV1.6 is required for somatosensory neuron–driven motor behaviors and function.
Representative images showing limb position of adult NaV1.6fl/fl (A), NaV1.6het (B), and NaV1.6cKO (C) mice suspended from the tail (above) and on flat surface (below). White arrows indicate the direction of hindlimbs. Quantification of distance traveled [(D), NaV1.6het (P > 0.999) and NaV1.6cKO (P = 0.0003) compared to NaV1.6fl/fl], average speed [(E), NaV1.6het (P > 0.999) and NaV1.6cKO (P = 0.0003)], and the maximum speed [(F), NaV1.6het (P > 0.999) and NaV1.6cKO (P > 0.0001) compared to NaV1.6fl/fl] for NaV1.6fl/fl (cyan), NaV1.6het (gray), and NaV1.6cKO (magenta) mice as measured in the open-field assay for a 10-min testing period. (G) Average grip force in grams measured across six consecutive trials; NaV1.6het (P = 0.4947) and NaV1.6cKO (P < 0.0001) compared to NaV1.6fl/fl. (H) Average latency to fall from the rotarod across three consecutive training days. No statistically significant genotype-dependent difference was observed (P = 0.1342). (I) Average latency to fall on third day of testing [NaV1.6het (P = 0.3943) compared to NaV1.6fl/fl]. Each dot represents one animal, except in (H) were each dot represents the mean across animals. Box and whisker plots represent maximum, minimum, median, and upper and lower quartiles of datasets. A Kruskal-Wallis test with Dunn’s multiple comparisons [(D) to (G)], a two-way analysis of variance (ANOVA) with Šidák’s multiple comparisons (H), and a Welch’s T test (I) were used to determine statistical significance. NaV1.6fl/fl, N = 8; NaV1.6het, N = 20; and NaV1.6cKO, N = 20. n.s., not significant.
Fig. 2.
Fig. 2.. Loss of NaV1.6 abolishes muscle proprioceptor static stretch sensitivity.
Representative responses to ramp-and-hold muscle stretch at 7.5% of optimal length (Lo) in NaV1.6fl/fl (A), NaV1.6het (B), and NaV1.6cKO (C) muscle proprioceptors. The percentage of afferents that displayed resting discharge at Lo are represented by the pie charts to the right (black indicates absence of resting discharge). (D) Quantification of afferent firing frequency 3.25 to 3.75 s into stretch protocol. NaV1.6fl/fl (cyan), NaV1.6het (gray), and NaV1.6cKO (magenta). NaV1.6het (P = 0.178) and NaV1.6cKO (P = 0.001) compared to NaV1.6fl/fl. (E) Firing regularity was quantified as the coefficient of variation of the interspike interval (ISI CV) of 1.5 to 3.5 s into the stretch protocol. NaV1.6het (P = 0.669) and NaV1.6cKO (P = 0.000) compared to NaV1.6fl/fl. In 6 of the 10 animals, we observed no response to stretch and therefore could only include the quantifiable responses from four afferents from NaV1.6cKO mice. Only quantifiable responses were included in statistical analyses in (D) and (E). Box and whisker plots represent maximum, minimum, median, and upper and lower quartiles of datasets. Each dot represents a single afferent. A two-way mixed-design ANOVA (Dunnett’s post hoc comparison) was used to determine statistical significance in (D) and (E). NaV1.6fl/fl, n = 8 and N = 7; NaV1.6het, n = 8 and N = 8; and NaV1.6cKO, n = 4 and N = 10. n = afferents and N = mice.
Fig. 3.
Fig. 3.. NaV1.6 is required for proprioceptor responses to vibration.
Representative traces from NaV1.6fl/fl (A), NaV1.6het (B), and NaV1.6cKO (C) afferents that were able to entrain to a 25-Hz, 100-μm amplitude vibration stimulus. Tables to the right indicate the percentage of afferents that were able to entrain across stimulus frequencies and amplitudes (NaV1.6fl/fl, top; NaV1.6het, middle; and NaV1.6cKO, bottom). (D to F) Quantification of firing frequency across vibration amplitudes. At 25 μm (D), NaV1.6het (P = 0.005) (# denotes significance in NaV1.6het) and NaV1.6cKO (P = 0.001) compared to NaV1.6fl/fl (* denotes significance in NaV1.6cKO). At 50 μm (E), NaV1.6het (P = 0.053) and NaV1.6cKO (P = 0.002) compared to NaV1.6fl/fl. At 100 μm (F), NaV1.6het (P = 0.414) and NaV1.6cKO (P = 0.018) compared to NaV1.6fl/fl. NaV1.6fl/fl (cyan), NaV1.6het (gray), and NaV1.6cKO (magenta). A two-way mixed-design ANOVA (Dunnett’s post hoc comparison) was used to determine statistical in (D) to (F). Box and whisker plots represent maximum, minimum, median, and upper and lower quartiles of datasets. Each dot represents the average afferent response per genotype. NaV1.6fl/fl, n = 8 and N = 7; NaV1.6het, n = 8 and N = 8; and NaV1.6cKO, n = 4 and N = 10. n = afferents and N = mice.
Fig. 4.
Fig. 4.. NaV1.6 plays a developmentally dependent role in proprioceptor synaptic transmission in the spinal cord.
(A) Representative monosynaptic reflex responses from NaV1.6fl/fl (cyan), NaV1.6het (gray), and NaV1.6cKO (magenta) hemicords during P6 to P11. Quantification of response properties. (B) Response latency, NaV1.6het (P = 0.760) and NaV1.6cKO (P = 0.019) compared to NaV1.6fl/fl. (C) Monosynaptic response amplitude, NaV1.6het (P = 0.238) and NaV1.6cKO (P = 0.640) compared to NaV1.6fl/fl. (D) Stimulus threshold, NaV1.6het (P = 0.910) and NaV1.6cKO (P = 0.271) compared to NaV1.6fl/fl. (E) Full width half maximum, NaV1.6het (P = 0.999) and NaV1.6cKO (P = 0.929) compared to NaV1.6fl/fl. (F) Polysynaptic response amplitude, NaV1.6het (P = 0.514) and NaV1.6cKO (P = 0.704) compared to NaV1.6fl/fl. (G) Representative monosynaptic reflex responses in NaV1.6fl/fl (cyan), NaV1.6het (gray), and NaV1.6cKO (magenta) hemicords during P14 to P18. (H) Response latency, NaV1.6het (P = 0.023) and NaV1.6cKO (P < 0.0001) compared to NaV1.6fl/fl. (I) Monosynaptic response amplitude, NaV1.6het (P = 0.037) and NaV1.6cKO (P = 0.018) compared to NaV1.6fl/fl. (J) Stimulus threshold, NaV1.6het (P = 0.164) and NaV1.6cKO (P < 0.0001) compared to NaV1.6fl/fl. (K) Full width half maximum, NaV1.6het (P = 0.784) and NaV1.6cKO (P < 0.0001) compared to NaV1.6fl/fl. (L) Polysynaptic response amplitude, NaV1.6het (P = 0.143) and NaV1.6cKO (P = 0.092) compared to NaV1.6fl/fl. Each dot represents a single hemicord. [(A) to (F)] NaV1.6fl/fl, n = 9; NaV1.6het, n = 13; and NaV1.6cKO, n = 14. [(G) to (L)] NaV1.6fl/fl, n = 8; NaV1.6het, n = 12; and NaV1.6cKO, n = 15. N = 8 to 15. n = hemicords and N = mice. Box and whisker plots represent maximum, minimum, median, and upper and lower quartiles of datasets. A two-way mixed-design ANOVA (Tukey’s post hoc comparison) was used to determine statistical significance.
Fig. 5.
Fig. 5.. NaV1.1 does not contribute to proprioceptor synaptic transmission before the onset of walking behaviors.
(A) Representative monosynaptic reflex responses from NaV1.1fl/fl (cyan), NaV1.1het (gray), and NaV1.1cKO (magenta) hemicords recorded during P6 to P11. (B to D) Quantification of monosynaptic response properties. (B) Response latency, NaV1.1het (P = 0.723) and NaV1.1cKO (P = 0.238) compared to NaV1.1fl/fl. (C) Monosynaptic response amplitude, NaV1.1het (P = 0.378) and NaV1.1cKO (P > 0.999) compared to NaV1.1fl/fl. (D) Stimulus threshold, NaV1.1het (P > 0.999) and NaV1.1cKO (P > 0.999) compared to NaV1.1fl/fl. (E) Full width half maximum, NaV1.1het (P > 0.999) and NaV1.1cKO (P = 0.255) compared to NaV1.1fl/fl. (F) Polysynaptic response amplitude, NaV1.1het (P = 0.574) and NaV1.1cKO (P = 0.473) compared to NaV1.1fl/fl. Each dot represents a single hemicord. NaV1.1fl/fl, n = 12; NaV1.1het, n = 4; and NaV1.1cKO, n = 9. N = 4 to 10 mice. Box and whisker plots represent maximum, minimum, median, and upper and lower quartiles of datasets. A Kruskal-Wallis test with Dunn’s multiple comparisons was used to determine statistical significance.
Fig. 6.
Fig. 6.. Loss of NaV1.6, but not NaV1.1, in somatosensory neurons impairs muscle spindle development.
Representative confocal images of muscle spindles from (A) NaV1.6fl/fl, (B) NaV1.6het, and (C) NaV1.6cKO extensor digitorum longus (EDL) muscle sections (30 μm). Images were acquired with a 60× oil 1.4 numerical aperture (NA) lens. VGLUT1 (gray scale) labels proprioceptor sensory terminals, and 4′,6-diamidino-2-phenylindole (DAPI; cyan) labels nuclei. Insets below images show the colocalization of sensory terminals with DAPI. (D) Quantification of wrapping efficiency index (WEI) based on colocalization of DAPI with VGLUT1. NaV1.6het (P = 0.0658) and NaV1.6cKO (P < 0.0001) compared to NaV1.6fl/fl. Representative images of muscle spindles from (E) NaV1.1fl/fl, (F) NaV1.1het, and (G) NaV1.1cKO. (H) Quantification of WEI based on colocalization of DAPI with VGLUT1. NaV1.1het (P = 0.762) and NaV1.1cKO (P = 0.282) compared to NaV1.1fl/fl. Each dot represents a single muscle spindle section. (D) NaV1.6fl/fl, n = 8; NaV1.6het, n = 12; and NaV1.6cKO, n = 10. (H) NaV1.1fl/fl, n = 10; NaV1.1het, n = 8; and NaV1.1cKO, n = 14. N = 3 mice per genotype. Box and whisker plots represent maximum, minimum, median, and upper and lower quartiles of datasets. A one-way ANOVA (Dunnett’s post hoc comparison) was used to determine statistical significance. Scale bar, 20 μm. Inset scale bar, 10 μm.
Fig. 7.
Fig. 7.. Loss of proprioceptive feedback alters skeletal muscle development in NaV1.6cKO mice.
Representative images of muscle fibers from the soleus of (A) NaV1.6fl/fl, (B) NaV1.6het, and (C) NaV1.6cKO mice. Images were acquired with a 20× 0.75 NA air lens. Myosin heavy chain (MHC) labels slow twitch muscle fibers (cyan), MHC type IIa labels fast twitch muscle fibers (magenta), and wheat germ agglutinin (WGA; yellow) labels the cell membrane of muscle fibers. (D and E) Quantification of muscle fiber anatomy. (D) Fiber area, NaV1.6het (P = 0.337) and NaV1.6cKO (P = 0.006) compared to NaV1.6fl/fl. (E) cumulative distribution plots showing the muscle fiber area in the soleus between NaV1.6fl/fl (cyan), NaV1.6het (gray), and NaV1.6cKO (magenta) mice. (F to I) Quantification of intrinsic properties of soleus muscle. (F) Tetanus stress, NaV1.6het (P = 0.926) and NaV1.6cKO (P = 0.990) compared to NaV1.6fl/fl. (G) Tetanus force, NaV1.6het (P = 0.925) and NaV1.6cKO (P = 0.690) compared to NaV1.6fl/fl. (H) Percentage of force after fatigue, NaV1.6het (P = 0.189) and NaV1.6cKO (P = 0.150) compared to NaV1.6fl/fl. (I) Percentage of force after recovery, NaV1.6het (P = 0.851) and NaV1.6cKO (P = 0.293) compared to NaV1.6fl/fl. Each dot represents a single animal. Box and whisker plots represent maximum, minimum, median, and upper and lower quartiles of datasets. A one-way ANOVA (Dunnett’s post hoc comparison) was used to determine statistical significance. Scale bar, 50 μm.
Fig. 8.
Fig. 8.. Mildly impaired proprioceptive feedback does not impair skeletal muscle development.
Images of muscle fibers from (A) NaV1.1fl/fl, (B) NaV1.1het, and (C) NaV1.6cKO soleus muscle. Images were acquired with a 20× 0.75 NA air lens. MHC labels slow twitch muscle fibers (cyan), MHC type IIa labels fast twitch muscle fibers (magenta), and WGA (yellow) labels the cell membrane of muscle fibers. (D and E) Quantification of muscle fiber anatomy. (D) Fiber area, NaV1.1het (P = 0.9827) and NaV1.1cKO (P = 0.880) compared to NaV1.1fl/fl. (E) cumulative distribution plots showing the muscle fiber area between NaV1.1fl/fl (cyan), NaV1.1het (gray), and NaV1.1cKO (magenta). (F to I) Quantification of intrinsic properties of soleus muscle. (F) Tetanus stress, NaV1.1het (P = 0.841) and NaV1.1cKO (P = 0.596) compared to NaV1.1fl/fl. (G) Tetanus force, NaV1.1het (P = 0.624) and NaV1.1cKO (P = 0.978) compared to NaV1.1fl/fl. (H) Percentage of force after fatigue, NaV1.1het (P = 0.999) and NaV1.1cKO (P = 0.934) compared to NaV1.1fl/fl. (I) Percentage of force after recovery, NaV1.1het (P = 0.724) and NaV1.1cKO (P = 0.993) compared to NaV1.1fl/fl. Each dot represents a single animal. Box and whisker plots represent maximum, minimum, median, and upper and lower quartiles of datasets. A one-way ANOVA (Dunnett’s post hoc comparison) was used to determine statistical significance. Scale bar, 50 μm.
Fig. 9.
Fig. 9.. NaV1.1 and NaV1.6 localize to discrete cellular regions in muscle spindles.
VGLUT1 [magenta, (A)] labeled muscle spindles express clusters of NaV1.6 [cyan, (B and C)]. Arrows denote clusters of NaV1.6. (D) Quantification of the number of NaV1.6 clusters per muscle spindle (n = 15 spindles). WT, wild type; MS, muscle spindle. (E to H) NaV1.6 clusters (G) colocalize with Ankyrin-G [AnkG; yellow; (E) and (F) are insets from (G)]. (H) Quantification of the percentage of AnkG clusters that colocalize with NaV1.6 clusters (n = 9 spindles). (I to M) Co-labeling of NaV1.6 (J) with juxtaparanode maker CASPR [(K), yellow] reveal proprioceptor nodes of Ranvier (L) and heminodes (M) (n = 10 spindles). Nodes of Ranvier were identified by two CASPR+ signals (arrows) flanking NaV1.6 clusters (arrowheads). Heminodes were identified by a single CASPR+ signals juxtaposed to NaV1.6 cluster. (N to S) Co-labeling of NaV1.6 (O) with NaV1.1 [(P), yellow] shows discrete cellular expression patterns. [(Q) to (S)] Arrowheads denote NaV1.6 channels, and arrows denote NaV1.1 channels. N = 3 to 5 mice. Inset scale bars, 10 μm. Scale bars, 20 μm
Fig. 10.
Fig. 10.. Model of proprioceptive transmission by NaV1.1 and NaV1.6.
Upon muscle stretch, Piezo2 (red) transduces mechanical stimuli into electrical potentials. NaV1.1 (blue) expressed in muscle spindle sensory terminals integrates and amplifies Piezo2 signals to drive consistent proprioceptor firing during static muscle stretch. NaV1.6 (yellow) localized to heminodes and nodes of Ranvier where it initiates and propagates proprioceptive signals from muscle spindles to the spinal cord. It is likely that before weight-bearing locomotion, there is functional redundancy of NaVs in proprioceptive axons. After walking behaviors emerge, however, proprioceptive synaptic transmission is dependent on NaV1.6. Deletion of NaV1.6 in all sensory neurons led to a significant decrease in skeletal muscle fiber size that was not present in NaV1.1cKO muscle, suggesting that complete loss of proprioceptive feedback non–cell-autonomously regulates skeletal muscle development.

Update of

Similar articles

Cited by

References

    1. Proske U., Gandevia S. C., The proprioceptive senses: Their roles in signaling body shape, body position and movement, and muscle force. Physiol. Rev. 92, 1651–1697 (2012). - PubMed
    1. Tuthill J. C., Azim E., Proprioception. Curr. Biol. 28, R194–R203 (2018). - PubMed
    1. Wilkinson K. A., Molecular determinants of mechanosensation in the muscle spindle. Curr. Opin. Neurobiol. 74, 102542 (2022). - PMC - PubMed
    1. Florez-Paz D., Bali K. K., Kuner R., Gomis A., A critical role for Piezo2 channels in the mechanotransduction of mouse proprioceptive neurons. Sci. Rep. 6, 25923 (2016). - PMC - PubMed
    1. Woo S.-H., Lukacs V., de Nooij J. C., Zaytseva D., Criddle C. R., Francisco A., Jessell T. M., Wilkinson K. A., Patapoutian A., Piezo2 is the principal mechanotransduction channel for proprioception. Nat. Neurosci. 18, 1756–1762 (2015). - PMC - PubMed

MeSH terms

Substances