. 2025 Jan 10;11(2):eado6705.
doi: 10.1126/sciadv.ado6705. Epub 2025 Jan 8.

Subthreshold repetitive transcranial magnetic stimulation induces cortical layer-, brain region-, and protocol-dependent neural plasticity

Affiliations

Subthreshold repetitive transcranial magnetic stimulation induces cortical layer-, brain region-, and protocol-dependent neural plasticity

Rebecca C S Ong et al. Sci Adv. .

Abstract

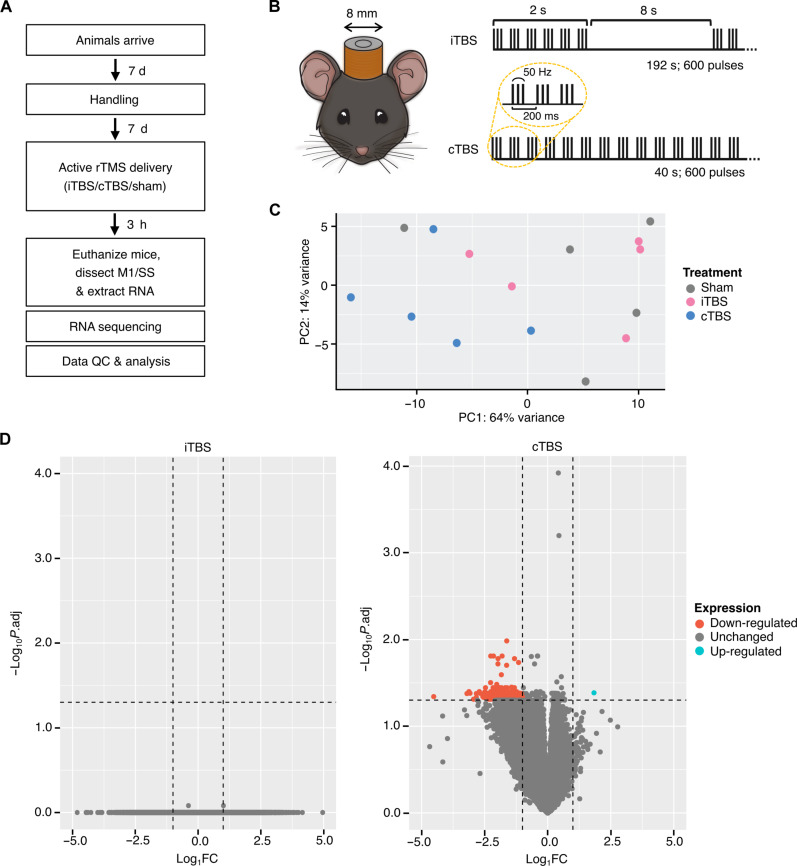
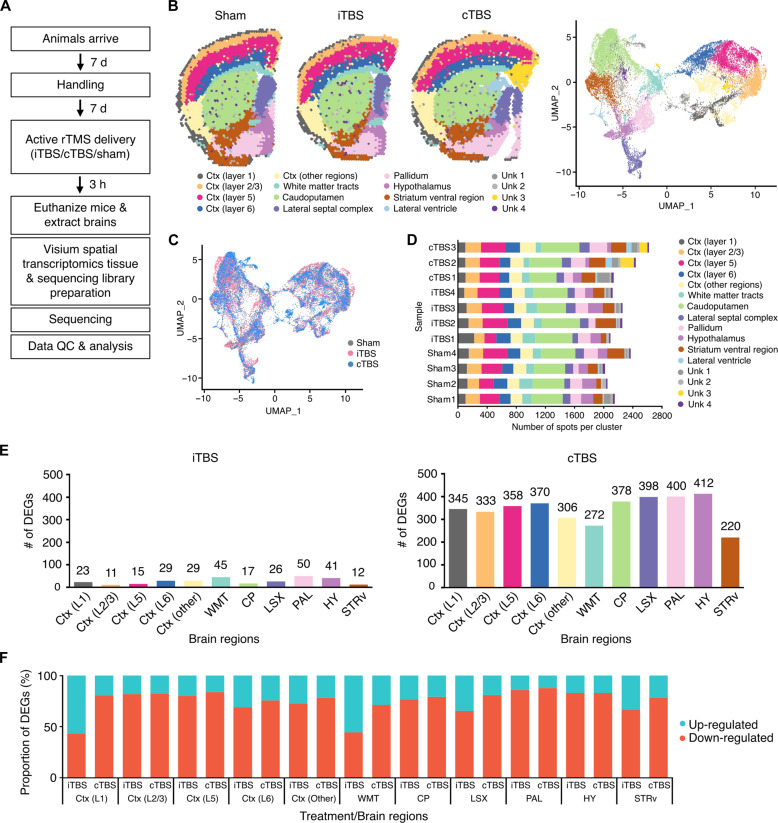
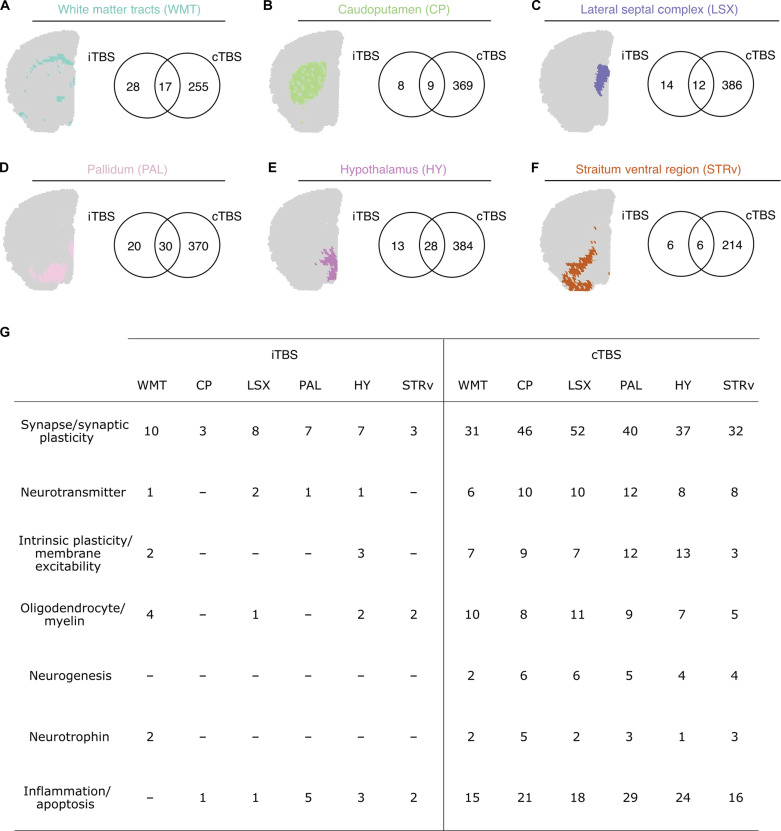
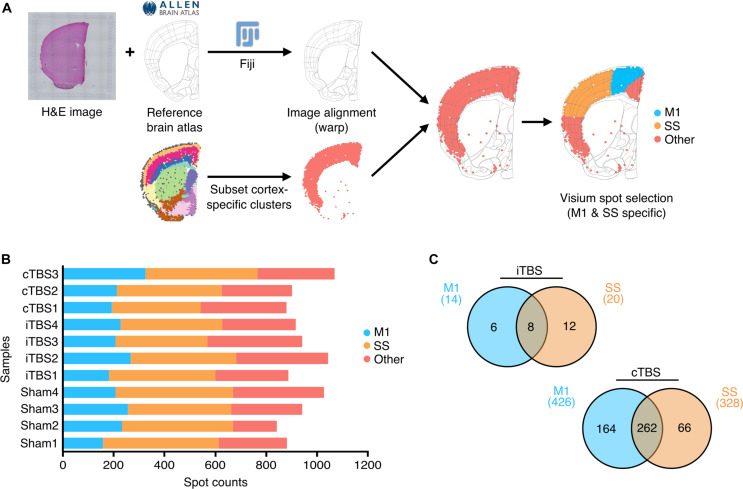
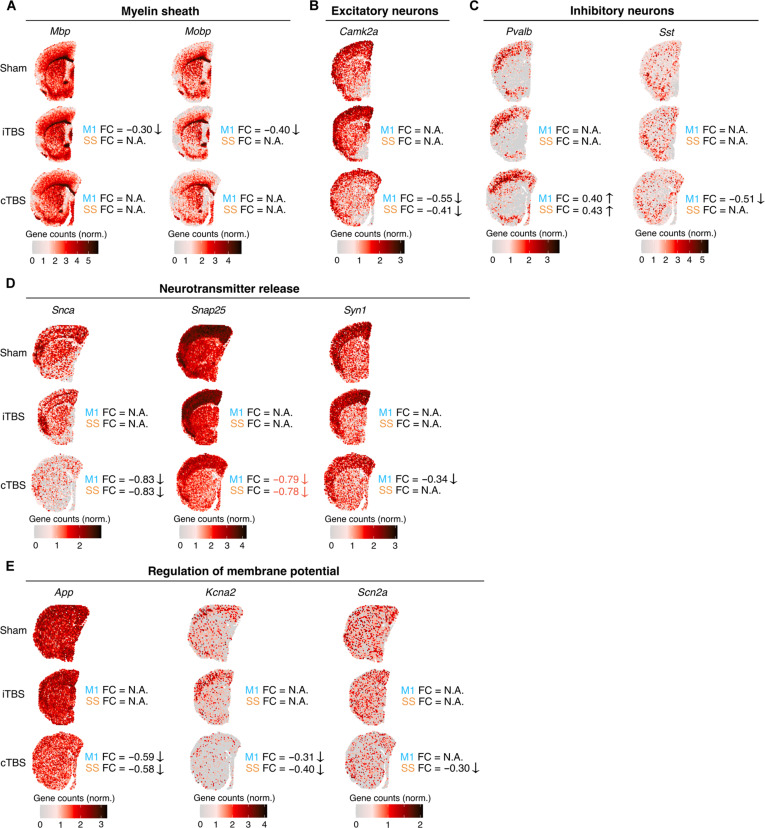
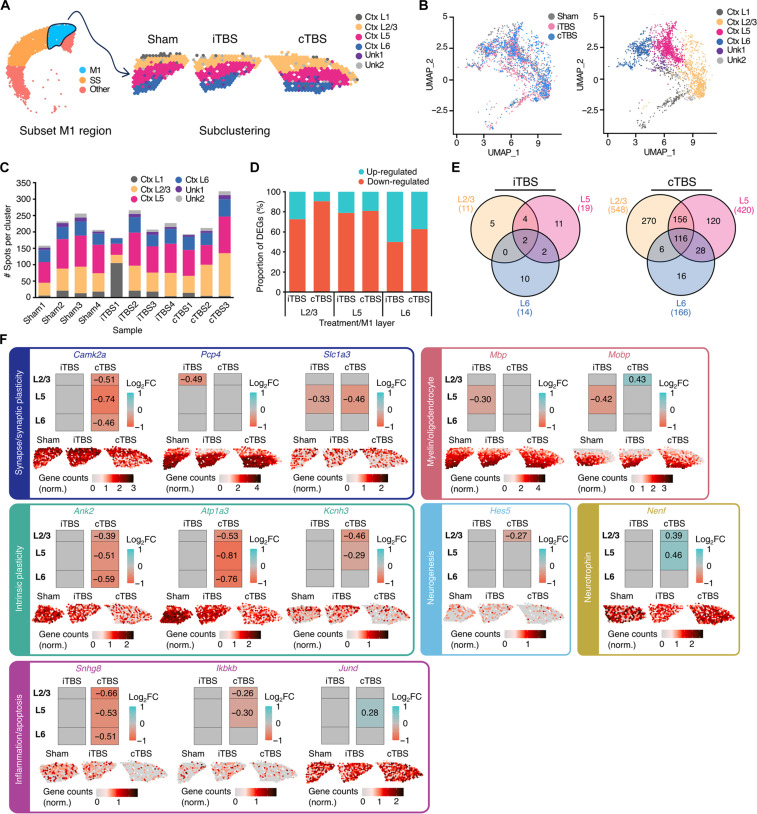
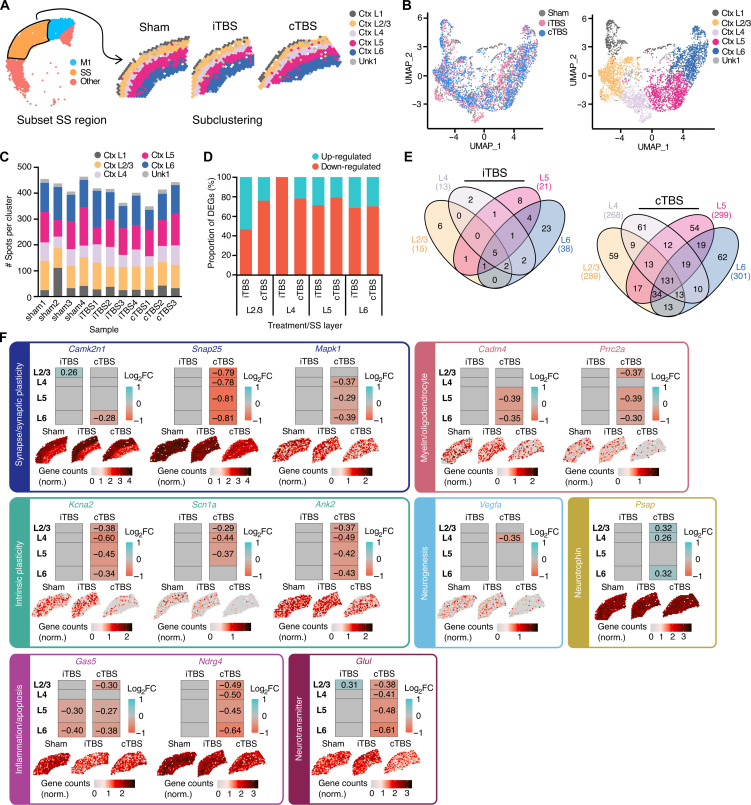
Repetitive transcranial magnetic stimulation (rTMS) is commonly used to study the brain or as a treatment for neurological disorders, but the neural circuits and molecular mechanisms it affects remain unclear. To determine the molecular mechanisms of rTMS and the brain regions they occur in, we used spatial transcriptomics to map changes to gene expression across the mouse brain in response to two commonly used rTMS protocols. Our results revealed that rTMS alters the expression of genes related to several cellular processes and neural plasticity mechanisms across the brain, which was both brain region- and rTMS protocol-dependent. In the cortex, the effect of rTMS was dependent not only on the cortical region but also on each cortical layer. These findings uncover the diverse molecular mechanisms induced by rTMS, which will be useful in interpreting its effects on cortical and subcortical circuits.


Figures

Fig. 1.
Fig. 1.. Bulk RNA-seq indicates differences in the regulation of gene expression between iTBS and cTBS in the mouse cortex.
(A) Experimental workflow for bulk RNA-seq of mice treated with iTBS (n = 5), cTBS (n = 5), or sham stimulation (n = 5). d, days; h, hours. (B) Schematic of the rTMS mouse model and stimulation protocols used. (C) Two-dimensional PCA plot reveals no distinct clustering between stimulation groups. (D) Volcano plots of DEGs show no effect of iTBS on gene expression in the cortex, whereas cTBS largely down-regulated the expression of cortical genes. After identifying DEGs, the Wald test was used to generate P values that were adjusted for multiple comparisons through the Benjamini-Hochberg false discovery rate correction.
Fig. 2.
Fig. 2.. Brain regions resolved using unsupervised clustering analysis of spatial transcriptomics data from iTBS, cTBS, and sham-stimulated mice.
(A) Overview of the spatial transcriptomics workflow performed on mice that received iTBS (n = 4), cTBS (n = 3), or sham stimulation (n = 4). (B) Representative plots of spatial transcriptomics data from each treatment group, colored based on the clusters identified by unsupervised clustering analysis. Clusters were manually annotated based on their anatomical location using the Allen Mouse Brain Atlas as a reference. Distinct transcriptome profiles can be seen between cortical and subcortical clusters, as visualized on a Uniform Manifold Approximation and Projection (UMAP) plot. (C) UMAP plots of treatment groups following correction for any batch effects between samples. (D) Number of spots corresponding to each cluster display little variation between samples. (E) Number of genes that had a significant change in expression (P.adj ≤ 0.05, log2FC > 0.25) in each annotated cluster, 3 hours following iTBS and cTBS, and (F) the proportion of those genes that were up-regulated and down-regulated. Full list of DEGs can be found in data S3 and S4. Reported P.adj values are P values that have been adjusted for multiple comparisons for genes in each brain region/cortical layer, using the Bonferroni correction method.
Fig. 3.
Fig. 3.. Differential gene expression analysis of different subcortical regions 3 hours following iTBS and cTBS in the mouse brain.
Spatial plots depicting the anatomical location of clusters that were annotated as various subcortical structures: (A) white matter tracts, (B) caudoputamen, (C) lateral septal complex, (D) pallidum, (E) hypothalamus, and (F) striatum ventral region based on the Allen Mouse Brain Atlas. Venn diagrams display the overlap of significant DEGs (P.adj ≤ 0.05, log2FC > 0.25) identified in each corresponding brain region 3 hours post-iTBS and cTBS. (G) Significant DEGs within each subcortical region, where possible, were classified into different neural processes based on their known function. Number of DEGs identified for each neural process, within each brain region following iTBS (n = 4) and cTBS (n = 3), are shown. Dashes indicate that no DEGs were identified for that functional category. Full list of DEGs can be found in data S4. Reported P.adj values are P values that have been adjusted for multiple comparisons for genes in each brain region using the Bonferroni correction method.
Fig. 4.
Fig. 4.. M1 and SS display different transcriptional responses 3 hours following iTBS and cTBS.
(A) Outline of the image atlas registration workflow used to manually select Visium spots overlying the M1 and SS. (B) Number of spots corresponding to the M1, SS, and other cortical regions across all samples. (C) Venn diagram displaying the overlap of genes that had a significant change in expression (P.adj ≤ 0.05, log2FC > 0.25) between iTBS (n = 4) and cTBS (n = 3) in the M1 cortex (top) and SS (bottom). Full list of DEGs can be found in data S5. Reported P.adj values are P values that have been adjusted for multiple comparisons for genes in each brain region using the Bonferroni correction method.
Fig. 5.
Fig. 5.. Spatial expression signatures of representative genes relating to various neural structures/processes.
Normalized counts were plotted across representative spatial sections from sham-treated (n = 4), iTBS-treated (n = 4), and cTBS-treated (n = 3) groups for DEGs associated with (A) myelin, (B) excitatory neurons, (C) inhibitory neurons, (D) neurotransmitter release, and the (E) regulation of membrane potential. All genes were identified to have significant change in expression (P.adj ≤ 0.05, log2FC > 0.25) in either the M1 or SS 3 hours following iTBS or cTBS. The corresponding log2FC of genes within specific cortical regions are displayed. Volcano plots containing the normalized counts for each gene across all samples can be found in fig. S4. Reported P.adj values are P values that have been adjusted for multiple comparisons for genes in each brain region using the Bonferroni correction method. N.A., not applicable.
Fig. 6.
Fig. 6.. Subclustering analysis of the M1 spots.
(A) Visium spots corresponding to the M1 cortex were subsetted and reclustered to resolve four distinct cortical layers. (B) UMAP plots colored by treatment group (left) and subclusters (right) of M1 cortex spots. (C) Bar plot displaying the number of spots per cluster between all samples. As the number of spots annotated as “cortical layer 1 (Ctx L1)” was sparse in most of the samples, these were not included in the downstream differential expression analyses. (D) Bar plot of the proportion of up-regulated and down-regulated DEGs in each M1 cortical layer, following iTBS and cTBS. (E) Venn diagram showing the overlap of significant DEGs between M1 cortical layers 2/3, 5, and 6, 3 hours following iTBS (left, n = 4) and cTBS (right, n = 3). (F) Examples of genes that display a significant differential expression, in one or more M1 cortical layers, following either iTBS and/or cTBS stimulation. Genes displayed were identified to be involved in one of six different neural processes based on their known function. For each gene, columns display the log2FC of the corresponding gene for each of the M1 cortical layers 2/3, 5, and 6 following iTBS and cTBS. Below, normalized counts for each gene were plotted across the best representative M1 cortex spatial section from a sham, iTBS, and cTBS treatment group. Complete lists of DEGs and GOs affected by iTBS and cTBS for each M1 cortex layer can be found in data S7 and S8. For analysis, DEGs were considered significant based on a threshold of P.adj ≤ 0.05 and log2FC > 0.25. Reported P.adj values are P values that have been adjusted for multiple comparisons for genes in each brain region/cortical layer, using the Bonferroni correction method.
Fig. 7.
Fig. 7.. Subclustering of SS spots.
(A) Visium spots corresponding to the SS were subsetted and reclustered to resolve five distinct cortical layers. (B) UMAP plots colored by treatment group (left) and subclusters (right) of SS spots. (C) Bar plot displaying the number of spots per cluster between all samples. Spots corresponding to cortical layer 1 (Ctx L1) were not included in the downstream differential expression analysis due to their sparse distribution across samples. (D) Bar plot of the proportion of up-regulated and down-regulated significant, DEGs in each SS cortical layer, 3 hours following iTBS (n = 4) and cTBS (n = 3). (E) Venn diagram showing the overlap of DEGs between SS cortical layers 2/3, 4, 5, and 6, following iTBS (left) and cTBS (right). (F) Examples of genes that display a significant differential expression, in one or more M1 cortical layers, following either iTBS and/or cTBS stimulation. Genes displayed were identified to be involved in one of seven different neural processes based on their known function. For each gene, columns display the log2FC of the corresponding gene for each of the SS cortical layers 2/3, 4, 5, and 6 following iTBS and cTBS. Below, normalized counts for each gene were plotted across the best representative SS spatial section from a sham, iTBS, and cTBS treatment group. Complete lists of DEGs and GOs affected by iTBS and cTBS for each SS layer can be found in data S9 and S10. For analysis, DEGs were considered significant based on a threshold of P.adj ≤ 0.05 and log2FC > 0.25. Reported P.adj values are P values that have been adjusted for multiple comparisons for genes in each brain region/cortical layer, using the Bonferroni correction method.

Similar articles

Cited by

References

    1. Vlachos A., Müller-Dahlhaus F., Rosskopp J., Lenz M., Ziemann U., Deller T., Repetitive magnetic stimulation induces functional and structural plasticity of excitatory postsynapses in mouse organotypic hippocampal slice cultures. J. Neurosci. 32, 17514–17523 (2012). - PMC - PubMed
    1. Lenz M., Platschek S., Priesemann V., Becker D., Willems L. M., Ziemann U., Deller T., Müller-Dahlhaus F., Jedlicka P., Vlachos A., Repetitive magnetic stimulation induces plasticity of excitatory postsynapses on proximal dendrites of cultured mouse CA1 pyramidal neurons. Brain Struct. Funct. 220, 3323–3337 (2015). - PubMed
    1. Lenz M., Galanis C., Müller-Dahlhaus F., Opitz A., Wierenga C. J., Szabó G., Ziemann U., Deller T., Funke K., Vlachos A., Repetitive magnetic stimulation induces plasticity of inhibitory synapses. Nat. Commun. 7, 10020 (2016). - PMC - PubMed
    1. Eichler A., Kleidonas D., Turi Z., Fliegauf M., Kirsch M., Pfeifer D., Masuda T., Prinz M., Lenz M., Vlachos A., Microglial cytokines mediate plasticity induced by 10 Hz repetitive magnetic stimulation. J. Neurosci. 43, 3042–3060 (2023). - PMC - PubMed
    1. Tang A. D., Bennett W., Bindoff A. D., Bolland S., Collins J., Langley R. C., Garry M. I., Summers J. J., Hinder M. R., Rodger J., Canty A. J., Subthreshold repetitive transcranial magnetic stimulation drives structural synaptic plasticity in the young and aged motor cortex. Brain Stimul. 14, 1498–1507 (2021). - PubMed

LinkOut - more resources