. 2025 Jan 10;11(2):eadp5763.
doi: 10.1126/sciadv.adp5763. Epub 2025 Jan 8.

Photophysics-informed two-photon voltage imaging using FRET-opsin voltage indicators

Affiliations

Photophysics-informed two-photon voltage imaging using FRET-opsin voltage indicators

F Phil Brooks 3rd et al. Sci Adv. .

Abstract

Microbial rhodopsin-derived genetically encoded voltage indicators (GEVIs) are powerful tools for mapping bioelectrical dynamics in cell culture and in live animals. Förster resonance energy transfer (FRET)-opsin GEVIs use voltage-dependent quenching of an attached fluorophore, achieving high brightness, speed, and voltage sensitivity. However, the voltage sensitivity of most FRET-opsin GEVIs has been reported to decrease or vanish under two-photon (2P) excitation. Here, we investigated the photophysics of the FRET-opsin GEVIs Voltron1 and Voltron2. We found that the previously reported negative-going voltage sensitivities of both GEVIs came from photocycle intermediates, not from the opsin ground states. The voltage sensitivities of both GEVIs were nonlinear functions of illumination intensity; for Voltron1, the sensitivity reversed the sign under low-intensity illumination. Using photocycle-optimized 2P illumination protocols, we demonstrate 2P voltage imaging with Voltron2 in the barrel cortex of a live mouse. These results open the door to high-speed 2P voltage imaging of FRET-opsin GEVIs in vivo.


Figures

Fig. 1.
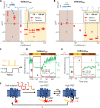
Fig. 1.. Illumination-dependent performance of FRET-opsin voltage indicators.
(A) Simple model of a FRET-opsin GEVI. A fluorescent FRET donor is optically excited and can relax either by fluorescence or by FRET to the retinal chromophore. Voltage-dependent shifts in the retinal absorption spectrum modulate the fluorescence of the donor. (B) The light used to excite the FRET donor may also excite the retinal chromophore directly, driving phototransitions in the opsin and changing the voltage-sensing properties of the GEVI. (C) Fluorescence image of a HEK-293T cell expressing Voltron2608 and subject to voltage clamp. (D and E) Voltage step responses from cells expressing Voltron1608 at low (1 mW/mm2) and high (50 mW/mm2) illumination intensities at λ = 594 nm. Transient and plateau phases of the response are indicated. At low intensity, steady-state fluorescence responses showed a nonmonotonic dependence on membrane voltage. (F and G) Same as (D) and (E) for Voltron2608, with the same ΔF/F vertical scale. (H to K) Plots of steady-state ΔF/F versus V for (H) Voltron1608, (I) Voltron2608, (J) Voltron1549, and (K) Voltron2549. Each curve is plotted for dim (dark colors) and bright (light colors) illumination. For all reporter combinations, both the slope and shape of the curve were sensitive to illumination intensity. Error bars represent SEM from three to six cells.
Fig. 2.
Fig. 2.. Intensity-dependent voltage sensitivity of Voltron GEVIs.
(A) Sensitivity (ΔF/F) of Voltron1608 as a function of illumination intensity for voltage steps from −70 to +30 mV (n = 5 cells). Horizontal error bars denote the range of illumination intensities; vertical error bars denote SEM. Blue, representative step responses. I and II mark the insensitive and voltage-sensitive regimes, respectively [also in (B), (D), and (E)]. (B) Same as (A), but for Voltron2608 (n = 3 cells). (C) Protocol for measuring GEVI responses to a step in illumination. Dynamics in the “dark” were probed by very dim (0.75 mW/mm2) illumination; bright pulses (75 ms, 15 mW/mm2) transiently populated the voltage-sensitive states. (D) The voltage sensitivity of Voltron1608 (green, right axis) was calculated from the difference between the fluorescence at −70 mV (black, left axis) and at +30 mV (red, left axis). Sensitivity emerged with a time constant of 5 ms and declined with a time constant of 46 ms. a.u., arbitrary units. (E) Same as (D) for Voltron2608. Sensitivity emerged with a time constant of 4 ms and declined with a time constant of 16 ms. (F) Model of photoactivated voltage sensitivity in a FRET-opsin voltage indicator. Dark-adapted Voltron2 does not show voltage-dependent FRET. Upon absorption of at least one photon (e.g., 594- or 1135-nm 2P), the opsin enters a voltage-sensitive equilibrium between high- and low-FRET states. In Voltron2, this equilibrium relaxes to the dark-adapted state with a time constant τr ~ 16 ms.
Fig. 3.
Fig. 3.. 2P voltage imaging with Voltron2.
(A) Comparison of Voltron2549 voltage sensitivity under 2P versus 1P illumination. A HEK-293T cell expressing Voltron2549 was subjected to voltage steps from a holding potential of −70 mV. Fluorescence was recorded under 2P excitation and then under 1P excitation. The fractional changes in fluorescence were smaller and slower under 2P versus 1P excitation. The inset shows a magnified 2P fluorescence trace. Photobleaching was corrected before calculating ΔF/F. (B) Same as (A), but with Voltron2608. (C) Voltage step response from the same Voltron2608-expressing cell shown in (B). (D) Voltage response under 2P excitation for Voltron2549 and Voltron2608 under bright (9.4 to 9.5 mW) illumination. Error bars represent SEM (n = 6 to 12 cells). (E) Comparison of responses to a 100-mV step (−90 to +10 mV) for Voltron2549 and Voltron2608 from matched samples and measurement conditions. Voltron2549 1P: 26 mW/mm2, 532 nm; 2P: 9.4 mW, 1040 nm; n = 9 cells. Voltron2608 1P: 6 mW/mm2, 594 nm; 2P: 9.5 mW, 1135 nm; n = 14 cells. Error bars represent the mean ± SEM. 1P voltage sensitivity was significantly greater than 2P voltage sensitivity for Voltron2549 (*P = 0.0006, two-tailed t test) but not for Voltron2608. N.S., not significant. (F) Fractional sensitivity (ΔF/F) of Voltron2608 as a function of 2P illumination power for a voltage step from −70 to +30 mV. Error bars represent SEM (n = 13 to 30 cells).
Fig. 4.
Fig. 4.. 2P voltage imaging with Voltron2608 in vivo.
(A) Cre-dependent Voltron2 and CheRiff were coexpressed by adeno-associated virus injection in the layer 1 barrel cortex of Ndnf-Cre mice and imaged through a cranial window (Materials and Methods). Neurons were imaged under a 2P spiral scan (1135 nm, 500-Hz scan frequency, 15 to 54 mW) and then 1P targeted illumination (594 nm, 30 mW/mm2). Blue light pulses (1.5 mW/mm2) evoked activity. (B and C) Representative fluorescence traces (left axis, detrended ΔF/F; right axis, F) of two cells from two mice with 1P (top) and 2P (bottom) excitation. (D and E) Enlarged views of the traces showing individual spontaneous and optogenetically evoked spikes (marked with asterisks). (F) Spike-triggered average traces from (C). Blue light evoked spikes (N1p = 46 and N2p = 43) and spontaneous spikes (N1p = 18 and N2p = 13) from the recording shown in (C) showed similar amplitudes and widths. (G) Average spike heights for paired 1P and 2P recordings from the same cells were not significantly different (n = 8 cells, P = 0.18). (H) SNR versus fluorescence (counts per cell per frame) for each recorded cell under different illumination intensities (n = 8 cells). The SNR and fluorescence showed a power-law relationship with exponent a = 0.42 ± 0.05 (95% confidence interval; R2 = 0.87), close to the shot noise–limited SNR (a = 0.5). Deviation from shot noise–limited SNR in vivo is likely due to contributions from background fluorescence, brain motion, and blood flow.

Update of

Similar articles

Cited by

References

    1. Adam Y., All-optical electrophysiology in behaving animals. J. Neurosci. Methods 353, 109101 (2021). - PubMed
    1. Abdelfattah A. S., Zheng J., Singh A., Huang Y.-C., Reep D., Tsegaye G., Tsang A., Arthur B. J., Rehorova M., Olson C. V. L., Shuai Y., Zhang L., Fu T.-M., Milkie D. E., Moya M. V., Weber T. D., Lemire A. L., Baker C. A., Falco N., Zheng Q., Grimm J. B., Yip M. C., Walpita D., Chase M., Campagnola L., Murphy G. J., Wong A. M., Forest C. R., Mertz J., Economo M. N., Turner G. C., Koyama M., Lin B.-J., Betzig E., Novak O., Lavis L. D., Svoboda K., Korff W., Chen T.-W., Schreiter E. R., Hasseman J. P., Kolb I., Sensitivity optimization of a rhodopsin-based fluorescent voltage indicator. Neuron 111, 1547–1563.e9 (2023). - PMC - PubMed
    1. Böhm U. L., Kimura Y., Kawashima T., Ahrens M. B., Higashijima S.-i., Engert F., Cohen A. E., Voltage imaging identifies spinal circuits that modulate locomotor adaptation in zebrafish. Neuron 110, 1211–1222.e4 (2022). - PMC - PubMed
    1. Adam Y., Kim J. J., Lou S., Zhao Y., Xie M. E., Brinks D., Wu H., Mostajo-Radji M. A., Kheifets S., Parot V., Chettih S., Williams K. J., Gmeiner B., Farhi S. L., Madisen L., Buchanan E. K., Kinsella I., Zhou D., Paninski L., Harvey C. D., Zeng H., Arlotta P., Campbell R. E., Cohen A. E., Voltage imaging and optogenetics reveal behaviour-dependent changes in hippocampal dynamics. Nature 569, 413–417 (2019). - PMC - PubMed
    1. Kralj J. M., Hochbaum D. R., Douglass A. D., Cohen A. E., Electrical spiking in Escherichia coli probed with a fluorescent voltage indicating protein. Science 333, 345–348 (2011). - PubMed

LinkOut - more resources