. 2025 Jan 10;11(2):eadr7434.
doi: 10.1126/sciadv.adr7434. Epub 2025 Jan 8.

Electrical signaling and coordinated behavior in the closest relative of animals

Affiliations

Electrical signaling and coordinated behavior in the closest relative of animals

Jeffrey Colgren et al. Sci Adv. .

Abstract

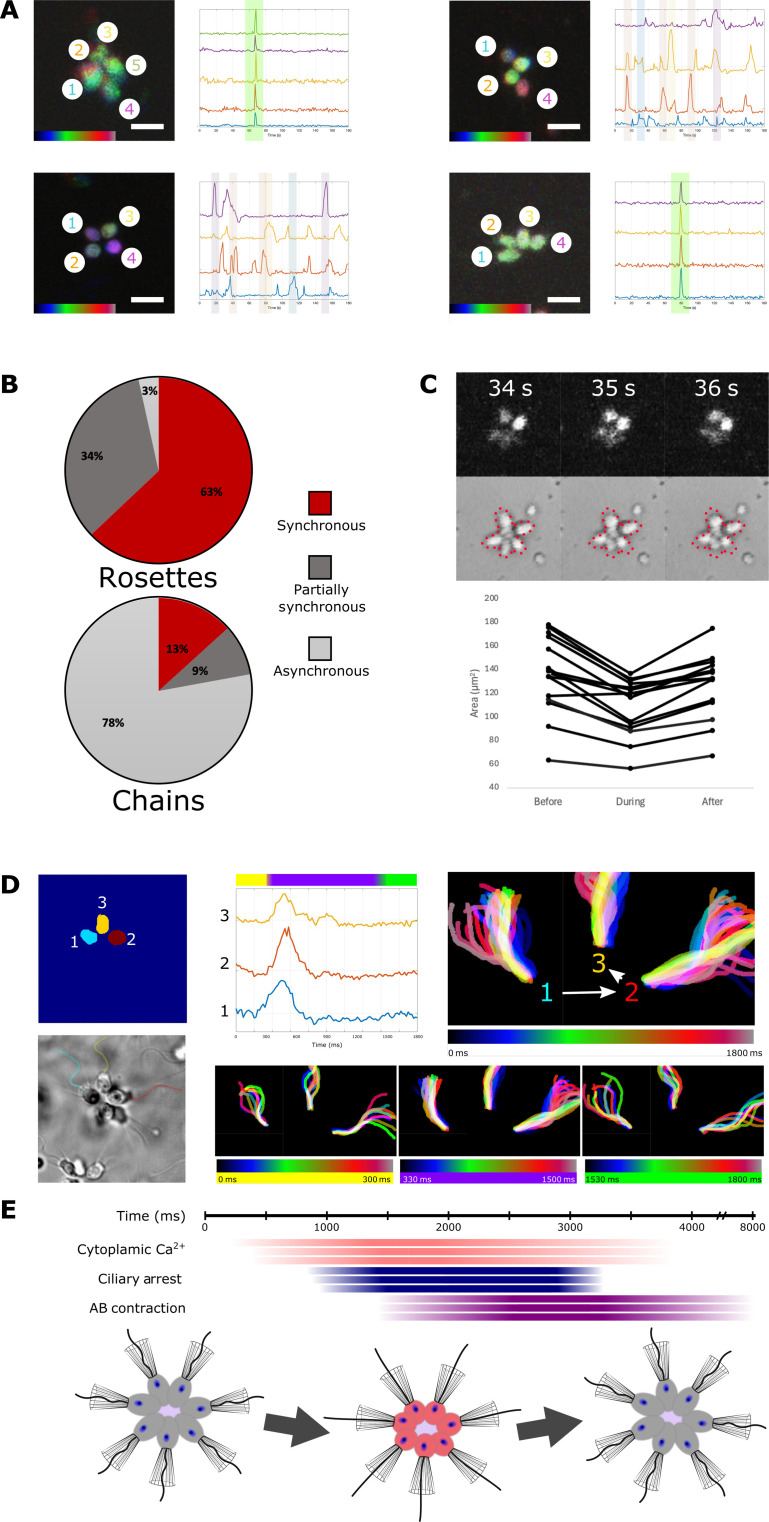
The transition from simple to complex multicellularity involves division of labor and specialization of cell types. In animals, complex sensory-motor systems are primarily built around specialized cells of muscles and neurons, though the evolutionary origins of these and their integration remain unclear. Here, to investigate sensory-behavior coupling in the closest relatives of animals, we established a line of the choanoflagellate, Salpingoeca rosetta, which stably expresses the calcium indicator RGECO1. Using this, we identify a previously unknown cellular behavior associated with electrical signaling, in which ciliary arrest is coupled with apical-basal contraction of the cell. This behavior and the associated calcium transients are synchronized in the multicellular state and result in coordinated ciliary arrest and colony-wide contraction, suggesting that information is spread among the cells. Our work reveals fundamental insights into how choanoflagellates sense and respond to their environment and enhances our understanding of the integration of cellular and organism-wide behavior in the closest protistan relatives of animals.


Figures

Fig. 1.
Fig. 1.. Choanoflagellate morphology, feeding, and spontaneous Ca2+ dynamics.
(A) Unicellular state of Salpingoeca rosetta, showing tubulin (gray) and actin filaments (cyan), the polarized cell has a single flagellum (cilia) surrounded by a microvilli-based collar. (B) Planar beating of the flagellum draws water through the microvilli collar where bacterial prey can become trapped. Prey is phagocytized at the base of the collar. (C) Multicellular states in S. rosetta form through serial division, resulting in chains (top) or rosettes (bottom). Cells are connected by thin intercellular bridges (yellow/orange in diagrams) and share ECM (red). In rosette, filopodia (gray) at the base of the cells extend into a thick ECM orienting the collar and flagella outward. Intercellular bridges do not have a stereotyped pattern in colonies. (D) Time series projection of RGECO signal in cells over 360 s of a spontaneously acting culture. Upper left shows a still of simultaneously acquired DIC images of the culture. (E) ΔF/F0 (z axis) traces for all cells (y axis) over time (x axis) in a spontaneously acting culture. (F) A mirror culture plated in calcium-free media shows complete loss of spontaneous activity. (G) A mirror culture treated with Gd3+ also shows complete loss of spontaneous activity. (H) Series from the CFM culture, following introduction of 10 mM Ca2+ shows a return of spontaneous activity. Scale bars, 5 μm (A) and 20 μm [(C) and (D)]. s, seconds.
Fig. 2.
Fig. 2.. Spontaneous activity increases with prey abundance and transients can be controlled by voltage-gated calcium channel activity.
(A) Cultures were thoroughly washed with artificial seawater (ASW) and then plated in ASW or ASW with a known quantity of feeder bacteria. Raster plots for washed culture (top) and mirror culture with bacteria reintroduced (bottom), where regions of interest (ROIs) correspond to cells (y axis) over time (x axis) with dots indicating peaks and whiskers indicating rise and fall. (B) Perfusion of 25 mM K+ (T = 80 s) triggers a highly synchronized event within the field of view. This can also be achieved with electric field stimulation, by applying a 50-V pulse (T = 40 s). Treatment with the voltage-gated calcium channel inhibitor, verapamil (10 μm), greatly decreases spontaneous activity. EFS, electric field stimulation. s, seconds.
Fig. 3.
Fig. 3.. Events associated with VGCC activity are associated with a cellular behavior.
(A) K-shape peak clusters from aligning individual peaks from spontaneously activity in normal culture, high bacterial, and verapamil treated, as well as from K+ stimulated. (B) Heatmap showing proportion of peaks that fall into each cluster in the different treatment conditions. Clusters 4 and 5 show the largest positive change to stimulation and negative change following verapamil treatment. (C) Top shows a DIC image overlaid with RGECO signal (magenta) of a cell undergoing a spontaneous event. The cell is outlined with yellow showing a shape change during the event. Bottom shows several cells in a field of view undergoing a synchronized shape change following stimulation with K+. Quantification of circularity and aspect ratio of each cell shows a rounding up followed by return to original polarized shape during the event. (D) FM4-64–labeled cell (yellow outline) and bacterium (white arrow) at the collar shows displacement of the bacteria during the shape change event. Below, quantification of visible bacteria on the cell’s collars before and just after stimulation. Still images show bacteria (white arrows) visible on the collar of a cell (yellow asterisk) before and after stimulation.
Fig. 4.
Fig. 4.. Calcium regulates flagellar arrest.
(A) Flagellar beating arrests during events. Rows show three frames of overlapping DIC and RGECO images with the flagella highlighted in magenta (top and bottom) or red (middle). Series occur before (top), during (middle), and after (bottom) the event. (B) The blue line shows pixel intensity of line scan taken parallel to the flagella originated from the base in the DIC images. Consistent beating shows periodic maximum and minimum values as the flagella passes the line, while changes in beating alter this pattern. The red line shows intensity of RGECO signal in the cell body. The green bar indicates when K+ was perfused into the culture. (C) Dual recording of RGECO signal and flagellar beating shows that arrest occurs after the initial increase in calcium concentration in the cell body. Bottom shows RGECO trace in ~30-ms frames on the left, with temporal projections of the flagella on the right. Top shows the projection over 40 frames during which RGECO signal reaches its maxima, the middle shows the first 20 frames, and the bottom shows the last 20 frames. (D) General sequence of events for behavior. Initial rise in cytoplasmic RGECO signal peaks in ~1000 ms and plateaus for ~400 ms before returning to baseline levels over ~2500 ms. Ciliary arrest begins 600 to 900 ms and takes ~600 ms to fully arrest. Beating returns with the drop in cytoplasmic calcium levels. Apical-basal (AB) contraction begins about 500 ms after the onset of ciliary arrest and continues for around 2000 to 3000 ms before gradually returning to the initial shape. Scale bars, 5 μm [(A) and (C)]. ms, milliseconds.
Fig. 5.
Fig. 5.. Both synchronized and asynchronized events occur in colonies and the described behavior is synchronized.
(A) Rosette colonies primarily show highly synchronized (top) but do have asynchronous events (bottom). Chains primarily show asynchronous events (top) while synchronous ones are present. Graphs show RGECO intensities for each cell, with color matching the number in the temporal projections. (B) Quantification of the occurrence of synchronized, partially synchronized (two or more cells), and asynchronous (multiple cells at different times) in spontaneously acting cultures. (C) RGECO (top) and DIC (bottom) images during an event show coordination of signal and contraction in the colony. Cross-sectional area of various rosette colonies before, during, and after induced events. (D) High-speed imaging of spontaneous activity in a rosette shows synchronized flagellar arrest as well. RGECO signal first increases in cell 1, before visibly increasing in cells 2 and 3. All three visible flagella stop beating around 60 to 90 ms after signal increase, and show a synchronized arrest. Temporal projections of flagella show the total time series, with the bottom panels showing the first 300 ms during which cytoplasmic calcium increases, the ~1200 ms that beating is arrested, and the recovery period. (E) General sequence of events observed in colonies. The sequence follows what is observed in single cells. The three colored bars represent individual cells of a colony as in (D) showing subtle disparities between initial calcium influx and ciliary arrest timing. Scale bars, 10 μm. s, seconds. ms, milliseconds.

Similar articles

References

    1. Cai X., Wang X., Patel S., Clapham D. E., Insights into the early evolution of animal calcium signaling machinery: A unicellular point of view. Cell Calcium 57, 166–173 (2015). - PMC - PubMed
    1. Colgren J., Burkhardt P., The premetazoan ancestry of the synaptic toolkit and appearance of first neurons. Essays Biochem. 66, 781–795 (2022). - PMC - PubMed
    1. Ros-Rcoher N., Pérez-Posada A., Leger M. M., Ruiz-Trillo I., The origin of animals: An ancestral reconstruction of the unicellular-to-multicellular transition. Open Biol. 11, 200359 (2021). - PMC - PubMed
    1. Brunet T., King N., The origin of animal multicellularity and cell differentiation. Dev. Cell 43, 124–140 (2017). - PMC - PubMed
    1. Colgren J., Nichols S. A., MRTF specifies a muscle-like contractile module in Porifera. Nat. Commun. 13, 4134 (2022). - PMC - PubMed

LinkOut - more resources