. 2025 Jan 10;11(2):eads6215.
doi: 10.1126/sciadv.ads6215. Epub 2025 Jan 8.

Infection-induced lysine lactylation enables herpesvirus immune evasion

Affiliations

Infection-induced lysine lactylation enables herpesvirus immune evasion

Matthew D Tyl et al. Sci Adv. .

Abstract

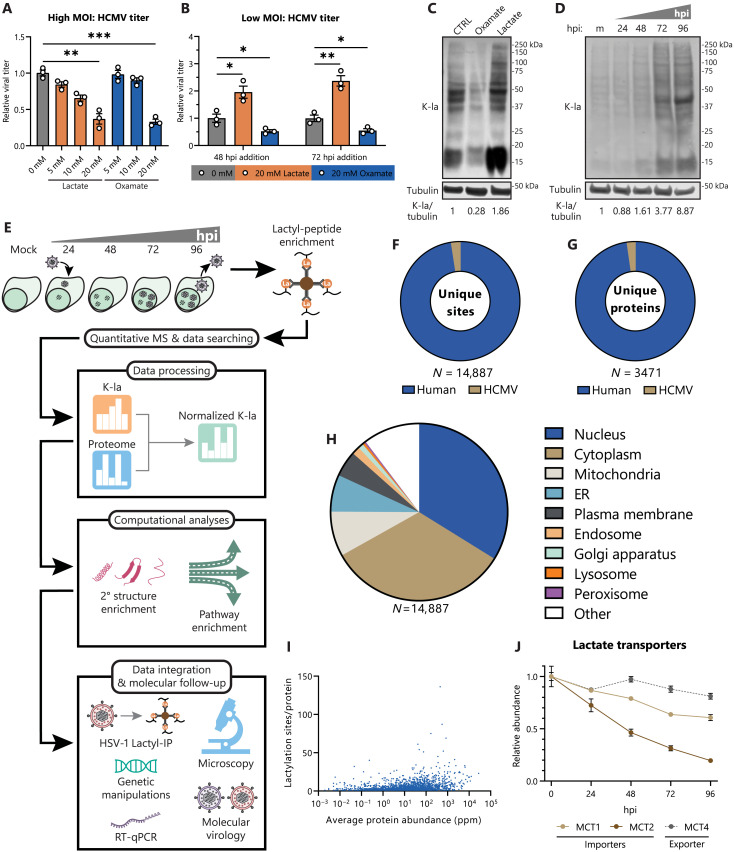
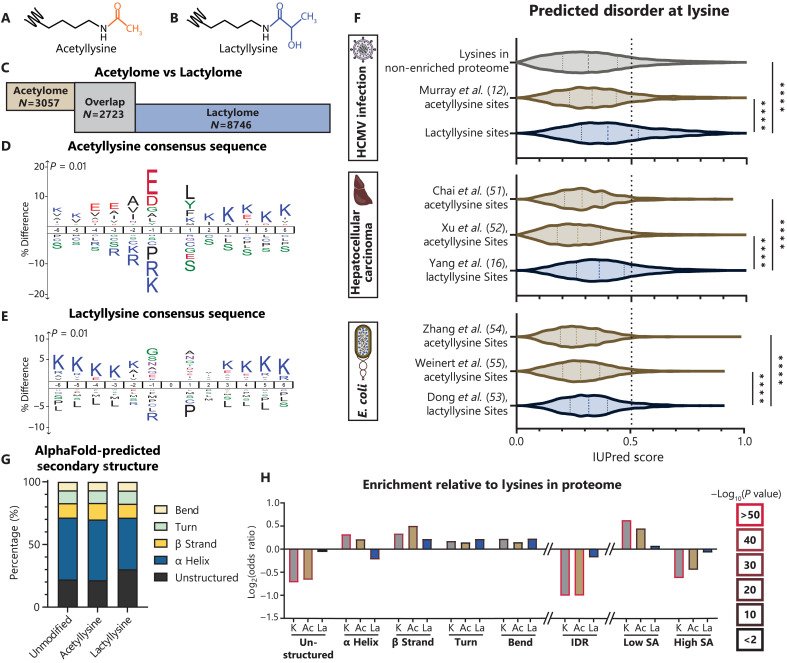
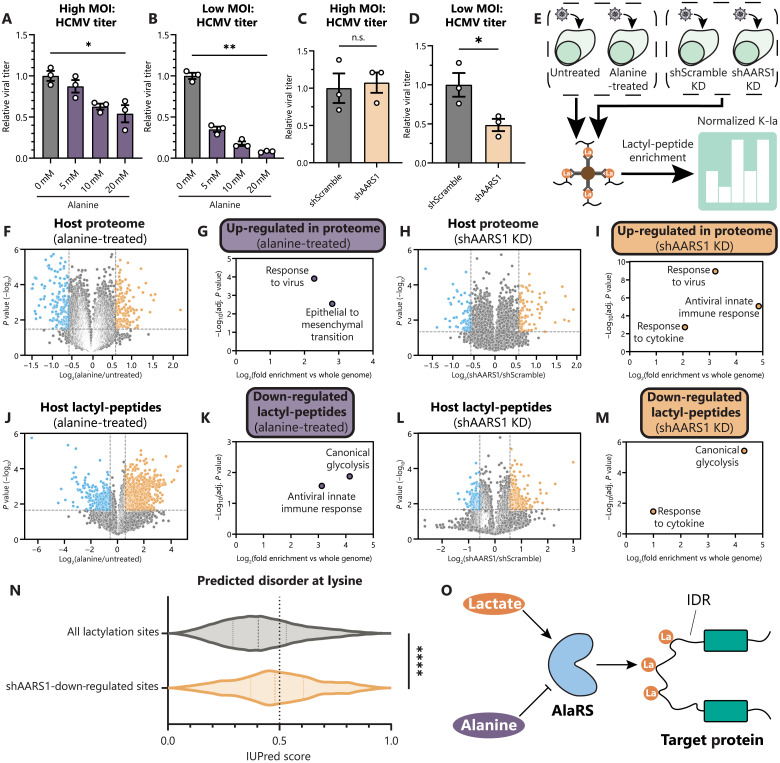
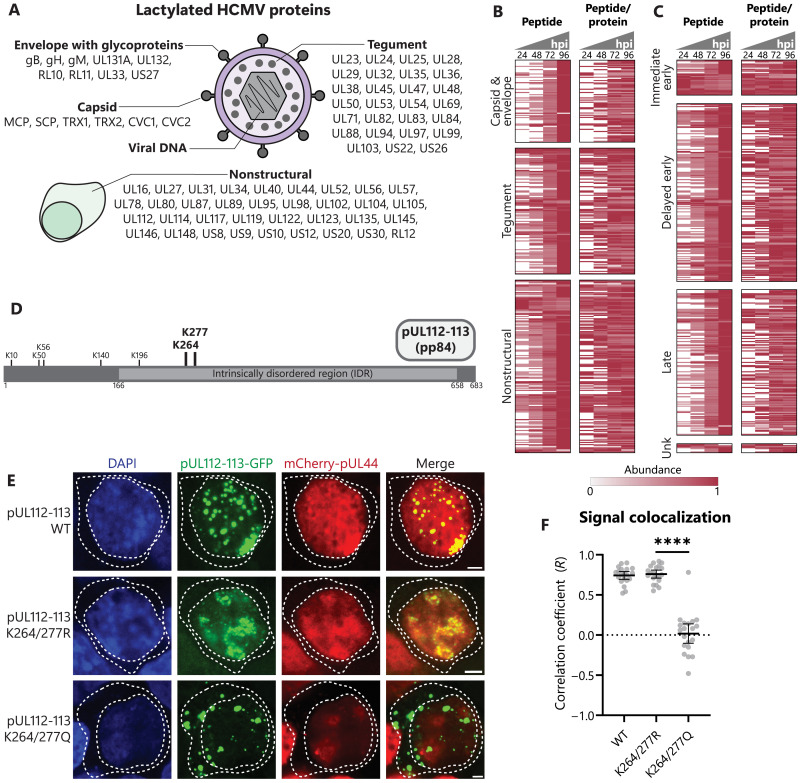
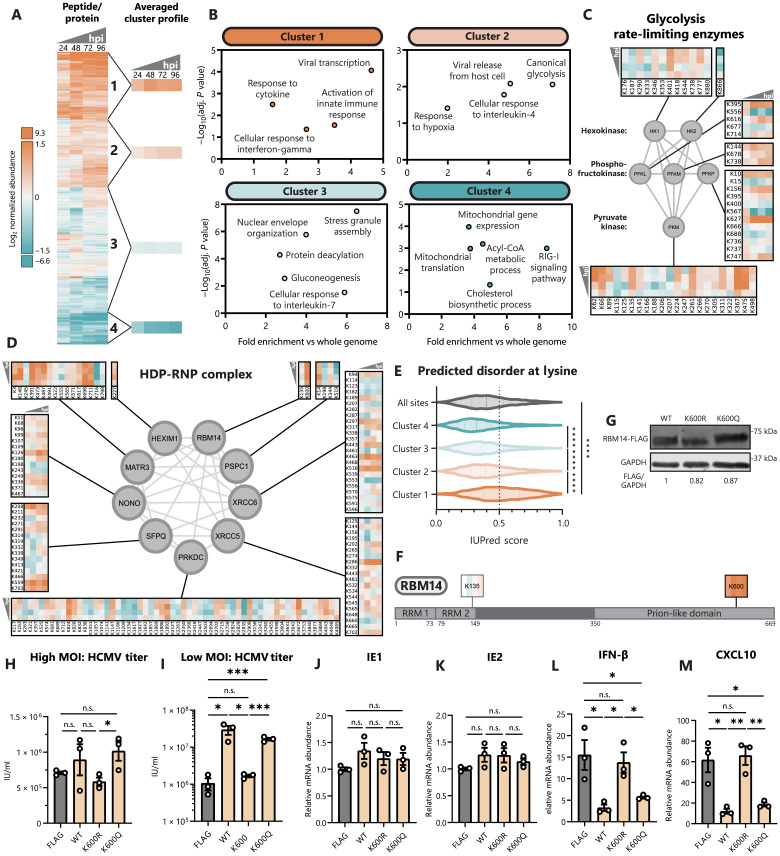
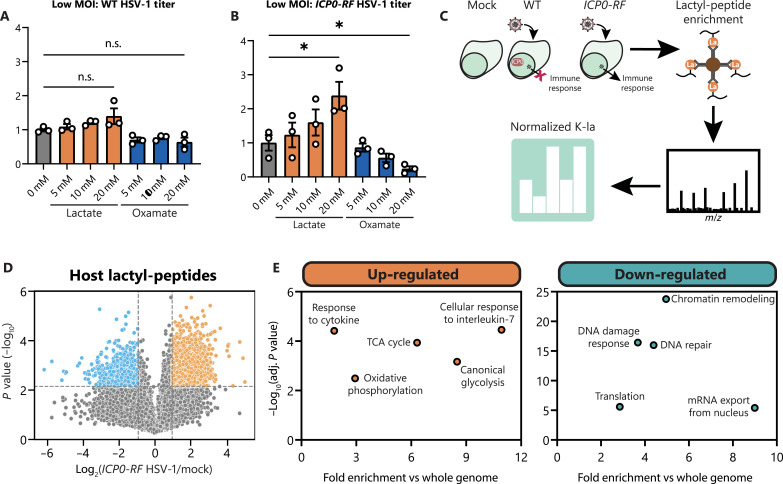
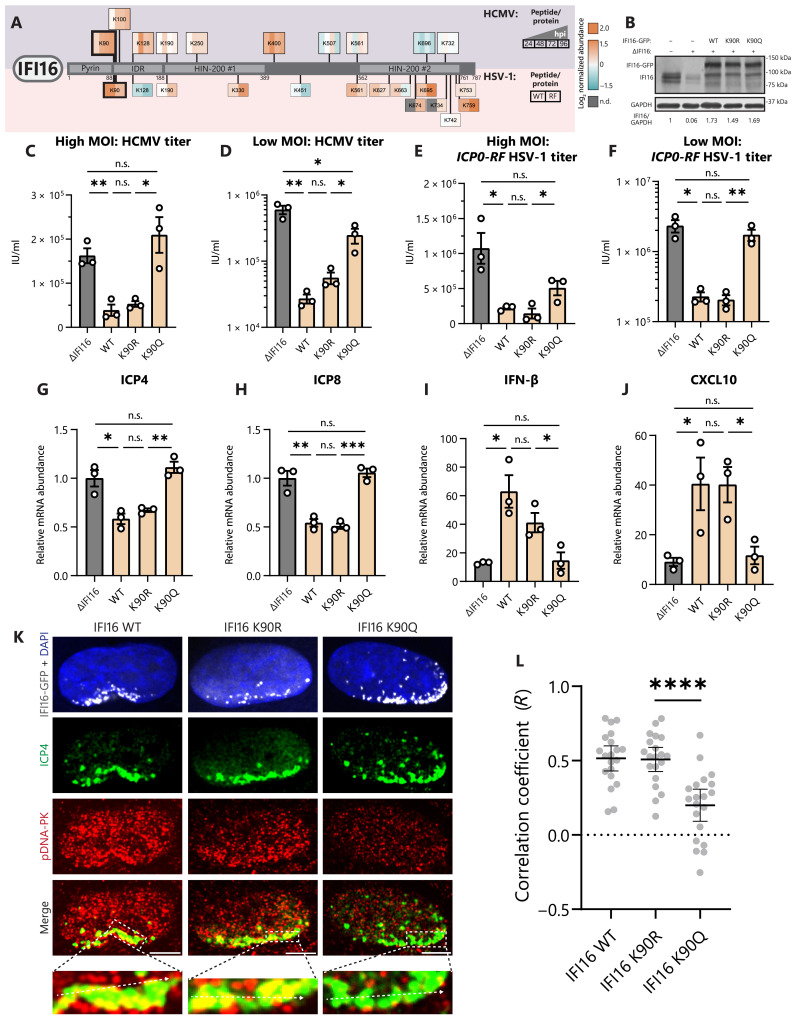
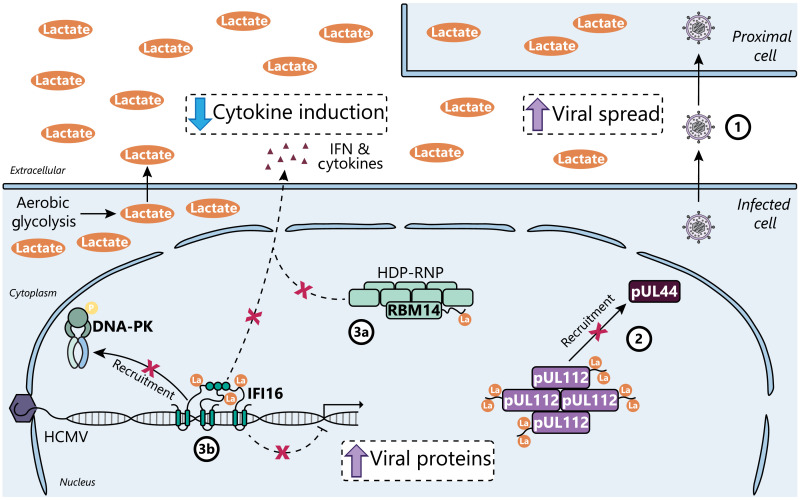
Aerobic glycolysis is a hallmark of many viral infections, leading to substantial accumulation of lactate. However, the regulatory roles of lactate during viral infections remain poorly understood. Here, we report that human cytomegalovirus (HCMV) infection leverages lactate to induce widespread protein lactylation and promote viral spread. We establish that lactyllysine is enriched in intrinsically disordered regions, regulating viral protein condensates and immune signaling transduction. Dynamic lactylation of immune factors suppresses immunity, a feature we show to be shared for HCMV and herpes simplex virus 1 infections, through regulation of RNA binding protein 14 and interferon-γ-inducible protein 16 (IFI16). K90 lactylation of the viral DNA sensor IFI16 inhibits recruitment of the DNA damage response kinase DNA-PK, preventing IFI16-driven virus gene repression and cytokine induction. Together, we characterize global protein lactylation dynamics during virus infection, finding that virus-induced lactate contributes to its immune evasion through direct inhibition of immune signaling pathways.


Figures

Fig. 1.
Fig. 1.. HCMV-induced lactate causes widespread proteome lactylation and promotes virus spread.
(A) Virus titer after HCMV (strain TB40/E) infection of WT MRC-5 fibroblasts (MOI 1, 120 hpi, n = 3). Media were untreated (0 mM) or supplemented with 5 to 20 mM sodium lactate or sodium oxamate. Replicates were normalized by the untreated average virus titer. (B) Virus titer as in (A), except MOI 0.01, 12 dpi. Media were swapped from control media to untreated (0 mM), 20 mM lactate, or 20 mM oxamate media at the indicated hpi and then incubated until collection at 12 dpi. (C) MRC-5 cells were infected with HCMV (MOI 3) and treated with 0 mM, 20 mM lactate, or 20 mM oxamate. Cells were incubated until 96 hpi, followed by immunoblot analysis of whole-cell lysate with pan anti-lactyllysine antibody (K-la) or anti-tubulin (loading control). (D) MRC-5 cells were mock infected (m) or infected with HCMV (MOI 3) and collected at the indicated hpi and then processed as in (C). (E) Workflow for global lactylome sample preparation and subsequent data processing, computational analysis, and functional follow-up. RT-qPCR, reverse transcription qPCR. (F) Number of unique lactyllysine sites identified across (G) unique host and viral proteins in the HCMV global lactylome dataset. (H) Primary subcellular localization (UniProt) of lactylated protein across all lactylation sites. ER, endoplasmic reticulum. (I) Number of identified lactylation sites as a function of absolute protein abundance in parts per million (ppm) sourced from PaxDb, H. sapiens–lung (integrated). (J) Protein abundances of the primary lactate importers and exporters during infection with HCMV, n = 3. Data are representative of three independent experiments [(C) and (D)]. Bar plots are means ± SEM, with significance determined by two-tailed Student’s t test [(A) and (B)]. *P < 0.05, **P < 0.01, and ***P < 0.001.
Fig. 2.
Fig. 2.. Evolutionarily conserved enrichment of lactyllysine in protein IDRs.
(A and B) Schematic of acetyllysine and lactyllysine. (C) Unique acetyllysine, unique lactyllysine, or overlapping sites by comparison to the HCMV-infected MRC-5 acetylome (12). (D) Acetyllysine consensus sequence or (E) lactyllysine consensus sequence determined with iceLogo. (F) IUPred3-predicted intrinsic disorder score across the depicted datasets (, , –55). (G) Proportion of each dataset with lysines in the indicated AlphaFold-predicted secondary structure group (H) with statistical enrichment compared to the theoretical human proteome, including predicted solvent accessibility (SA). Dotted lines on violin plots separate quartiles (F). Significance determined by two-tailed Student’s t test. ****P < 0.0001.
Fig. 3.
Fig. 3.. AARS1-mediated IDR lactylation regulates innate immunity.
(A) Virus titer after HCMV infection of WT MRC-5 fibroblasts (MOI 1, 5 dpi, n = 3) or (B) (MOI 0.01, 12 dpi, n = 3). Media were untreated (0 mM) or treated with 5 to 20 mM alanine. Replicates were normalized by the untreated average virus titer. (C and D) Virus titer as in (A) and (B), except in MRC-5 fibroblasts with stable AARS1 KD (shAARS1) or control (shScramble). (E) Workflow for global lactylome sample preparation from cells infected with HCMV (96 hpi) either left untreated, treated with 100 mM alanine, expressing shScramble, or expressing shAARS1. (F to I) Volcano plots showing host protein abundances as log2 fold change of alanine-treated versus untreated (F) or shAARS1 versus shScramble (H) abundance during infection, with corresponding enriched GO biological processes among up-regulated proteins using g:Profiler [(G) and (I)]. (J to M) As in (F) to (I), except with host lactyl-peptide abundances, with corresponding enriched GO terms among down-regulated sites. (N) IUPred3-predicted intrinsic disorder scores for all lactylation sites detected compared to only down-regulated sites in shAARS1 cells. (O) Schematic of AlaRS-catalyzed lactylation of protein IDRs. Bar plots are means ± SEM [(A) to (D)]; dotted lines on violin plots separate quartiles (N). Significance determined by two-tailed Student’s t test. n.s., not significant, *P < 0.05, **P < 0.01, and ****P < 0.0001.
Fig. 4.
Fig. 4.. Prominent viral protein lactylation regulates processes important for replication.
(A) Schematic of all identified lactylation sites on viral proteins separated by protein type in the virus particle or nonstructural proteins expressed during infection. (B) Heatmap showing temporal viral protein lactyl-peptide abundances without normalization (peptide) or normalized to abundance of that viral protein (peptide/protein) throughout infection. Proteins are grouped by virus protein type or (C) gene temporal class. Each peptide is normalized to maximum abundance across time points of infection. Unk, unknown. (D) Schematic of identified lactyllysines on the pp84 isoform of pUL112-113. (E and F) Transfection of plasmid expressing WT, K264/277R, or K264/277Q pUL112-113-GFP, along with mCherry-pUL44, in HEK293T cells. Representative images at 100× are shown (scale bars, 2.5 μm), with dotted lines bounding the nucleus and cytoplasm. Colocalization [Pearson’s correlation coefficient (PCC)] of the signal was measured within the nucleus (10 nuclei per n; n = 3). Bar plots are means ± 95% confidence interval (CI), with significance determined by two-tailed Student’s t test. ****P < 0.0001.
Fig. 5.
Fig. 5.. Host protein lactylation dynamics reveal RBM14 as a lactylation-regulated proviral factor.
(A) Heatmap showing temporal host protein lactyl-peptide abundances (normalized to protein abundance) throughout infection, with hierarchical clustering into four clusters. Each peptide is shown as log2 fold change over mock (uninfected) abundance. hpi, hours after infection. (B) Scatterplots showing select enriched GO biological processes within each cluster generated using g:Profiler. (C) All identified lactylation sites on glycolysis rate-limiting enzymes or (D) on HDP-RNP complex members. Temporal abundances are normalized and scaled as in (A). (E) IUPred3-predicted intrinsic disorder score across the whole dataset or within individual clusters. (F) Schematic of identified lactylation sites on RBM14. RRM, RNA recognition motif. (G) MRC-5 cell lines expressing RBM14-FLAG WT, K-to-R, and K-to-Q constructs. Immunoblot analysis with anti-FLAG or anti-GAPDH (loading control). (H) Virus titer after HCMV infection of RBM14 or FLAG (control) cell lines at MOI 1 (5 dpi, n = 3) or (I) MOI 0.01 (12 dpi, n = 3). IU/ml, infectious units/ml. (J to M) IE1, IE2, IFN-β, and CXCL10 mRNA levels were quantified by qPCR (ΔΔCt against GAPDH) (HCMV MOI 5, 6 hpi, n = 3). Replicates were normalized by the average FLAG mRNA levels [(J) and (K)] or mock mRNA levels [(L) and (M)]. Dotted lines on violin plots separate quartiles (D); bar plots are means ± SEM [(H) to (M)]. Significance determined by two-tailed Student’s t test. n.s., not significant, *P < 0.05, **P < 0.01, ***P < 0.001, and ****P < 0.0001.
Fig. 6.
Fig. 6.. Lactate supports HSV-1 spread while lactylating immune signaling pathways.
(A) Virus titer after WT (2 dpi, n = 3) or (B) ICP0-RF HSV-1 infection (3 dpi, n = 3) of WT MRC-5 fibroblasts at MOI 0.01. Media were untreated (0 mM) or supplemented with 5 to 20 mM sodium lactate or sodium oxamate. Replicates were normalized by the untreated average virus titer. (C) Workflow for global lactylome sample preparation from mock or WT/ICP0-RF HSV-1–infected samples (6 hpi) with subsequent data processing. (D) Volcano plot showing host protein lactyl-peptide abundances (normalized to protein abundance) as log2 fold change over mock abundance during ICP0-RF HSV-1 infection. Dotted lines show the threshold for differentially regulated sites: log2 fold change = 1 and P < 0.01. (E) Scatterplots showing select enriched GO biological processes among up-regulated or down-regulated lactyl-peptides using g:Profiler. Bar plots are means ± SEM, with significance determined by two-tailed Student’s t test [(A) and (B)]. n.s., not significant, *P < 0.05.
Fig. 7.
Fig. 7.. IFI16 lactylation inhibits innate immunity through loss of active DNA-PK recruitment.
(A) Schematic of identified lactylation sites on IFI16 during infection with HCMV (top) or HSV-1 (bottom). Lactyl-peptide abundances (normalized to protein abundance) are shown as log2 fold change over mock (uninfected) abundance. hpi, hours after infection; WT, WT HSV-1; RF, ICP0-RF HSV-1; n.d., not determined. (B) ΔScramble, ΔIFI16, or ΔIFI16 HFF cell lines expressing indicated IFI16-GFP constructs. Immunoblot analysis with anti-IFI16 or anti-GAPDH (loading control) antibodies. (C) Virus titer after HCMV infection of IFI16 stable cell lines or ΔIFI16 (control) (MOI 1, 5 dpi, n = 3) or (D) (MOI 0.01, 12 dpi, n = 3). IU/ml, infectious units/ml. (E and F) Virus titer as in (C) and (D), except with ICP0-RF HSV-1 infection and collection at (E) 1 dpi or (F) 3 dpi. (G to J) ICP4, ICP8, IFN-β, and CXCL10 mRNA levels were quantified by qPCR (ΔΔCt against GAPDH) (ICP0-RF HSV-1 MOI 5, 6 hpi, n = 3). Replicates were normalized by the average ΔIFI16 mRNA levels [(G) and (H)] or mock mRNA levels [(I) and (J)]. (K and L) ICP0-RF HSV-1–infected cell lines (MOI 5, 3 hpi) were stained for DNA-PK activation (pDNA-PK) and ICP4 expression. Representative images at 100× are shown (scale bars, 2.5 μm). Colocalization (PCC) between pDNA-PK and ICP4 was measured at the line (10 nuclei per n; n = 3). Bar plots are means ± SEM [(C) to (J)] or means ± 95% CI (L), with significance determined by two-tailed Student’s t test. n.s., not significant, *P < 0.05, **P < 0.01, ***P < 0.001, and ****P < 0.0001.
Fig. 8.
Fig. 8.. Virus-induced lactate enables immune evasion through immune signaling protein lactylation.
(1) HCMV infection causes aerobic glycolysis as part of its metabolic program, which we find to promote cell-to-cell spread by lactate-induced lysine lactylation. (2) pUL112 IDR lactylation interferes with the recruitment of pUL44 into pUL112 condensates. (3a) RBM14 IDR lactylation suppresses the innate immune functions of the HDP-RNP complex, whereas (3b) IFI16 IDR lactylation inhibits coordination with DNA-PK to enact antiviral immunity, resulting in both decreased cytokine induction and increased viral protein production.

References

    1. Girdhar K., Powis A., Raisingani A., Chrudinová M., Huang R., Tran T., Sevgi K., Dogus Dogru Y., Altindis E., Viruses and metabolism: The effects of viral infections and viral insulins on host metabolism. Annu. Rev. Virol. 8, 373–391 (2021). - PMC - PubMed
    1. Vander Heiden M. G., Cantley L. C., Thompson C. B., Understanding the Warburg effect: The metabolic requirements of cell proliferation. Science 324, 1029–1033 (2009). - PMC - PubMed
    1. Certo M., Tsai C. H., Pucino V., Ho P. C., Mauro C., Lactate modulation of immune responses in inflammatory versus tumour microenvironments. Nat. Rev. Immunol. 21, 151–161 (2021). - PubMed
    1. Tyl M. D., Betsinger C. N., Cristea I. M., Virus-host protein interactions as footprints of human cytomegalovirus replication. Curr. Opin. Virol. 52, 135–147 (2022). - PMC - PubMed
    1. Rodríguez-Sánchez I., Munger J., Meal for two: Human cytomegalovirus-induced activation of cellular metabolism. Viruses 11, 273 (2019). - PMC - PubMed

MeSH terms