. 2025 Feb 4;13(2):e0419223.
doi: 10.1128/spectrum.04192-23. Epub 2025 Jan 8.

A novel framework unveiling the importance of heterogeneous selection and drift on the community structure of symbiotic microbial indicator taxa across altitudinal gradients in amphibians

Affiliations

A novel framework unveiling the importance of heterogeneous selection and drift on the community structure of symbiotic microbial indicator taxa across altitudinal gradients in amphibians

Jin Zhou et al. Microbiol Spectr. .

Abstract

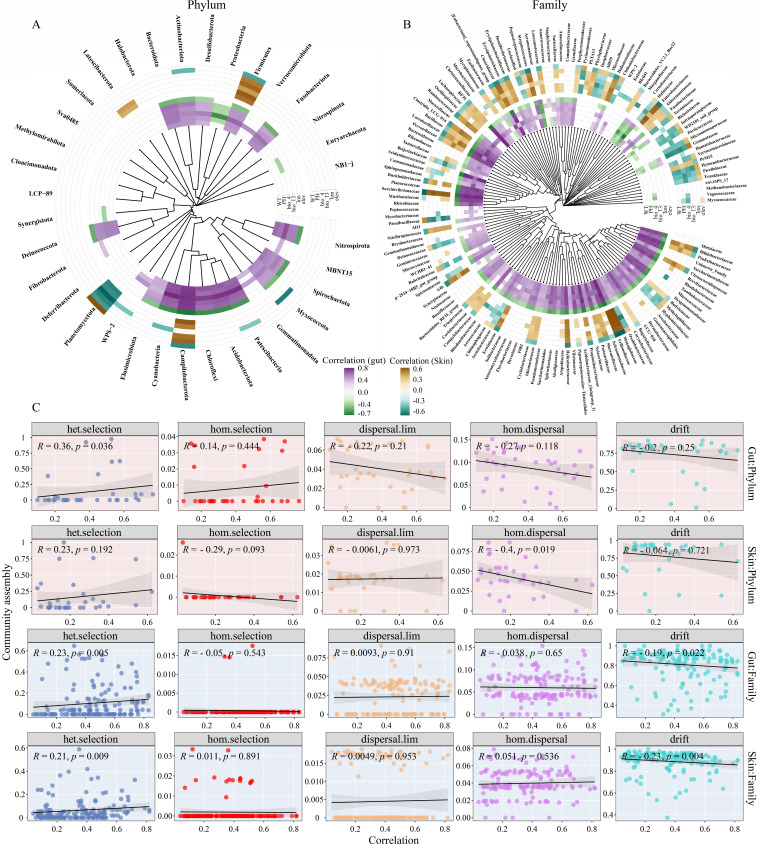
Existing analytical frameworks for community assembly have a noticeable knowledge gap, lacking a comprehensive assessment of the relative contributions of individual or grouped microbial distinct sampling units (DSUs) and distinct taxonomic units (DTUs) to each mechanism. Here, we propose a comprehensive framework for identifying DTUs/DSUs that remarkably contribute to the various mechanisms sustaining microbial community structure. Amphibian symbiotic microbes along an altitudinal gradient from Sichuan Province, China, were employed to examine the proposed statistical framework. In different altitude groups, we found that heterogeneous selection governed the community structure of symbiotic microbes across DSUs, while stochastic processes tended to increase with altitude. For DTUs at phylum and family levels, drift emerged as the dominant mechanism driving the community structure in the most symbiotic microbial taxa, while heterogeneous selection governs the most dominant or indicator taxa. Notably, the relative contribution of heterogeneous selection was significantly positively correlated with the relative abundance and niche breadth of taxa, and negatively correlated with drift. We also detected that community assembly processes remarkably regulate the structure of symbiotic microbial communities and their correlation with environmental variables. Altogether, our modeling framework is a robust and valuable tool that further enlarges our insight into microbiota community assembly.

Importance: Distinguishing the drivers regulating microbial community assembly is essential in microbial ecology. We propose a novel modeling framework to partition the relative contributions of each individual or group of microbial DSUs and DTUs into different underpinning mechanisms. An empirical study on amphibian symbiotic microbes notably enlarges insight into community assembly patterns in the herpetological symbiotic ecosystem and demonstrates that the proposed statistical framework is an informative and sturdy tool to quantify microbial assembly processes at both levels of DSUs and DTUs. More importantly, our proposed modeling framework can provide in-depth insights into microbiota community assembly within the intricate tripartite host-environment-microbe relationship.

Keywords: community assemblage; indicator taxa analysis; natural selection; neutral theory; taxon-specific effect; turnover.


Conflict of interest statement

The authors declare no conflict of interest.

Figures

Fig 1
Fig 1
Basic analysis of the structure of the symbiotic microbial community. (A) Distribution of sample points for different elevation gradients, n represents the number of samples. Free China GIS Map Files were downloaded from: https://simplemaps.com/gis/country/cn#admin1 (License: Creative Commons Attribution 4.0). Stacked map of the top 10 phyla (B) and families (C) in relative abundance. (D) Comparison of α-diversity (richness, Shannon index, and phylogenetic diversity: PD) along different altitudinal gradients. (E) Comparison of β-diversity (dissimilarities) based on the Bray–Curtis distance. The red points represent the mean values. The darker colors of green, blue, and brown represent the low-, medium-, and high-altitude grouping of gut microbes, while the corresponding lighter colors represent the low-, medium-, and high-altitude grouping of skin microbes. (F). PCoA analysis built in the Bray–Curtis distance. L_G, M_G, and H_G represent gut microbes at low, mid, and high altitudes, while L_SK, M_SK, and H_SK represent skin microbes at low, mid, and high altitudes, respectively. Significant differences (P < 0.05) between groups are represented by different superscript letters. Differences are denoted as follows: ∗P < 0.05; ∗∗P < 0.01; ∗∗∗P < 0.001.
Fig 2
Fig 2
(A) A schematic flowchart for showing the proposed modeling framework for identifying the contribution of individuals or groups of microbial distinct taxonomic units (DTUs, e.g., ASVs, family and phylum) and sampling units (DSUs, e.g., sample individual or sample grouping) on each of the underlying microbial community assembly rules. The proposed extended analyses are illustrated in the palevioletred on the right (DTUs) and the dark cyan on the left (DSUs). Detection of phylogenetic signals in gut (B) and skin (C) microorganisms along an altitudinal gradient. (D) The relative contribution of different community assembly processes along an altitudinal gradient based on the contribution analysis of DSUs. The black line represents the trend of stochasticity along the elevation gradient.
Fig 3
Fig 3
Distribution patterns in gut (A) and skin (B) microbial community structure and assembly at the phylum level along an altitudinal gradient. The innermost layer represents a clustering tree based on the Bray–Curtis distance. The penultimate layer suggests a distribution of community assembly processes. The pentagrams denote the relative abundance of taxa and the size or color represents the extent of the values (only taxa are shown with value >0). The different colors of the bars correspond to the absolute value of LDA scores of the indicator taxa for the different altitude gradients. The gray bars show the niche breadth of the taxa. The outermost layer implies the classification of different taxa, including neutral, specialist, and generalist. (C) Comparison of differences (gut minus skin) in gut and skin microbial community structure (including differences in relative abundance in the penultimate layer and differences in niche breadth in the gray bars) and community assembly (outermost heat map) at the phylum level. hom.selection: homogenizing selection; het.selection: heterogeneous selection; hom.dispersal: homogenizing dispersal; dispersal.lim: dispersal limitation.
Fig 4
Fig 4
Distribution patterns in gut (A) and skin (B) microbial community structure and assembly at the family level along an altitudinal gradient. The innermost layer represents a clustering tree based on the Bray–Curtis distance. The penultimate layer indicates a distribution of community assembly processes. The pentagrams denote the relative abundance of taxa and the size or color represents the extent of the values (only taxa are shown with value >0). The different colors of the bars correspond to the absolute value of LDA scores of the indicator taxa for the different altitude gradients. The gray bars show the niche breadth of the taxa. The outermost layer implies the classification of different taxa, including neutral, specialist, and generalist. (C) Comparison of differences (gut minus skin) in gut and skin microbial community structure (including differences in relative abundance in the penultimate layer and differences in niche breadth in the gray bars) and community assembly at the family level (only taxa with LDA scores > 0 are shown).
Fig 5
Fig 5
Relationships between the relative abundance (A) and niche breadth (B) of gut and skin microbes and distinct community assembly processes at the phylum and family levels. The solid black lines denote the fitted ordinary least-squares model, and the gray areas correspond to 95% confidence intervals of the predictor?
Fig 6
Fig 6
Spearman’s rank correlation of environmental variables with a relative abundance of symbiotic microbes at the phylum (A) and family (B) levels (only taxa with P < 0.05 are shown). The innermost heat map displays the relative abundance of gut microbes in relation to environmental factors, while the outermost heat map represents the skin microbes. (C) Spearman’s rank correlation of distinct community processes with the correlations (mean of absolute values of fitness values in all environmental factors) between environmental factors and microbial taxa relative abundance.

Similar articles

Cited by

References

    1. Zhou JZ, Ning DL. 2017. Stochastic community assembly: does it matter in microbial ecology? Microbiol Mol Biol Rev 81:e00002–e00017. doi:10.1128/MMBR.00002-17 - DOI - PMC - PubMed
    1. Xu L, Zhou J, Zheng P, Wan X, Zhu L, Huang J, Jiang J-P, Chen Y, Song Z. 2022. Seasonal variation significantly influenced the stochasticity of community assembly of amphibian symbiotic bacteria. Environ Microbiol 24:5734–5748. doi:10.1111/1462-2920.16224 - DOI - PubMed
    1. Stegen JC, Lin X, Fredrickson JK, Chen X, Kennedy DW, Murray CJ, Rockhold ML, Konopka A. 2013. Quantifying community assembly processes and identifying features that impose them. ISME J 7:2069–2079. doi:10.1038/ismej.2013.93 - DOI - PMC - PubMed
    1. Ning D, Yuan M, Wu L, Zhang Y, Guo X, Zhou X, Yang Y, Arkin AP, Firestone MK, Zhou J. 2020. A quantitative framework reveals ecological drivers of grassland microbial community assembly in response to warming. Nat Commun 11:4717. doi:10.1038/s41467-020-18560-z - DOI - PMC - PubMed
    1. Stegen JC, Lin X, Konopka AE, Fredrickson JK. 2012. Stochastic and deterministic assembly processes in subsurface microbial communities. ISME J 6:1653–1664. doi:10.1038/ismej.2012.22 - DOI - PMC - PubMed

LinkOut - more resources