. 2025 Jan 8;17(780):eadk8623.
doi: 10.1126/scitranslmed.adk8623. Epub 2025 Jan 8.

Hypoxia-inducible factor 2 regulates alveolar regeneration after repetitive injury in three-dimensional cellular and in vivo models

Affiliations

Hypoxia-inducible factor 2 regulates alveolar regeneration after repetitive injury in three-dimensional cellular and in vivo models

A Scott McCall et al. Sci Transl Med. .

Abstract

Idiopathic pulmonary fibrosis (IPF) is a progressive interstitial lung disease in which repetitive epithelial injury and incomplete alveolar repair result in accumulation of profibrotic intermediate/transitional "aberrant" epithelial cell states. The mechanisms leading to the emergence and persistence of aberrant epithelial populations in the distal lung remain incompletely understood. By interrogating single-cell RNA sequencing (scRNA-seq) data from patients with IPF and a mouse model of repeated lung epithelial injury, we identified persistent activation of hypoxia-inducible factor (HIF) signaling in these aberrant epithelial cells. Using mouse genetic lineage-tracing strategies together with scRNA-seq, we found that these disease-emergent aberrant epithelial cells predominantly arose from airway-derived (Scgb1a1-CreER-traced) progenitors and exhibited transcriptional programs of Hif2a activation. In mice treated with repetitive intratracheal bleomycin, deletion of Epas1 (Hif2a) but not Hif1a, from airway-derived progenitors, or administration of the small-molecule HIF2 inhibitor PT-2385, using both prevention and rescue approaches, attenuated experimental lung fibrosis, reduced the appearance of aberrant epithelial cells, and promoted alveolar repair. In mouse alveolar organoids, genetic or pharmacologic inhibition of Hif2 promoted alveolar differentiation of airway-derived epithelial progenitors. In addition, treatment of human distal lung organoids with PT-2385 increased colony-forming efficiency, enhanced protein and transcriptional markers of alveolar type 2 epithelial cell maturation, and prevented the emergence of aberrant epithelial cells. Together, these studies showed that HIF2 activation drives the emergence of aberrant epithelial populations after repetitive injury and that targeted HIF2 inhibition may represent an effective therapeutic strategy to promote functional alveolar repair in IPF and other interstitial lung diseases.


Conflict of interest statement

JAK reports research grants/contracts from Boehringer Ingelheim and Bristol-Myers-Squibb, and consulting for APIE and ARDA. TSB reports research grants/contracts from Boehringer Ingelheim, Bristol-Myers-Squibb and Morphic. NEB reports consulting for Deepcell. The other authors report no competing interests.

Figures
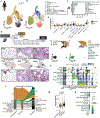
Figure 1.
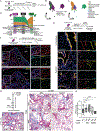
Figure 1.. Recurrent injury leads to persistent activation of HIF-regulated programs in the lung epithelium.
(A and B) UMAP embedding of scRNA-seq of 194,132 epithelial cells from 67 PF and 49 control lungs from GSE227136 (20). Circle highlights disease-emergent KRT5KRT17+ cells. (C) Pathway analysis of differentially expressed genes with Log2-fold change >1 for KRT5KRT17+ cells. (D) Hypoxia gene module score (calculated from genes extracted from ARCHs4 transcription factor analysis of HIF1A and EPAS1 of genes in (C) with statistically significant increase (p<2×10¹⁶) pairwise Wilcoxon analysis adjusted for multiple comparisons). (E) Schematic of single-dose and repetitive intratracheal (IT) bleomycin mouse models. (F to H) Hematoxylin & Eosin (H&E) stains of representative lung sections from unchallenged mice (F) and mice following single-dose (SD Bleo, G) or repetitive IT bleomycin (Rep Bleo, H). Top images demonstrate overall architectural changes. Center panels show whole lung slices. Bottom panels show representative epithelial changes.. Scale bar = 50μm. (I and J) UMAP embedding of 6,583 cells from unchallenged, SD Bleo and Rep Bleo mice obtained following FACS-based Cd326+ enrichment and 10X 5’ scRNA-seq. These data were jointly analyzed, embedded and annotated with other murine scRNA-seq (fig S1) for consistency across figures. (K) Dot plot of marker genes driving cell type annotation. (L) Alluvial plot showing proportional cell population changes between unchallenged, SD Bleo, and Rep Bleo mouse lungs, as determined by scRNA-seq. (M) Violin plot of Mouse MSigDB hypoxia module in mice (207 genes) across all epithelial cells from unchallenged, SD Bleo and Rep Bleo mice. Additional analysis by cell type is shown in fig. S2. (N) Dot plot of Hif1 and Epas1 expression across different cell clusters
Figure 2.
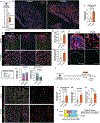
Figure 2.. Epithelial deletion of Hif1a and Epas1 modulates dynamics from recurrent injury and attenuates experimental fibrosis.
(A) Dosing and mouse genotype schematic of WT and Hif1/2Δepi mice. (B) Masson Trichrome stained images of the different fibrotic responses modulated by combined epithelial Hif1a and Epas1 deletion. Scale bar = 100μm. (C) Percent area per 20x field of hyperplastic epithelial cells. Plotted as median ±95% CI. (D) Histologic quantification of fibrotic area by masking. Plotted as median ±95% CI. (E) Collagen content (Sircol soluble assay) analysis of right lower lobe (RLL). Data plotted as median ±95% CI. (F) UMAP embedding of 5,105 sorted epithelial cells from WT and Hif1/2Δepi mice showing genotype and treatment distribution. Data are pooled from N=3 mice per genotype and treatment condition. (G) UMAP of cell type annotation. Cells from Hif1/2Δepi were embedded and jointly annotated (see fig. S1). Unchallenged and Rep Bleo WT mice are re-presented for clarity across figures. (H) Alluvial plots of cell proportion comparing genotype and response to Rep Bleo. (I) RNA-ISH for Muc5b and IF of Scgb1a1 from repetitive bleomycin treated Hif1/2Δepi and control mice. Scale bar = 100 μm. (J and K) Quantitation of Muc5b and Scgb1a1 cell proportion following Rep Bleo from 10 independent 40x fields across n=4 mice from each genotype. Airways masked for analysis. Plotted as mean ±SD. Two-way analysis of variance (ANOVA) was performed, p-value reported from genotype contribution to variance. (L) Gene co-expression module enrichment analysis of the airway compartment (BASC, Secretory, Secretory-Muc5b+, Basal). Colored by Net enrichment (NES) and plotted by Z-score. Selected genes are presented from hubs within the modules and MSigDB pathway analysis of all module related genes. Table of gene modules, enrichment, top 30 gene hubs, and statistical analysis appears in Data file S1). Additional analysis of module enrichment per cell type and specific Protein-Protein interaction analysis appears in figs. S2 and S4).
Figure 3.
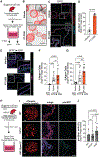
Figure 3.. Airway-derived progenitors show Hif2-predominant activation in chronic injury.
(A) Schematic for lineage-labeled Sftpc- or Scgb1a1-dTom mice with repetitive bleomycin injury and subsequent flow-cytometry based dTom+ sorting strategy for scRNA-seq. (B and C) UMAP embeddings of 7629 cells by lineage line and by cell type. (D) Alluvial plot comparing lineage-labeled (dTom+) cell proportions from Scgb1a1-traced (left) or Sftpc-traced (right) mice compared to total epithelial cells recovered from Rep Bleo injured mice. (E) Representative immunofluorescence images of Scgb1a1-traced Rep Bleo injured mice treated with Pimonidazole (Pim, 100 mg/kg) 2 hours prior harvest (detecting intracellular hypoxia or changed redox state, shown in magenta) colocalizing with tDtomato linage-label (red), airway (Scgb1a1, yellow) and alveolar (pro-SPC, aqua) markers. Pim+dTom+ cells are annotated within the airway (*) and in the parenchyma (white arrowheads) with variable Scgb1a1-protein staining. Scale bar = 100 μm. (F) Co-staining of Scgb1a1-lineage label with Hif1 or Hif2 using serial sections from Rep Bleo-injured mice. The top subpanel depicts an overview of the experimental design where Scgb1a1-lineage tracing mice were treated with tamoxifen followed by IT bleomycin every 2 weeks × 6 cycles followed by sacrifice 14 days after the final bleomycin dose. The lower subpanels demonstrate immunofluorescence staining for Hif1 or Hif2 (each in aqaua, top and bottom respectively) colocalized with tDtomato lineage label (red), and Scgb1a1 (yellow). White arrowheads indicate cells with nuclear (active) Hif2 in expanded region. (*) indicates Hif-positive cells of interest, for Hif1, cell showing Hif1+ are within the LMSB. Quantitation of nuclear (active) Hif1 and Hif2 is shown in fig. S4. LMSB = Left mainstem Bronchus, PA = Pulmonary artery. Scale bar = 100 μm. Additional data are shown in fig. S6A–D. (G) Fibrosis analysis from wild-type (WT), Sftpc-CreER; Hif1a or Epas1 and Scgb1a1-CreER; Hif1a or Epas1 conditional knockout mice subjected to repetitive bleomycin exposure. Schematic depicts the experimental design wherein WT and Sftpc-CreER or Scgb1a1-CreER, Hif1a or Epas1 floxed mice were administered tamoxifen followed by a minimum 2-week washout then challenged with IT bleomycin every 2 weeks × 8 cycles (0.04 IU/dose x4 cycles followed by 0.08 IU × 4 cycles). Scale bar = 200 μm. (H) Fibrotic area of parenchyma was determined by quantification of Masson Trichome images. Detailed methodology can be found in the Supplementary Materials and Methods. Data are plotted as median with Min and Max whiskers. Following normality testing, a Welch ANOVA was used. ANOVA p = 0.0024, post-hoc comparisons only calculated for comparison to WT and depicted in the figure.
Figure 4.
Figure 4.. Pharmacologic inhibition of Hif2 enhances airway-derived adaptive epithelial repair following recurrent injury.
(A) Schematic of Rep Bleo in Scgb1a1 lineage labeled mice with bi-weekely IT bleomycin. The Osmotic pumps containing PT-2385 (propylene glycol/DMSO vehicle) were implanted subcutaneously 1 week following the initial dose of bleomycin and were then replaced with fresh pumps following the fourth bleomycin administration. Mice were harvested for analysis two weeks following the sixth IT bleomycin dose. (B) Stitched images of Scgb1a1-lineage labeled cells in Vehicle vs PT-2385 from repetitive bleomycin treated mice. Scale bar = 1mm. dTomato = red, Scgb1a1 = yellow,.(C) Quantification of dTomato+ Scgb1a1-lineage-derived cells outside airways. N=6 mice for control, N=4 for PT-2385 with at least 4 sections per mouse quantified. Plotted as median ±95% CI. (D) IF of pro-Spc (aqua), Ager (yellow), and Scgb1a1-lineage labeled dTomato (magenta). Scale bar = 50 μm. (E and F) Quantification of pro-Spc (E) and Ager (F) with dTomato dual positivity. Two 5×5 stitched images were quantified per mouse comprising between 7900 to 15000 cells per field were quantified. Plotted as median ±95% CI. For F, Welch’s test was used in accordance with a non-significant variance difference. (G) Combined RNA-ISH (Muc5b [aqua], and Scgb3a2 [magenta]) and IF (Scgb1a1 [green], dTomato [red]). Dotted line delineates the airway from adjacent parenchymal structures. Scale bar = 50 μm. (H and I) 10 separate images from N=6 vehicle and N=4 PT-2385 mice were masked to delineate airway (H) from parenchyma (I) and analyzed based on lineage and markers. Two-way ANOVA was performed. p-value reported from drug contribution to variance. (J) Schematic of ‘rescue’ treatment with PT-2385 after Rep Bleo in Scgb1a1 lineage-labeled mice with bi-weekly IT bleomycin. The osmotic pumps containing PT-2385 (propylene glycol/DMSO vehicle) were implanted subcutaneously 1 week following the fourth dose of bleomycin and allowed to heal for a further 28 days before harvest. (K) Stitched 5×5 IF images of pro-Spc (aqua), Hopx (yellow), and Scgb1a1-lineage label dTomato (red). Scale bar = 200 μm. (L to N) Quantification of dTomato+ parenchymal cells as a percentage of total cells (L), pro-Spc (M), andHopx with dTomato lineage label (N) as a fraction of the total marker pool (total Spc+-cells) after rescue treatment with PT-2385. N=6 control and N-=4 PT-2385. Three 5×5 stitched images were quantified per mouse comprising between 36,883 and 58,213 total cells per mouse. Plotted as median ±95% CI. Mann Whitney U test. (O) Proportional outcome analysis of parenchymal Scgb1a1 lineage-derived cells based on alveolar markers (pro-Spc and Hopx) as well as dual-positive cells. Plotted as mean±SD. Two way ANOVA was performed. P-value reported is for the interaction term between drug and cell proportion. Additional imaging of dual positive cells appears in fig. S6C.
Figure 5.
Figure 5.. Inhibiting Hif2 promotes alveolar fate of airway-derived progenitors.
(A) Schematic of FACS sorting of Scgb1a1-lineage labeled cells for subsequent organoid culture derived from pooled cells from three mice. (B) Stitched overlay projection of brightfield and dTomato fluorescence of SFFF organoid outgrowth after 10 days. Scale bar = 1mm. (C) IF of organoids for pro-Spc (aqua) and dTom+ (red) cells. Scale bar = 100 μm, inset scale bar = 50 μm. (D) Quantification of pro-Spc+ Scgb1a1-lineage labeled cells per field of organoid, n=10 organoids per group across three technical replicate wells. (E) AT1-marker (Hopx [green], Ager [magenta]) staining of Scgb1a1-derived organoids after 7 days of SFFFM expansion followed by transition to ADM for an additional 6 days. Scale bar = 100 μm, inset scale 50 μm. (F and G) Quantification of Hopx and Ager IF. Unique fields (comprising different organoids) spanning 2 technical replicates are displayed. Kruskal-Wallis test, p-values reported for post-hoc comparisons with Dunn correction for multiple comparisons. (H) Schematic of FACS sorted of Scgb1a1-lineage labeled Hif1a or Epas1 conditionally deleted cells for subsequent organoid culture derived from pooled cells from five mice. (I) Left column: Live whole-well fluorescent imaging of dTomato in respective droplets. Scale bar 1 mm. Center and right columns show IF of fixed organoids for pro-Spc and dTom+ cells. Scale bar = 100 μm. Protein confirmation of knockout is shown in fig. S8. (J) Quantification of pro-Spc+ Scgb1a1-lineage labeled cells per field of organoid, 15 non-overlapping organoids per group across five technical replicate wells were imaged. Plotted as median ±95% CI. Kruskal-Wallis test, p values reported for post-hoc comparisons with Dunn correction for multiple comparisons.
Figure 6.
Figure 6.. Inhibiting HIF2 enhances human alveolar organoid growth and prevents the emergence of aberrant intermediate cells.
(A) Human organoid generation using declined donor tissue or ILD explants via CD326 enrichment and culture in SFFFM. (B) Brightfield and Lysotracker images of Vehicle and PT-2385-treated organoids (passage 1). Scale bar = 1mm. (C) Quantification of outgrowth from vehicle and PT-2385-treated organoids at 14d of passage 1. Analyzed with Welch’s t-test after ensuring variance did not significantly differ. (D) UMAP embedding of cell cluster annotation for 8694 cells across Vehicle (DMSO) and PT-2385 treatments. Treatment group embeddings appear in fig. S9. (E) Abbreviated dot plot for cluster annotation and marker gene expression. (F) Jaccard analysis of cluster-specific DE-genes (Log2FC>0.5 and p<0.001) between the Aberrant intermediate cluster and full lung epithelial dataset shown in Fig. 1A. (G) Alluvial plot comparing cell proportions between Vehicle or PT-2385 (20 μM) - treated organoids. (H) RNA velocity stream embeddings (left) and PAGA representations (right) for trajectory analyses of separately analyzed Vehicle and PT-2385 organoids demonstrating different dynamics between clusters, particularly within the RASC-AT2 cluster based on HIF2 inhibition. Further latent time embedding, differentially predicted terminal states and absorption probabilities appear in fig. S12 (I) Violin plot of Vimentin (VIM) expression across cell types. (J) Modeled VIM, SCGB3A2, and SFTPC marker gene expression along Cellrank-estimated latent time trajectory for Aberrant intermediate cells. (K) Representative IF of isolated organoids stained for Vimentin (magenta), HIF2α (yellow) and their colocalization. Dotted lines delineate internal cavities of organoids for context. Asterisks indicate cells with both HIF2a nuclear localization and cytoplasmic Vimentin. Scale bar = 50 μm. (L and M) Quantification of Vimentin (L) and nuclear HIF2α (M). 5 different organoids quantified across two technical replicates. Plotted as median ±95% CI.

References

    1. King TE Jr, Bradford WZ, Castro-Bernardini S, Fagan EA, Glaspole I, Glassberg MK, Gorina E, Hopkins PM, Kardatzke D, Lancaster L, Lederer DJ, Nathan SD, Pereira CA, Sahn SA, Sussman R, Swigris JJ, Noble PW, ASCEND Study Group A phase 3 trial of pirfenidone in patients with idiopathic pulmonary fibrosis. N. Engl. J. Med 370, 2083–2092 (2014). - PubMed
    1. Richeldi L, du Bois RM, Raghu G, Azuma A, Brown KK, Costabel U, Cottin V, Flaherty KR, Hansell DM, Inoue Y, Kim DS, Kolb M, Nicholson AG, Noble PW, Selman M, Taniguchi H, Brun M, Le Maulf F, Girard M, Stowasser S, Schlenker-Herceg R, Disse B, Collard HR, INPULSIS Trial Investigators, Efficacy and safety of nintedanib in idiopathic pulmonary fibrosis. N. Engl. J. Med 370, 2071–2082 (2014). - PubMed
    1. Lederer DJ, Martinez FJ, Idiopathic Pulmonary Fibrosis. N. Engl. J. Med 378, 1811–1823 (2018). - PubMed
    1. Seibold MA, Wise AL, Speer MC, Steele MP, Brown KK, Loyd JE, Fingerlin TE, Zhang W, Gudmundsson G, Groshong SD, Evans CM, Garantziotis S, Adler KB, Dickey BF, du Bois RM, Yang IV, Herron A, Kervitsky D, Talbert JL, Markin C, Park J, Crews AL, Slifer SH, Auerbach S, Roy MG, Lin J, Hennessy CE, Schwarz MI, Schwartz DA, A common MUC5B promoter polymorphism and pulmonary fibrosis. N. Engl. J. Med 364, 1503–1512 (2011). - PMC - PubMed
    1. Thomas AQ, Lane K, Phillips J 3rd, Prince M, Markin C, Speer M, Schwartz DA, Gaddipati R, Marney A, Johnson J, Roberts R, Haines J, Stahlman M, Loyd JE, Heterozygosity for a surfactant protein C gene mutation associated with usual interstitial pneumonitis and cellular nonspecific interstitial pneumonitis in one kindred. Am. J. Respir. Crit. Care Med 165, 1322–1328 (2002). - PubMed

Substances

LinkOut - more resources