. 2025 Feb 19;91(2):e0059124.
doi: 10.1128/aem.00591-24. Epub 2025 Jan 7.

Nitrogen source type modulates heat stress response in coral symbiont (Cladocopium goreaui)

Affiliations

Nitrogen source type modulates heat stress response in coral symbiont (Cladocopium goreaui)

Yulin Huang et al. Appl Environ Microbiol. .

Abstract

Ocean warming due to climate change endangers coral reefs, and regional nitrogen overloading exacerbates the vulnerability of reef-building corals as the dual stress disrupts coral-Symbiodiniaceae mutualism. Different forms of nitrogen may create different interactive effects with thermal stress, but the underlying mechanisms remain elusive. To address the gap, we measured and compared the physiological and transcriptional responses of the Symbiodiniaceae Cladocopium goreaui to heat stress (31°C) when supplied with different types of nitrogen (nitrate, ammonium, or urea). Under heat stress (HS), cell proliferation and photosynthesis of C. goreaui declined, while cell size, lipid storage, and total antioxidant capacity increased, both to varied extents depending on the nitrogen type. Nitrate-cultured cells exhibited the most robust acclimation to HS, as evidenced by the fewest differentially expressed genes (DEGs) and less ROS accumulation, possibly due to activated nitrate reduction and enhanced ascorbate biogenesis. Ammonium-grown cultures exhibited higher algal proliferation and ROS scavenging capacity due to enhanced carotenoid and ascorbate quenching, but potentially reduced host recognizability due to the downregulation of N-glycan biosynthesis genes. Urea utilization led to the greatest ROS accumulation as genes involved in photorespiration, plant respiratory burst oxidase (RBOH), and protein refolding were markedly upregulated, but the greatest cutdown in photosynthate potentially available to corals as evidenced by photoinhibition and selfish lipid storage, indicating detrimental effects of urea overloading. The differential warming nitrogen-type interactive effects documented here has significant implication in coral-Symbiodiniaceae mutualism, which requires further research.IMPORTANCERegional nitrogen pollution exacerbates coral vulnerability to globally rising sea-surface temperature, with different nitrogen types exerting different interactive effects. How this occurs is poorly understood and understudied. This study explored the underlying mechanism by comparing physiological and transcriptional responses of a coral symbiont to heat stress under different nitrogen supplies (nitrate, ammonium, and urea). The results showed some common, significant responses to heat stress as well as some unique, N-source dependent responses. These findings underscore that nitrogen eutrophication is not all the same, the form of nitrogen pollution should be considered in coral conservation, and special attention should be given to urea pollution.

Keywords: coral reefs; heat stress; nitrogen pollution; symbiotic microalgae; transcriptome.


Conflict of interest statement

The authors declare no conflict of interest.

Figures
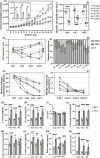
Fig 1
Fig 1
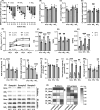
Heat stress responses of cell population growth, cell cycle, cell size, and cellular biochemical composition of C. goreaui. (A) Growth curve. (B) Specific cell growth rate. (C) Cell diameter. (D) Relative abundances of cells in different cell cycle phases (%). (E) Temporal change of media nitrogen concentrations. (F) Nitrogen uptake rates. (G-I) Cellular carbon, nitrogen contents, and C:N ratio. (J-N) Cellular sugar, amino acid, protein, RNA, and lipid contents. The inset in panel A shows the maximum cell concentration throughout the experimental period. Asterisks indicate statistically significant differences (*P<0.05, **P<0.01, ***P < 0.001) between two temperature treatments within the same N group. Different letters indicate significant differences between nutrient treatments under the same temperature condition. The data are mean ± SD (n = 3).
Fig 2
Fig 2
Heat stress responses of photosynthesis parameters, ROS, and anti-oxidant capacity in C. goreaui. (A) Temporal trends of differences in the Fv/Fm ratio between 31°C and 25°C, (Fv/Fm)31- (Fv/Fm)25. (B-D) Cellular chlorophyll a, chlorophyll c, and carotenoid contents. (E) Temporal trends of maximal relative electron transport rates. (F-H) Effective PSII photochemical efficiency, quantum yield of PSII non-regulated non-photochemical energy loss and quantum yield of PSII regulated non-photochemical energy loss. (I) Cellular ROS level. (J-L) Antioxidant capacity measured by different assays (ΑΒΤS, DPPH, and FRAP assays). (M) Nitrate reductase activity. (N-O) Western blotting of Rubisco and D1 protein of C. goreaui cells and the derived heatmap. Asterisks indicate significant statistical differences between two temperature treatments within the same nitrogen group (*P < 0.05, **P < 0.01, ***P < 0.001). Different letters indicate significant differences between nutrient treatments under the same temperature condition. The data in the bar charts are mean ± SD (n = 3). Original Western blot photos are provided in Fig. S5.
Fig 3
Fig 3
Transcriptomic responses to HS in C. goreaui. (A) Principal component analysis of transcriptomic data. (B) Venn diagram of HS-DEGs in the three different nutrient groups. (C) Heatmap of 215 HS-DEGs shared among the three nutrient groups. (D-E) KEGG enrichment of significantly HS-upregulated genes (D) and HS-downregulated genes (E).
Fig 4
Fig 4
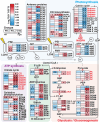
Schematic of transcriptional responses of N assimilation and protein biosynthesis to HS in C. goreaui. The numbers inside rectangles, from left to right, represent the count of up- or downregulated genes (indicated by arrows preceding the number)/the total number of regulated genes in the NH4+, NO3-or Urea group. Rectangles filled with pink or orange color indicate HS-upregulated genes, while blue or green color indicates HS-downregulated genes. Pink and blue colors signify numbers calculated from HS-DEGs, while the orange and green colors represent numbers calculated from significantly regulated genes (Q < 0.05 but with 2/3 ≤ FC(31°C/25°C) ≤3/2). Detailed gene descriptions can be found in Table S3.
Fig 5
Fig 5
Heatmap of HS-DEGs involved in photosynthesis, carbon fixation, glycolysis/gluconeogenesis, starch metabolism, and lipid metabolism. The fill color of the rectangles from left to right represents the log2 fold change (log2FC) of 31°C compared with 25°C. HS-DEGs are marked as two asterisks inside rectangles, while those with Q-value < 0.05 but with 2/3 ≤ FC(31°C/25°C) ≤3/2 are marked as one asterisk. Metabolite abbreviations: G6P, glucose 6-phosphate; F6P, fructose 6-phosphate; F1,6P, fructose 1,6-biphosphate; G3P, glyceraldehyde 3-phosphate; PEP, phosphoenolpyruvate; G1P, glucose 1-phosphate; TAG: triacylglycerol. Detailed gene descriptions can be found in Table S4.
Fig 6
Fig 6
Lipid biosynthesis-related genes significantly regulated under HS. Every dot represents one gene. Dash lines indicate thresholds of HS-DEG where FC(31°C/25°C) =3/2 or 2/3. Metabolite abbreviations: CoA, coenzyme A; ACP, acyl carrier protein; G3P, glyceraldehyde 3-phosphate; TAG, triacylglycerol. Detailed gene descriptions can be found in Table S4.
Fig 7
Fig 7
Heatmap of HS-DEGs involved in ROS homeostasis and cross-plasma membrane transport. HS-DEGs are marked as two asterisks inside rectangles while those with Q-value < 0.05 but with 2/3 ≤ FC(31 °C/25 °C) ≤3/2 are marked as one asterisk. Detailed gene descriptions can be found in Table S5.
Fig 8
Fig 8
Schematic of potential impacts of heat stress in C. goreaui on symbiosis with coral under different types of N. Arrows represent directions of material flux and T-bar arrows indicate inhibited or alleviated effects. Green arrows indicate decreased material flux, while orange arrows indicate increased material flux. The letter “T” and “P” denote conclusions supported by transcriptome data and physiological data, respectively.

Similar articles

References

    1. Souter D, Planes S, Wicquart J, Obura D, eds. 2021. Status of coral reefs of the world: 2020. Global Coral Reef Monitoring Network (GCRMN) and International Coral Reef Initiative (ICRI).
    1. Falkowski PG, Dubinsky Z, Muscatine L, Porter JW. 1984. Light and the bioenergetics of a symbiotic coral. Bioscience 34:705–709. doi:10.2307/1309663 - DOI
    1. Muscatine L, Falkowski PG, Porter JW, Dubinsky Z. 1984. Fate of photosynthetic fixed carbon in light- and shade-adapted colonies of the symbiotic coral Stylophora pistillata. Proc R Soc Lond B 222:181–202. doi:10.1098/rspb.1984.0058 - DOI
    1. Davy SK, Allemand D, Weis VM. 2012. Cell biology of cnidarian-dinoflagellate symbiosis. Microbiol Mol Biol Rev 76:229–261. doi:10.1128/MMBR.05014-11 - DOI - PMC - PubMed
    1. Muller-Parker G, D’Elia CF, Cook CB. 2015. Interactions between corals and their symbiotic algae, p 99–116. Springer Netherlands.

LinkOut - more resources