. 2025 Dec;17(1):2442750.
doi: 10.1080/19420862.2024.2442750. Epub 2025 Jan 8.

Prediction of protein biophysical traits from limited data: a case study on nanobody thermostability through NanoMelt

Affiliations

Prediction of protein biophysical traits from limited data: a case study on nanobody thermostability through NanoMelt

Aubin Ramon et al. MAbs. 2025 Dec.

Abstract

In-silico prediction of protein biophysical traits is often hindered by the limited availability of experimental data and their heterogeneity. Training on limited data can lead to overfitting and poor generalizability to sequences distant from those in the training set. Additionally, inadequate use of scarce and disparate data can introduce biases during evaluation, leading to unreliable model performances being reported. Here, we present a comprehensive study exploring various approaches for protein fitness prediction from limited data, leveraging pre-trained embeddings, repeated stratified nested cross-validation, and ensemble learning to ensure an unbiased assessment of the performances. We applied our framework to introduce NanoMelt, a predictor of nanobody thermostability trained with a dataset of 640 measurements of apparent melting temperature, obtained by integrating data from the literature with 129 new measurements from this study. We find that an ensemble model stacking multiple regression using diverse sequence embeddings achieves state-of-the-art accuracy in predicting nanobody thermostability. We further demonstrate NanoMelt's potential to streamline nanobody development by guiding the selection of highly stable nanobodies. We make the curated dataset of nanobody thermostability freely available and NanoMelt accessible as a downloadable software and webserver.

Keywords: Biological sciences – biophysics and computational biology; Protein fitness; antibody design; antibody engineering; ensemble model; machine learning; nanobody; semi-supervised learning; thermostability.


Conflict of interest statement

No potential conflict of interest was reported by the author(s).

Figures

Figure 1.
Figure 1.
Framework for protein biophysical trait prediction with limited data. (a) Model architecture (green): sequences from a labeled protein database (black box) are represented using multiple embeddings (e.g., ESM-1b, one-hot, VHSE) and processed through various regression models (e.g., ridge, GPR, RF, SVR). The top-performing models for each embedding are combined into a ridge-based ensemble model. (b) Training and testing framework (blue): the dataset is clustered by experimental method (e.g., nanoDSF, DSF, DSC, CD in the example of thermostability measurements) and sequence similarity via k-medoids clustering. Stratification ensures consistent class distribution across training (yellow) and testing (blue) splits. Repeated nested cross-validation includes an inner loop for hyperparameter tuning (grey and green) within an outer loop for model testing (yellow and blue), repeated with three random seeds to report averaged performances and their standard deviations. (c) Performance assessment (red): Model performance is evaluated using Pearson’s correlation (r), Spearman’s correlation (ρ), mean absolute error (MAE), and standard deviation ratio (SDR), which indicates the model’s tendency to regress towards the dataset mean – a common issue with limited data.
Figure 2.
Figure 2.
Expansion of nanobody thermostability data. (a) Nanobody thermostability characterization pipeline: the intrinsic fluorescence of 129 nanobodies was measured at increasing temperatures using nanoDSF. The resulting melting curves were fitted to a two-state protein denaturation model to determine the apparent melting temperatures (Tm) (see materials and methods). These Tm values are then used as labels to train and test our stability predictor, alongside measurements from the literature. (b) Fitted Tm for the 129 characterized nanobodies: bar heights are the mean Tm from duplicate measurements from separate runs, and error bars the standard deviation. The average error is 0.26°C, indicating excellent consistency between measurements.
Figure 3.
Figure 3.
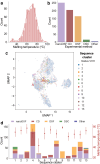
Overview of the nanobody thermostability dataset. (a) Histogram showing the distribution of apparent melting temperatures (°C) across the dataset. (b) Bar plot depicting the distribution of the experimental methods used. (c) UMAP projection (n_neighbors = 20) of the ESM-1b representation of 10,000 native nanobody sequences from the AbNatiV dataset (in grey) overlaid with the 640 sequences from our dataset. Sequences are colour-coded according to their k-medoids cluster number (see materials and methods). (d) Bar plot showing the distribution of experimental methods used within the 13 k-medoids sequence clusters (as coloured in panel c). The average melting temperature and standard deviation for each cluster are indicated by the red points (right y-axis). Further details on dataset’s CDR3-length and germline diversity are provided in figure S5.
Figure 4.
Figure 4.
Performance evaluation of regression models for ensemble learning. (a) Spearman’s coefficient for selected regression models across different embeddings using repeated nested stratified cross-validation. Each colour represents a regression method (see legend). Triangle markers indicate performance on the training set, while round markers indicate performance on the test set. Error bars denote standard deviations across cross-validation folds and repeats. (b) Test-set Spearman’s coefficient and (c) SDR performances for the ridge stacking ensemble (in solid line) and the averaged ensemble (in dotted line) using input predictions from different model selections: top-performing models across diversified embeddings (green, Table 1); top-performing embeddings with diversified regression models (purple, table S3); and top-performing combinations of embedding and model from nested stratified cross-validation (red, table S3).
Figure 5.
Figure 5.
Test performance of the ensemble model across the nanobody dataset. Test-set prediction versus measured Tm from the final ensemble model, which consists in ridge regression stacking of models trained on diverse embeddings. For each nanobody, the prediction corresponds to the test prediction from the outer test fold of the nested cross-validation, averaged over three repeats. Error bars indicate the standard deviation of the predictions over the three pipeline repeats. The average standard deviation of the predictions over the repeats reaches 1.3°C. Scatter point colours represent the sequence k-medoids cluster of each nanobody. The reported Pearson’s correlation (r), Spearman’s correlation (ρ), MAE, and standard deviation ratio (SDR) are averaged across all outer test folds and repeats of the nested cross-validation, with corresponding standard deviations. The SDR assesses the model’s tendency to regress towards the mean value of the dataset. Overall performance metrics for the plotted data are r = 0.862, ρ = 0.845, MAE = 3.9°C, and SDR = 0.84.
Figure 6.
Figure 6.
Real-world application of NanoMelt to sequences distant from those in Tm dataset. (a) SDS-page analysis of mammalian cell supernatants transiently transfected with six selected nanobodies (header). The “no Nb” lane represents the supernatant of cells not overexpressing a nanobody, serving as a negative control. The Nb6 sample was run on a separate gel (see fig. S12 for the uncropped images and additional results from repeated independent transfections). Green arrows indicate the nanobody bands at the expected molecular weight (confirmed by Mass spec, table S6), a red cross denotes lack of expression, and a grey tick indicates successful expression. (b) Table summarising the predicted Tm, measured Tm, prediction error, CamSol intrinsic solubility score, AbNatiV VHH-nativeness, and percentage dissimilarity from the closest sequence in the Tm dataset. Cells related to biophysical traits are colour-coded green, yellow, and red to represent favourable, intermediate, and unfavourable traits, respectively. (c) Prediction performances of NanoMelt on 83 external nanobody sequences (80 from various sources, plus the 3 that expressed from panel b). The Pearson’s correlation (r), Spearman’s correlation (ρ), MAE, and SDR are reported. Points are coloured based on sequence dissimilarity to the closest sequence in the training set. 31 sequences have a dissimilarity to the training set above 10%. Colouring based on the measurement technique is presented in figure S14. The grey line is the unity line.

Similar articles

References

    1. Molina RS, Rix G, Mengiste AA, Álvarez B, Seo D, Chen H, Hurtado JE, Zhang Q, García-García JD, Heins ZJ, et al. In vivo hypermutation and continuous evolution. Nat Rev Methods Primer. 2022;2(1):1–16. doi:10.1038/s43586-022-00119-5. - DOI - PMC - PubMed
    1. Kim JY, Yoo H-W, Lee P-G, Lee S-G, Seo J-H, Kim B-G.. In vivo protein evolution, next generation protein engineering strategy: from random approach to target-specific approach. Biotechnol Bioprocess Eng. 2019;24(1):85–94. doi:10.1007/s12257-018-0394-2. - DOI
    1. Meier J, Rao R R, Verkuil R, Liu J, Sercu T, Rives A.. Language models enable zero-shot prediction of the effects of mutations on protein function in. In: Ranzato M, Beygelzimer A, Dauphin Y, Liang PS, Wortman Vaughan J, editors. Advances in neural information processing systems. Red Hook, NY, USA: Curran Associates, Inc.; 2021. p. 29287–29303.
    1. Lin Z, Akin H, Rao R, Hie B, Zhu Z, Lu W, Smetanin N, Verkuil R, Kabeli O, Shmueli Y, et al. Evolutionary-scale prediction of atomic-level protein structure with a language model. Science. 2023;379(6637):1123–1130. doi:10.1126/science.ade2574. - DOI - PubMed
    1. Jumper J, Evans R, Pritzel A, Green T, Figurnov M, Ronneberger O, Tunyasuvunakool K, Bates R, Žídek A, Potapenko A, et al. Highly accurate protein structure prediction with AlphaFold. Nature. 2021;596(7873):583–589. doi:10.1038/s41586-021-03819-2. - DOI - PMC - PubMed

Substances

LinkOut - more resources