. 2025 Jan;292(2038):20242331.
doi: 10.1098/rspb.2024.2331. Epub 2025 Jan 8.

The importance of peripheral populations in the face of novel environmental change

Affiliations

The importance of peripheral populations in the face of novel environmental change

Samantha Hoff et al. Proc Biol Sci. 2025 Jan.

Abstract

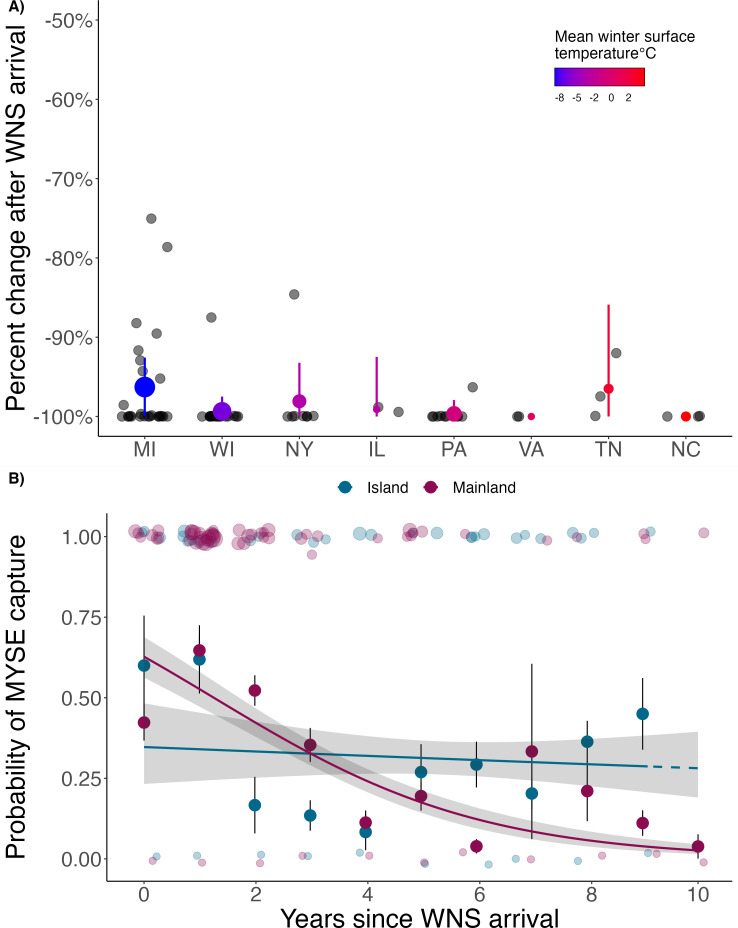
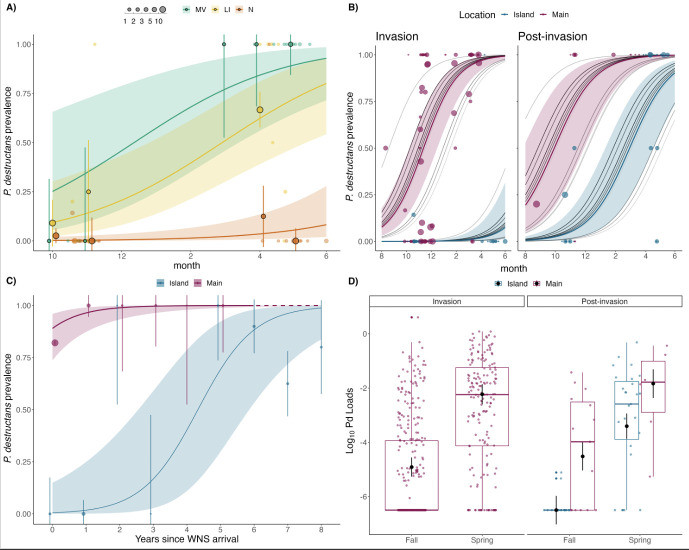
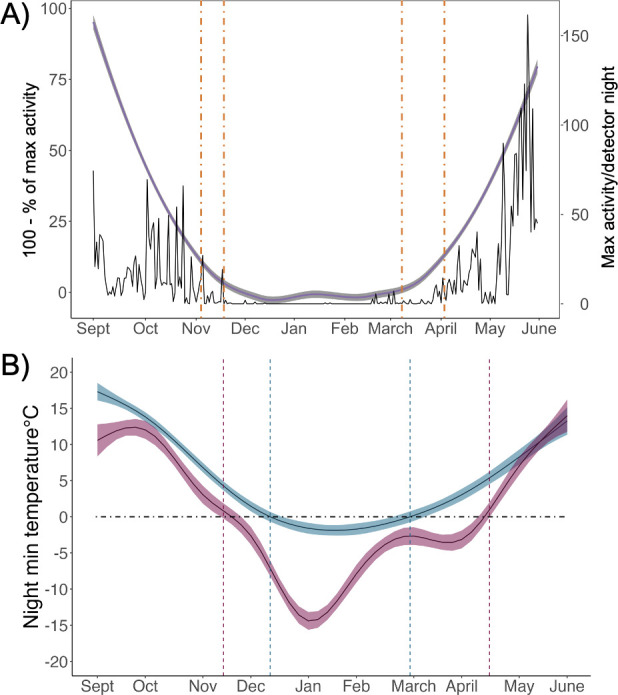
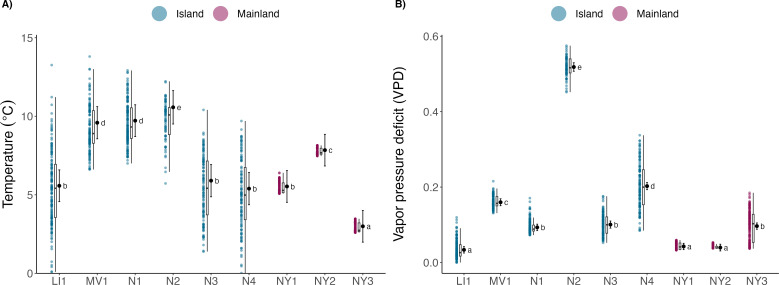
Anthropogenically driven environmental change has imposed substantial threats on biodiversity, including the emergence of infectious diseases that have resulted in declines of wildlife globally. In response to pathogen invasion, maintaining diversity within host populations across heterogenous environments is essential to facilitating species persistence. White-nose syndrome is an emerging fungal pathogen that has caused mass mortalities of hibernating bats across North America. However, in the northeast, peripheral island populations of the endangered northern myotis (Myotis septentrionalis) appear to be persisting despite infection while mainland populations in the core of the species range have experienced sharp declines. Thus, this study investigated host and environmental factors that may contribute to divergent population responses. We compared patterns of pathogen exposure and infection intensity between populations and documented the environmental conditions and host activity patterns that may promote survival despite disease invasion. For island populations, we found lower prevalence and less severe infections, possibly due to a shorter hibernation duration compared to the mainland, which may reduce the time for disease progression. The coastal region of the northern myotis range may serve as habitat refugia that enables this species to persist despite pathogen exposure; however, conservation efforts could be critical to supporting species survival in the long term.

Keywords: host persistence; host–pathogen interactions; northern myotis; peripheral populations; refugia from disease; white-nose snydrome.


Conflict of interest statement

We declare we have no competing interests.

Figures

Impacts of WNS on northern myotis (M. septentrionalis; MYSE) populations
Figure 1.
Impacts of WNS on northern myotis (M. septentrionalis; MYSE) populations. (A) Percent change in hibernating MYSE populations 1–4 years after P. destructans arrival in different US states (shown by two-letter state codes; electronic supplementary material, table S1). Bold points show the mean decline and bars represent ± s.e. States are arranged on the x-axis according to latitude, and the colour of each point represents the mean winter surface temperature (°C) at hibernacula locations. Hibernating populations declined an average of 99% within 4 years of P. destructans arrival. (B) Probability of capturing a MYSE on one mist-net night over years since WNS arrival (YSW) on the islands of Long Island, New York (LI; 2012–2021), and Martha’s Vineyard (MV; 2014–2021) and Nantucket (N; 2016–2021), Massachusetts, in comparison to nightly capture probabilities on the mainland in upstate New York (NY; 2006–2016) and Wisconsin (WI; 2015–2019). Transparent ribbons represent the 95% confidence intervals, and solid lines show the mean of the posterior distribution. Bold points represent the mean capture probability by YSW, bars indicate ± s.e. and the size of the transparent 0/1 points represent the number of MYSE captured per mist-net night. The dashed line indicates model predictions beyond our sampling time frame. Capture probability on the islands remains at 29% in year 9 while the probability of capture on the mainland drops to 4%.
WNS disease dynamics in northern myotis (M. septentrionalis) populations
Figure 2.
WNS disease dynamics in northern myotis (M. septentrionalis) populations. (A) Seasonal prevalence of P. destructans among island populations (LI = Long Island, New York, MV = Martha’s Vineyard, Massachusetts, N = Nantucket, Massachusetts) over time (2017–2021, n = 125 bats sampled). Bold points show mean prevalence by month, bars represent ± s.e. and size of the points represents sample size for each month or sampling day (transparent points). (B) Seasonal prevalence of P. destructans by location (island versus mainland; n = 530 bats sampled on the mainland, 2011–2021) during invasion (years 0–3) and post-invasion years (4+). Size of the points represents sample size for each sampling day, and grey lines depict model predictions with increasing darkening for each year of sampling. (C) P. destructans prevalence by location across years since WNS (YSW) arrival (spring data only when prevalence is highest). The dashed line indicates model predictions for years where no individuals were available to sample. Bold points show mean prevalence by YSW and bars represent ± s.e. Solid lines in each panel show the mean of the posterior distribution, and transparent ribbons show the 95% confidence intervals. (D) Infection intensity (measured as fungal loads for individual bats, log10 ng DNA) between the mainland and islands during invasion and post-invasion years. Black points show mean fungal loads by season and disease phase, bars represent ± s.e. Electronic supplementary material, figure S1, depicts sample sizes for each geographic location; electronic supplementary material, table S1, describes sample sizes for each location, by group (invasion versus post-invasion) and by season; and electronic supplementary material, table S6, displays the model output for each WNS model.
(a) Seasonal activity of northern myotis (M. septentrionalis) on the islands of Long Island
Figure 3.
(A) Seasonal activity of northern myotis (M. septentrionalis) on the islands of Long Island, New York, and Martha’s Vineyard and Nantucket, Massachusetts. Acoustic data were pooled across all study periods (1 September–31 May 2017–2020) and sampling sites. The solid black line represents the maximum (max) nightly activity/detector night, and the shaded purple line represents 100—the cumulative per cent of maximum nightly activity by season (autumn or spring). Dashed orange lines show the average 5% and 1% activity cutoff dates for the autumn and spring seasons (1% = 20 November–20 March, 5% = 6 November–5 April). Electronic supplementary material, figure S6, depicts the maximum nightly activity by study period. (B) Estimated hibernation duration on the islands and the mainland of New York represented by days below 0°C. Predicted days were calculated from the output of a GAM of average nightly minimum (min) surface temperatures for each location. The black dashed line indicates the 0°C nightly minimum temperature cutoff; the portion of the coloured lines falling below the dashed line indicates the estimated hibernation period (island: 81 days; mainland: 154 days). Average nightly minimum surface temperatures by location are presented in electronic supplementary material, figure S7. Weather data were obtained from the closest weather stations to each hibernacula location within the acoustic sampling period (2017–2020) [49].
Temperature (a) and VPD (b) of mainland and island hibernacula sampled
Figure 4.
Temperature (A) and VPD () of mainland and island hibernacula sampled over hibernation from November to April. Letters denote the results of pairwise comparisons among all sites. Mean temperatures were greater in island sites ( = 7.3°C ± 0.3 s.e., range = −1.0 to 13.8) than mainland sites ( = 5.4°C ± 0.3 s.e., range = 2.59–8.15), and were more variable over the hibernation period (t = −2.35, d.f. = 7, p = 0.05; mean coeff. of variation: island = 0.29, mainland = 0.06).

Similar articles

References

    1. Dirzo R, Young HS, Galetti M, Ceballos G, Isaac NJB, Collen B. 2014. Defaunation in the anthropocene. Science 345, 401–406. (10.1126/science.1251817) - DOI - PubMed
    1. Mazor T, Doropoulos C, Schwarzmueller F, Gladish DW, Kumaran N, Merkel K, Di Marco M, Gagic V. 2019. Global mismatch of policy and research on drivers of biodiversity loss. Nat. Ecol. Evol. 2, 1071–1074. (10.1038/s41559-018-0563-x) - DOI - PubMed
    1. Horváth Z, Ptacnik R, Vad CF, Chase JM. 2019. Habitat loss over six decades accelerates regional and local biodiversity loss via changing landscape connectance. Ecol. Lett. 22, 1019–1027. (10.1111/ele.13260) - DOI - PMC - PubMed
    1. Otto SP. 2018. Adaptation, speciation and extinction in the anthropocene. Proc. R. Soc. B 285, 20182047. (10.1098/rspb.2018.2047) - DOI - PMC - PubMed
    1. Rehm EM, Olivas P, Stroud J, Feeley KJ. 2015. Losing your edge: climate change and the conservation value of range-edge populations. Ecol. Evol. 5, 4315–4326. (10.1002/ece3.1645) - DOI - PMC - PubMed

Supplementary concepts

LinkOut - more resources