. 2025 Jan;292(2038):20242471.
doi: 10.1098/rspb.2024.2471. Epub 2025 Jan 8.

Spur-winged lapwings show spatial behavioural types with different mobility and exploration between urban and rural individuals

Affiliations

Spur-winged lapwings show spatial behavioural types with different mobility and exploration between urban and rural individuals

Michael Bar-Ziv et al. Proc Biol Sci. 2025 Jan.

Abstract

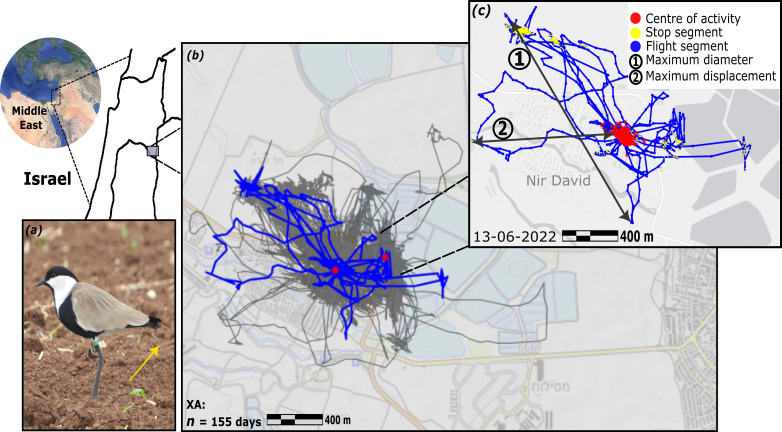
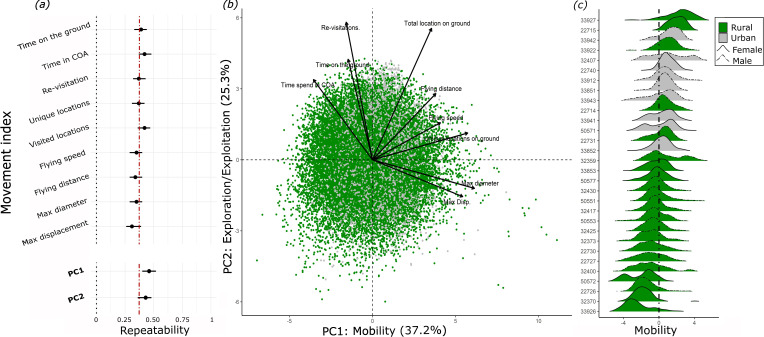
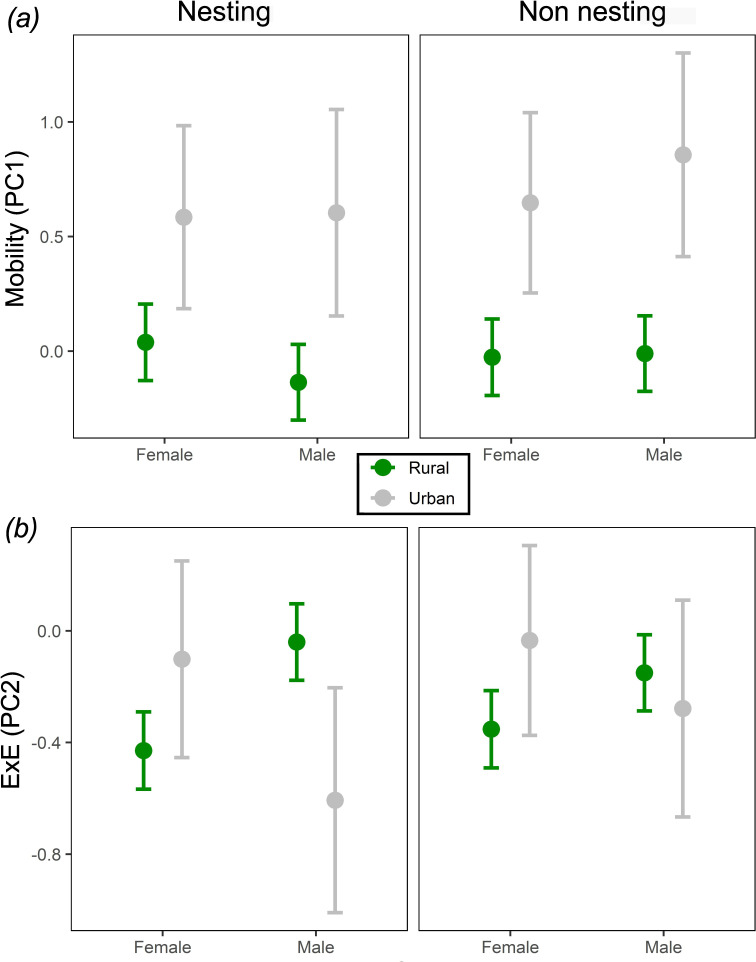
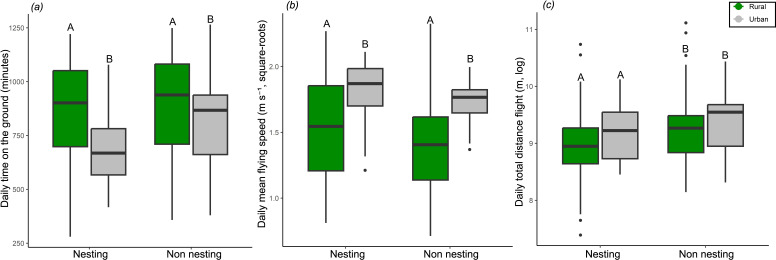
Understanding how wildlife responds to the spread of human-dominated habitats is a major challenge in ecology. It is still poorly understood how urban areas affect wildlife space-use patterns and consistent intra-specific behavioural differences (i.e. behavioural types; BTs), which in turn shape various ecological processes. To address these questions, we investigated the movements of a common resident wader, the spur-winged lapwing (Vanellus spinosus), hypothesizing that urban individuals will be more mobile than rural ones. We used an ATLAS tracking system to track many (n = 135) individuals at a high resolution over several months each. We first established that daily movement indices show consistent differences among individuals, acting as spatial-BTs. Then focusing on the two main principle components of lapwings' daily movements-mobility and position along the exploration-exploitation gradient-we investigated how these BTs are shaped by urbanization, season (nesting versus non-nesting) and sex. We found that urban lapwings were indeed more mobile in both seasons. Furthermore, urban females were less explorative than rural females, especially during the nesting season. These results highlight how urbanization affects wildlife behaviour, even of apparently urban-resilient avian residents. This underscores the need to consider possible behavioural consequences that are only apparent through advanced tracking methods.

Keywords: HIREC; biotelemetry; exploration–exploitation trade-off; movement ecology; waders.


Conflict of interest statement

We declare we have no competing interests.

Figures

Spur-winged lapwing (Vanellus spinosus), equipped with an ATLAS tag (yellow arrow indicates the antenna), and identification flag (E1; credit: Hilla Ziv).
Figure 1.
(a) Spur-winged lapwing (Vanellus spinosus), equipped with an ATLAS tag (yellow arrow indicates the antenna), and identification flag (E1; credit: Hilla Ziv). (b) A trajectory of an urban individual (XA, dwelling in Kibbutz Nir David), over 155 days (narrow grey lines), with one day (13 June 2022) highlighted as a blue line and enlarged in the inset. (c) The inset shows the segmentation and indices of this particular day. Yellow and red dots indicate ground stops and the centre of activity (areas where the lapwing stops and spends more than 75% of its overall tracking duration), respectively. Arrows indicate (1) the maximum daily displacement (max bee-line distance between any two locations within a day) and (2) the maximal distance from the centre of activity.
Repeatability and principal component analysis (PCA) of movement indices summarizing 26 281 tracking days of 135 lapwings.
Figure 2.
Repeatability and principal component analysis (PCA) of movement indices summarizing 26 281 tracking days of 135 lapwings. (a) Repeatability values and their 95% confidence intervals for daily movement indices are included in the PCA. Repeatability values for PC1 and PC2 are also presented at the bottom. The vertical red-dashed line indicates the R = 0.37 suggested as a mean of BT [26]. (b) A PCA bi-plot showing daily values and loadings for the nine indices of daily movements PC1 (37.2% stress): mobility and PC2 (25.3% stress): exploration–exploitation (ExE). Points indicate specific days (n > 25000), coloured by habitat. Higher PC values for the two axes indicate longer flight distances and a tendency to revisit the same location, respectively. (c) Density plots for 30 randomly selected individuals, demonstrating individual differences in their mobility (PC1). Colours indicate the bird’s habitat and line type represents their sex. Note that urban birds tended to show higher mobility.
These results of marginal average model for the effects of urbanization status on lapwing movement PCs, separated by season and sex.
Figure 3.
The results of the marginal average model for the effects of urbanization status on lapwing movement PCs, separated by season and sex. Colours indicate urbanization status (grey = urban, green = rural), dots represent the model mean marginal effect and error bars the standard error of model marginal effects across all tracking days. For (a) mobility (PC1), urban lapwings (grey) were more mobile than rural ones (green), in both seasons. For (b) ExE (PC2), the results indicate that differences were observed mainly during the nesting season, with urban females being more exploiters than rural ones, and males showing the opposite trend.
Behavior-specific differences between rural and urban lapwings.
Figure 4.
Behaviour-specific differences between rural and urban lapwings. Two of the nine behaviours composing the two PCs showed a significant effect of urbanization (p < 0.05, after adjusting with the Benjamini–Hochberg correction). In general, urban lapwings spend less time on the ground and fly faster (a-b). Lapwings also showed longer travel distances during the non-nesting season (c). Together these differences support the possibility that more frequent disturbances in urban habitats lead to the observed difference in mobility and ExE. Colours indicate urbanization status (grey = urban, green = rural), capital letters indicate statistically significant groups (electronic supplementary material, figure S8 for full comparison and multiple comparison correction). Note that the box plots present the distributions of mean individual values.

Similar articles

References

    1. Meyer WB, Turner BL. 1992. Human population growth and global land-use/cover change. Annu. Rev. Ecol. Syst. 23, 39–61. (10.1146/annurev.es.23.110192.000351) - DOI
    1. Doherty TS, Hays GC, Driscoll DA. 2021. Human disturbance causes widespread disruption of animal movement. Nat. Ecol. Evol. 5, 513–519. (10.1038/s41559-020-01380-1) - DOI - PubMed
    1. Mcdonald RI, Kareiva P, Forman RTT. 2008. The implications of current and future urbanization for global protected areas and biodiversity conservation. Biol. Conserv. 141, 1695–1703. (10.1016/j.biocon.2008.04.025) - DOI
    1. McDonnell MJ, Hahs AK. 2015. Adaptation and adaptedness of organisms to urban environments. Annu. Rev. Ecol. Evol. Syst. 46, 261–280. (10.1146/annurev-ecolsys-112414-054258) - DOI
    1. Bar-Ziv MA, Subach A, Hirsch-Ionescu A, Belmaker J, Zweifler A, Scharf I. 2018. Comparison of wormlions and their immediate habitat under man-made and natural shelters: suggesting factors making wormlions successful in cities. Zoology 130, 38–46. (10.1016/j.zool.2018.08.004) - DOI - PubMed

Grants and funding

LinkOut - more resources