. 2025 Aug;21(8):1623-1643.
doi: 10.1080/15548627.2024.2448914. Epub 2025 Jan 14.

PLK2 disrupts autophagic flux to promote SNCA/α-synuclein pathology

Affiliations

PLK2 disrupts autophagic flux to promote SNCA/α-synuclein pathology

Chuang Zhang et al. Autophagy. 2025 Aug.

Abstract

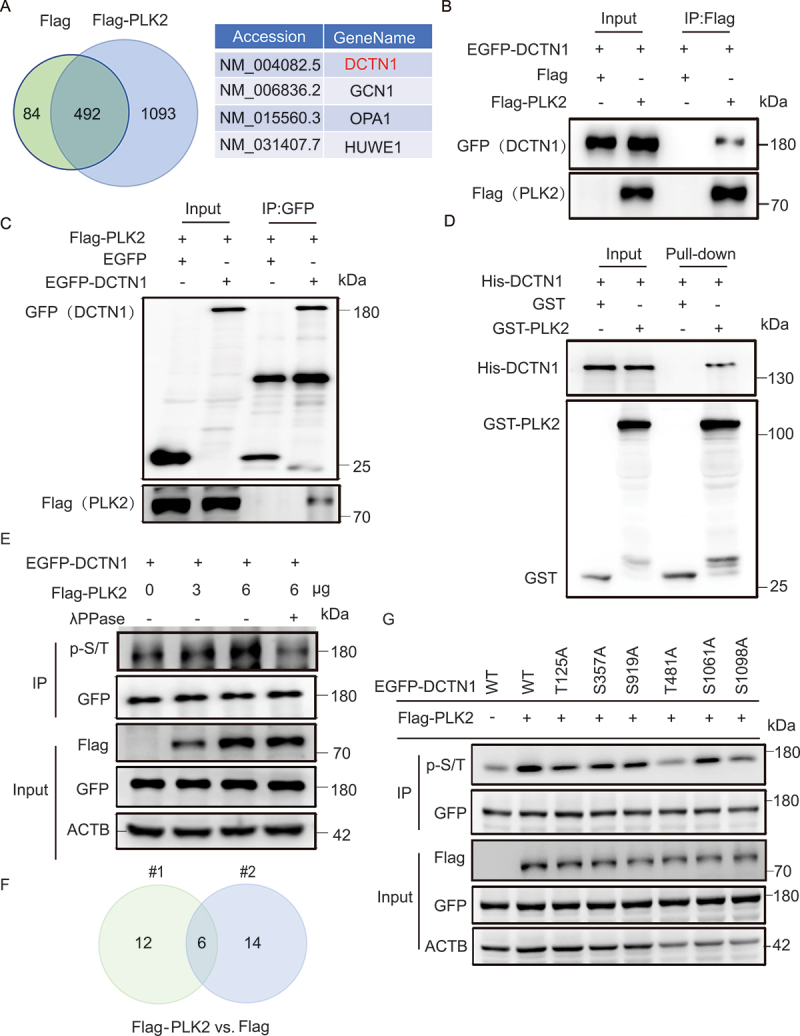
The aggregation and transmission of SNCA/α-synuclein (synuclein, alpha) is a hallmark pathology of Parkinson disease (PD). PLK2 (polo like kinase 2) is an evolutionarily conserved serine/threonine kinase that is more abundant in the brains of all family members, is highly expressed in PD, and is linked to SNCA deposition. However, in addition to its role in phosphorylating SNCA, the role of PLK2 in PD and the mechanisms involved in triggering neurodegeneration remain unclear. Here, we found that PLK2 regulated SNCA pathology independently of S129. Overexpression of PLK2 promoted SNCA preformed fibril (PFF)-induced aggregation of wild-type SNCA and mutant SNCAS129A. Genetic or pharmacological inhibition of PLK2 attenuated SNCA deposition and neurotoxicity. Mechanistically, PLK2 exacerbated the propagation of SNCA pathology by impeding the clearance of SNCA aggregates by blocking macroautophagic/autophagic flux. We further showed that PLK2 phosphorylated S1098 of DCTN1 (dynactin 1), a protein that controls the movement of organelles, leading to impaired autophagosome-lysosome fusion. Furthermore, genetic suppression of PLK2 alleviated SNCA aggregation and motor dysfunction in vivo. Our findings suggest that PLK2 negatively regulates autophagy, promoting SNCA pathology, suggesting a role for PLK2 in PD.Abbreviation: AD: Alzheimer disease; AMPK: AMP-activated protein kinase; CASP3: caspase 3; DCTN1: dynactin 1; LBs: lewy bodies; LDH: lactate dehydrogenase; LAMP1: lysosomal associated membrane protein 1; MAP1LC3/LC3: microtubule associated protein 1 light chain 3; MAP2: microtubule associated protein 2; MTOR: mechanistic target of rapamycin kinase; NH4Cl: ammonium chloride; p-SNCA: phosphorylation of SNCA at S129; PD: Parkinson disease; PFF: preformed fibril; PI: propidium iodide; PLK2: polo like kinase 2; PRKAA/AMPK: protein kinase AMP-activated catalytic subunit alpha; shRNA: short hairpin RNA; SNCA: synuclein, alpha; SQSTM1/p62: sequestosome 1; TH: tyrosine hydroxylase; TX: Triton X-100; ULK1: unc-51 like autophagy activating kinase 1.

Keywords: Autophagic flux; DCTN1; PLK2; Parkinson disease; autophagosome-lysosome fusion.


Conflict of interest statement

No potential conflict of interest was reported by the author(s).

Figures

Figure 1.
Figure 1.
PLK2 promotes SNCA PFF seeding independent of S129. (A-B) Representative images of immunofluorescence staining for p-SNCA and quantification (n = 3 independent experiments) of the p-SNCA area:ZsGreen area in primary cortical neurons treated with PFF (1 μg/mL) or PBS for 10 days and in those pretreated with LV PLK2-Flag or LV ZsGreen for 3 days. Scale bar: 50 μm. (C-D) Immunoblots and quantitative analysis (n = 3 independent experiments) of TX-insoluble SNCA and p-SNCA in primary cortical neurons treated with PFF or PBS for 10 days and in those pretreated with LV PLK2-flag or LV ZsGreen. (E-F) Representative confocal immunofluorescence images of EGFP-SNCAS129A foci in stable EGFP-SNCAS129A HEK293 cells treated with PFF or PBS for 24 h after overexpression of flag-PLK2 or Flag (n = 3 independent experiments). The percentage of SNCAS129A foci was quantified for 50 randomly selected cells in each independent experiment. Scale bar: 20 μm. (G-H) Representative confocal images and analysis (n = 3 independent experiments) of hoechst and PI staining in primary cortical neurons treated with PFF or PBS for 14 days and in those pretreated with LV PLK2-Flag or LV ZsGreen. Scale bar: 50 μm. The data are presented as the mean ± SEM. The p values were calculated via two-way ANOVA in (B), (D), (F) and (H). *p < 0.05, **p < 0.01, ***p < 0.001.
Figure 2.
Figure 2.
PLK2 deficiency attenuates PFF-induced pathological SNCA aggregation and neurotoxicity. (A-B) Representative images of immunofluorescence staining for MAP2 and p-SNCA and quantification (n = 3 independence experiments) of the p-SNCA area:MAP2 area in primary cortical neurons treated with PFF or PBS for 10 days and in those pretreated with Plk2 shRNAs or scr. shRNA for 3 days. Scale bar: 50 μm. (C-D) Immunoblots and quantitative analysis (n = 3 independent experiments) of TX-insoluble SNCA and p-SNCA in primary cortical neurons treated with PFF or PBS for 10 days and in those pretreated with Plk2 shRNAs or scr. shRNA. (E-F) Representative confocal images of immunofluorescence staining for MAP2 and p-SNCA and quantification of the number of dendritic branches (n = 7 cells per group) in primary cortical neurons treated with PFF or PBS for 14 days and in those pretreated with Plk2 shRNAs or scr. shRNA. Scale bar: 10 μm. (G) Diagrams showing the percentages of pi-positive cells treated with PFF or PBS for 14 days and in those pretreated with Plk2 shRNAs or scr. shRNA (n = 3 independent experiments). The data are presented as the mean ± SEM. The p values were calculated via two-way ANOVA in (B), (D), (F) and (G). **p < 0.01, ***p < 0.001, ****p < 0.0001.
Figure 3.
Figure 3.
TC-S7005, an inhibitor of PLK2, reduces PFF-induced pathological SNCA aggregation and neurotoxicity. (A-B) Representative images of immunofluorescence staining for MAP2 and p-SNCA and quantification (n = 3 independence experiments) of the p-SNCA area:MAP2 area in primary cortical neurons treated with PFF or PBS for 10 days and in those pretreated with TC-S7005 or DMSO for 24 h. Scale bar: 50 μm. (C-D) Immunoblots and quantitative analysis (n = 3 independent experiments) of TX-insoluble SNCA and p-SNCA in primary cortical neurons treated with PFF or PBS for 10 days and in those pretreated with TC-S7005 or DMSO. (E-F) Representative confocal images of immunofluorescence staining for MAP2 and p-SNCA and quantification of the number of dendritic branches (n = 7 cells per group) in primary cortical neurons treated with PFF or PBS for 14 days and in those pretreated with TC-S7005 or DMSO. Scale bar: 20 μm. (G-H) Immunoblots and quantitative analysis (n = 3 independent experiments) of cleaved CASP3 in primary cortical neurons treated with PFF or PBS for 14 days and in those pretreated with TC-S7005 or DMSO. (I) Culture media from primary neurons treated with PFF or PBS for 14 days and from those pretreated with TC-S7005 or DMSO were collected to assess LDH release (n = 3 independent experiments). (J) Diagrams showing the percentage of pi-positive cells treated with PFF or PBS for 14 days and those pretreated with TC-S7005 or DMSO (n = 3 independent experiments). The data are presented as the mean ± SEM. The P values were calculated via two-way ANOVA in (B), (D), (F), (H), (I) and (J). **P <0.01, ***P < 0.001, ****P < 0.0001.
Figure 4.
Figure 4.
PLK2 deficiency improves motor deficits in the SNCA PFF mouse model. (A) Scheme of PFF stereotactic injection and timeline of AAV shPlk2 administration. (B-D) Behavioral assessment 6 months after PFF injection. The results for the mice in the (B) rotarod test, (C) pole test and (D) grip strength test are shown (n = 12 mice per group). (E) Representative movement paths of the mice in each group in the open field test. (F) The distances traveled by mice treated with PFF or PBS for 6 months and by those pretreated with AAV shPlk2 or AAV scr.shRNA for 1 month are shown (n = 12 mice per group). The data are presented as the mean ± SEM. The p values were calculated via two-way ANOVA in (B), (C), (D) and (F). *p < 0.05, **p < 0.01, ***p < 0.001, ****p < 0.0001; ns, not significant.
Figure 5.
Figure 5.
PLK2 deficiency prevents DA neuronal deficits in the SNCA PFF mouse model. (A) Representative images of immunofluorescence staining for TH and p-SNCA within the SNpc. Scale bar: 100 μm. (B) Quantification of the number of th-positive cells and p-snca fluorescence intensity within the SNpc (n = 5 slices from 3 mice). Five slices were randomly selected from three mice, and the number of TH neurons in each slice was quantified. (C-D) Immunoblots and quantitative analysis (n = 3 mice per group) of tx-soluble TH and TX-insoluble SNCA and p-SNCA. The data are presented as the mean ± SEM. The p values were calculated via two-way ANOVA in (B) and (D). *p <0.05, **p <0.01, ***p < 0.001, ****p < 0.0001; ns, not significant.
Figure 6.
Figure 6.
PLK2 contributes to SNCA pathology by negatively regulating autophagy. (A-B) Immunoblots and quantitative analysis (n = 3 independent experiments) of SQSTM1 and LC3 in SH-SY5Y cells treated with the LV PLK2-Flag or LV vector for 3 days and with Baf A1 (100 nM) or DMSO for 12 h. (C) Representative transmission electron microscopy (TEM) images of the ultrastructures of autophagosomes from HEK293 cells transfected with the EGFP or EGFP-PLK2 plasmid for 24 h and screened for egfp-positive cells via flow cytometry. Red arrows indicate autophagosomes. Scale bar: 500 nm. (D) Quantification (n = 3 independent experiments) of the ultrastructures of autophagosomes from the HEK293 cells shown in Figure 6C. (E-F) Representative confocal images and analysis (n = 3 mice per group) of SQSTM1 and LC3 staining in striatal neurons from mice treated with AAV PLK2-flag or AAV EGFP for 1 month. Scale bar: 50 μm. (G-H) Representative immunofluorescence images and analysis (n = 5 slices from 3 mice) of p-SNCA staining within the striatum of mice treated with PFF or PBS for 2 months and those pretreated with AAV PLK2 or AAV EGFP for 1 month. Scale bar: 100 μm. The data are presented as the mean ± SEM. The p values were calculated by two-way ANOVA in (B) and (H) and one-way ANOVA followed by Tukey’s post hoc test in (D) and (F). *p < 0.05, **p < 0.01, ***p < 0.001, ****p < 0.0001; ns, not significant.
Figure 7.
Figure 7.
PLK2 deficiency enhances autophagy to facilitate the clearance of SNCA aggregates. (A-B) Representative confocal images and analysis (n = 3 independent experiments) of SQSTM1 and p-SNCA staining in primary cortical neurons treated with PFF or PBS for 7 days and in those pretreated with Plk2 shRNAs or scr. shRNA for 3 days. Scale bar: 25 μm. (C-D) Immunoblots and quantitative analysis (n = 3 independent experiments) of SQSTM1 and LC3 in primary cortical neurons treated with PFF or PBS for 7 days and in those pretreated with Plk2 shRNAs or scr. shRNA. (E-F) Representative confocal images and quantitative analysis (n = 3 independent experiments) of p-SNCA staining in primary cortical neurons treated with PFF or PBS for 5 days and in those pretreated with Plk2 shRNA. Two days after PFF treatment, the cells were incubated with NH4Cl (100 nM) or DMSO for 3 days. DAPI was used for nuclear staining. Scale bar: 20 μm. (G-H) Immunoblots and quantitative analysis (n = 3 independent experiments) of TX-insoluble SNCA and p-SNCA in primary cortical neurons treated with PFF or PBS for 5 days and in those pretreated with Plk2 shRNA. Two days after PFF treatment, the cells were incubated with NH4Cl or DMSO for 3 days. The data are presented as the mean ± SEM. The p values were calculated by two-way ANOVA in (B) and (D) and one-way ANOVA followed by Tukey’s post hoc test in (F) and (H). *p < 0.05, **p < 0.01, ***p < 0.001, ****p < 0.0001, ns, not significant.
Figure 8.
Figure 8.
PLK2 impedes autophagosome-lysosome fusion to disrupt autophagic flux. (A-B) Representative confocal images and quantitative analysis (n = 3 independent experiments) of SQSTM1 and LC3 staining in HEK293 cells treated with EGFP-PLK2 or EGFP for 24 h. The percentage of LAMP1 and LC3 colocalization was quantified in each independent experiment. Scale bar: 10 μm. (C-D) Representative confocal images and quantification (n = 5 independent experiments) of yellow dots and red dots for mCherry-EGFP-LC3 in HeLa cells treated with Flag-PLK2 or Flag for 24 h and with EBSS or PBS for 1 h. Scale bar: 10 μm. (E-F) Representative confocal images and quantification (n = 3 independent experiments) of LAMP1 and LC3 colocalization by staining for LAMP1 and LC3 in HeLa cells treated with Flag-PLK2 or Flag followed by EBSS for 1 h. The percentage of LAMP1 and LC3 colocalization was quantified in each independent experiment. Scale bar: 10 μm. (G) Immunoblot analysis of SQSTM1 and LC3 in SH-SY5Y cells treated with WT PLK2-Flag, D223N PLK2-Flag, T239D PLK2-Flag or Flag for 24 h. The data are presented as the mean ± SEM. The p values were calculated by two-way ANOVA in (D) and one-way ANOVA followed by Tukey’s post hoc test in (B) and (F). *p < 0.05, **P  < 0.01, ***P  < 0.001.
Figure 9.
Figure 9.
PLK2 phosphorylates DCTN1 at T481 and S1098. (A) IP-MS analysis of proteins interacting with PLK2 in 293T cells transfected with Flag-PLK2 or Flag for 24 h. (B-C) Co-IP analysis of the interaction of PLK2 with DCTN1 in 293T cells transfected with Flag-PLK2 or Flag and EGFP-DCTN1 or EGFP for 24 h. (D) Affinity-isolation assays in a cell-free system using purified recombinant GST-PLK2 and His-DCTN1 fusion proteins produced from E. coli. (E) IP and immunoblot analysis of DCTN1 phosphorylation in HEK293T cells treated with PLK2-Flag or Flag and λPPase via an anti-p-S/T antibody. (F) Identification of DCTN1 phosphorylation sites via MS. (G) IP and immunoblot analysis of DCTN1 phosphorylation in HEK293T cells treated with the wild-type or different mutants of DCTN1 via an anti-p-S/T antibody.
Figure 10.
Figure 10.
DCTN1 S1098A promotes autophagosome-lysosome fusion to alleviate SNCA pathology. (A-B) Representative confocal images and quantification (n = 3 independent experiments) of LAMP1 and LC3 colocalization by staining for LAMP1 and LC3 in DCTN1 KO cells treated with the wild type or different mutants of DCTN1 and Flag-PLK2 followed by EBSS for 1 h. The percentage of LAMP1 and LC3 colocalization was quantified in each independent experiment. Scale bar: 10 μm. (C-D) Representative confocal images and quantitative analysis (n = 3 independent experiments) of p-SNCA staining in primary cortical neurons treated with PFF or PBS for 10 days and in those pretreated with Dctn1 shRNA for 3 days. Two days after PFF treatment, the cells were incubated with LV ZsGreen, LV DCTN1 WT or LV DCTN1S1098A. Scale bar: 50 μm. (E) Diagrams showing the percentage of PI-positive cells among primary cortical neurons treated with PFF or PBS for 14 days and among those pretreated with Dctn1 shRNA for 3 days. Two days after PFF treatment, the cells were incubated with LV ZsGreen, LV DCTN1 WT or LV DCTN1S1098A (n = 3 independent experiments). The data are presented as the mean ± SEM. The p values were calculated via one-way ANOVA followed by Tukey’s post hoc test in (B), (D), and (E). **p <0.01, ***p < 0.001, ****p < 0.0001, ns means not significant.
Figure 11.
Figure 11.
Mechanistic pattern of PLK2 involvement in PD. Under physiological conditions, SNCA exists predominantly as a disordered monomer, with autophagic flux freely operating to maintain cellular protein homeostasis. In the disease state, increased expression of PLK2 is accompanied by SNCA deposition. Subsequently, PLK2 blocks autophagic flux by phosphorylating DCTN1, the largest subunit of dynactin, causing an autophagosome-lysosome fusion junction, which further triggers SNCA aggregation.

Similar articles

References

    1. Ben-Shlomo Y, Darweesh S, Llibre-Guerra J, et al. The epidemiology of Parkinson’s disease. The Lancet. 2024;403(10423):283–292. doi: 10.1016/S0140-6736(23)01419-8 - DOI - PMC - PubMed
    1. Simuni T, Chahine LM, Poston K, et al. A biological definition of neuronal α-synuclein disease: towards an integrated staging system for research. The Lancet Neurol. 2024;23(2):178–190. doi: 10.1016/S1474-4422(23)00405-2 - DOI - PubMed
    1. Fares MB, Jagannath S, Lashuel HA.. Reverse engineering Lewy bodies: how far have we come and how far can we go? Nat Rev Neurosci. 2021;22(2):111–131. doi: 10.1038/s41583-020-00416-6 - DOI - PubMed
    1. Goedert M, Jakes R, Spillantini MG. The synucleinopathies: twenty years on. J Parkinson’s Disease. 2017;7(s1):S51–S69. doi: 10.3233/JPD-179005 - DOI - PMC - PubMed
    1. Henderson MX, Cornblath EJ, Darwich A, et al. Spread of α-synuclein pathology through the brain connectome is modulated by selective vulnerability and predicted by network analysis. Nat Neurosci. 2019;22(8):1248–1257. doi: 10.1038/s41593-019-0457-5 - DOI - PMC - PubMed