. 2025 Jan 8;31(1):5.
doi: 10.1186/s10020-024-01036-x.

Multi‑omics identification of a novel signature for serous ovarian carcinoma in the context of 3P medicine and based on twelve programmed cell death patterns: a multi-cohort machine learning study

Affiliations

Multi‑omics identification of a novel signature for serous ovarian carcinoma in the context of 3P medicine and based on twelve programmed cell death patterns: a multi-cohort machine learning study

Lele Ye et al. Mol Med. .

Abstract

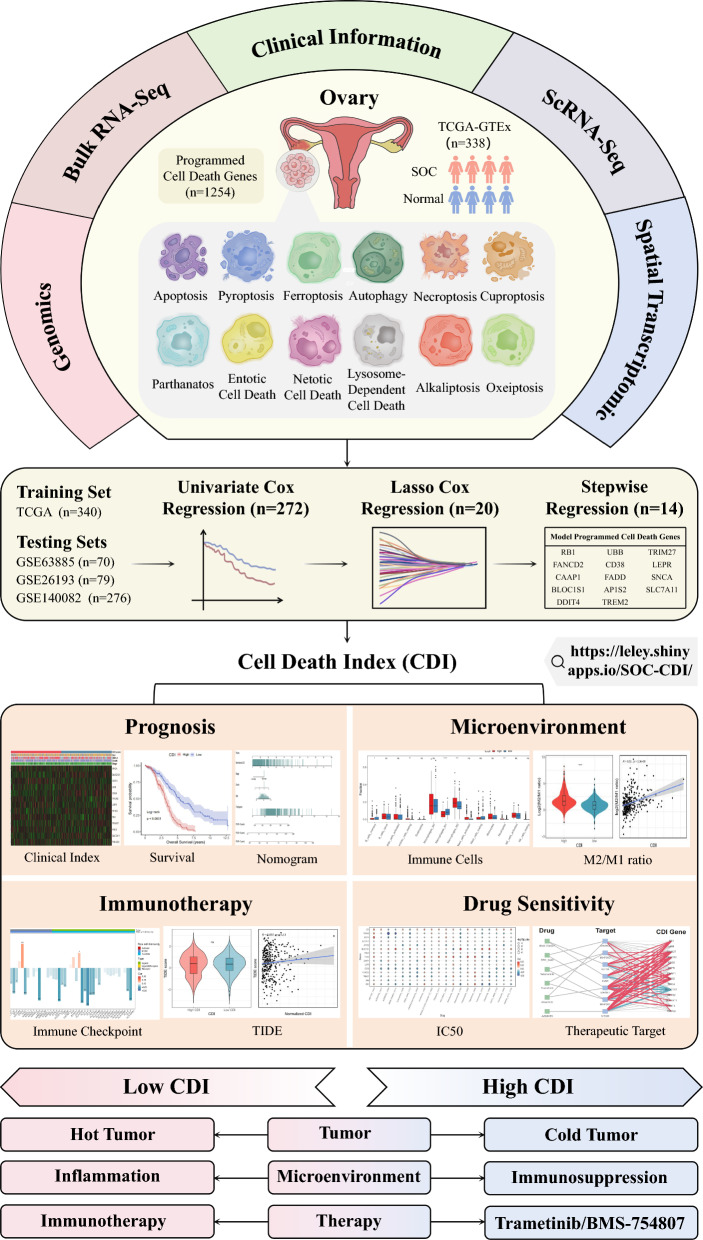
Background: Predictive, preventive, and personalized medicine (PPPM/3PM) is a strategy aimed at improving the prognosis of cancer, and programmed cell death (PCD) is increasingly recognized as a potential target in cancer therapy and prognosis. However, a PCD-based predictive model for serous ovarian carcinoma (SOC) is lacking. In the present study, we aimed to establish a cell death index (CDI)-based model using PCD-related genes.

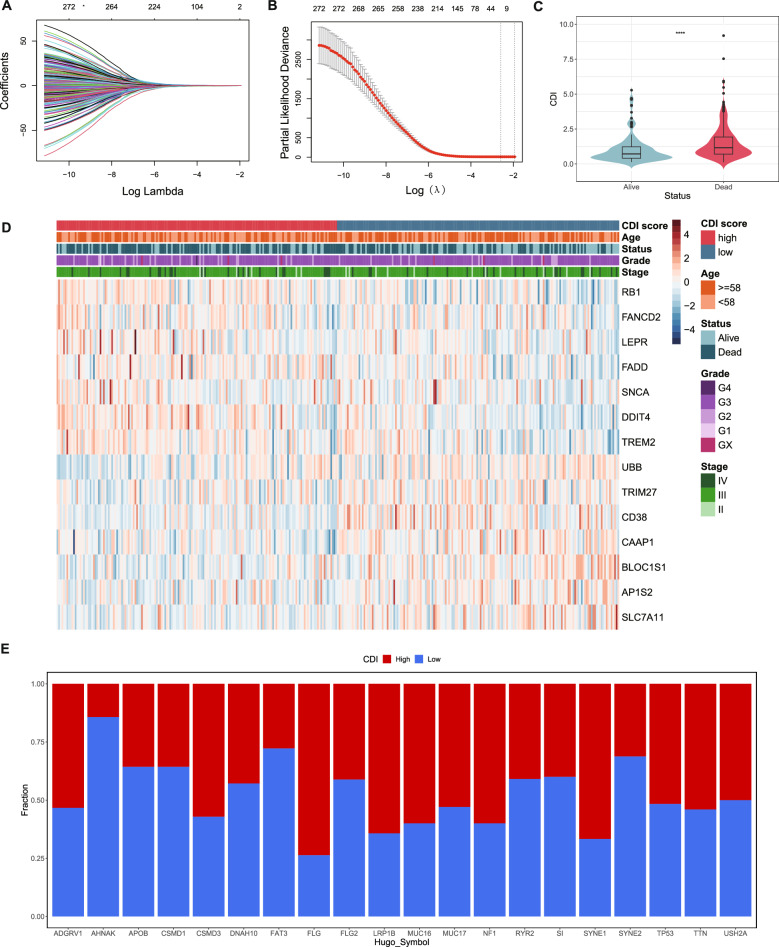
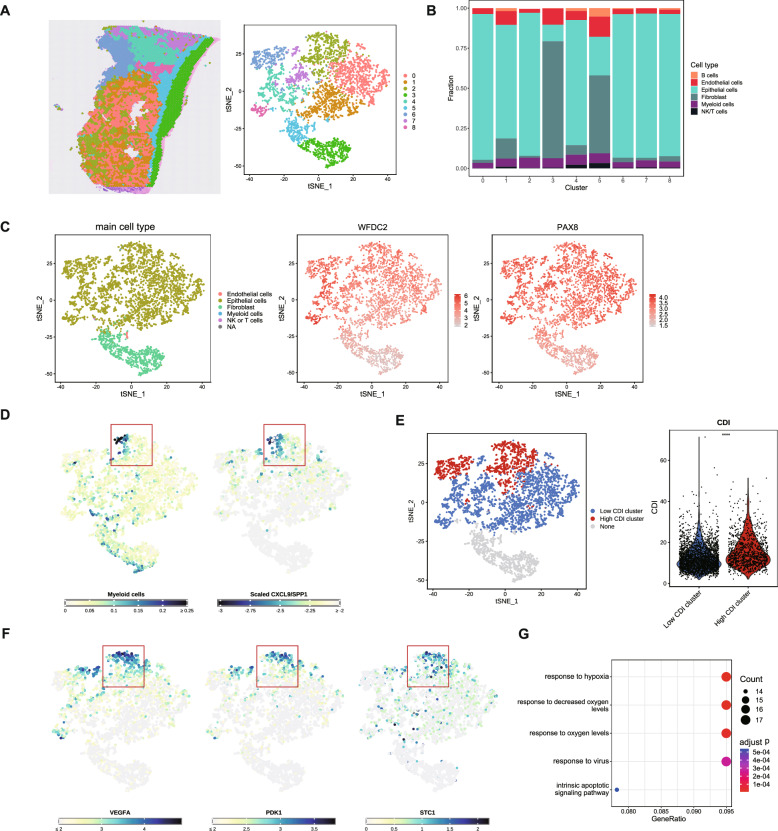
Methods: We included 1254 genes from 12 PCD patterns in our analysis. Differentially expressed genes (DEGs) from the Cancer Genome Atlas (TCGA) and Genotype-Tissue Expression (GTEx) were screened. Subsequently, 14 PCD-related genes were included in the PCD-gene-based CDI model. Genomics, single-cell transcriptomes, bulk transcriptomes, spatial transcriptomes, and clinical information from TCGA-OV, GSE26193, GSE63885, and GSE140082 were collected and analyzed to verify the prediction model.

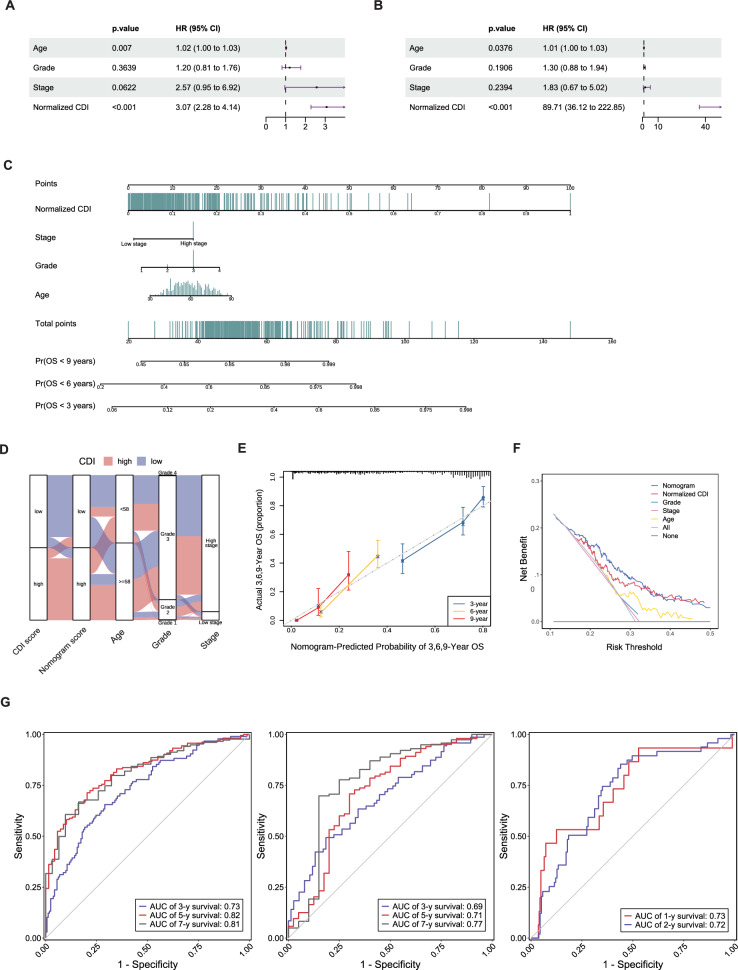
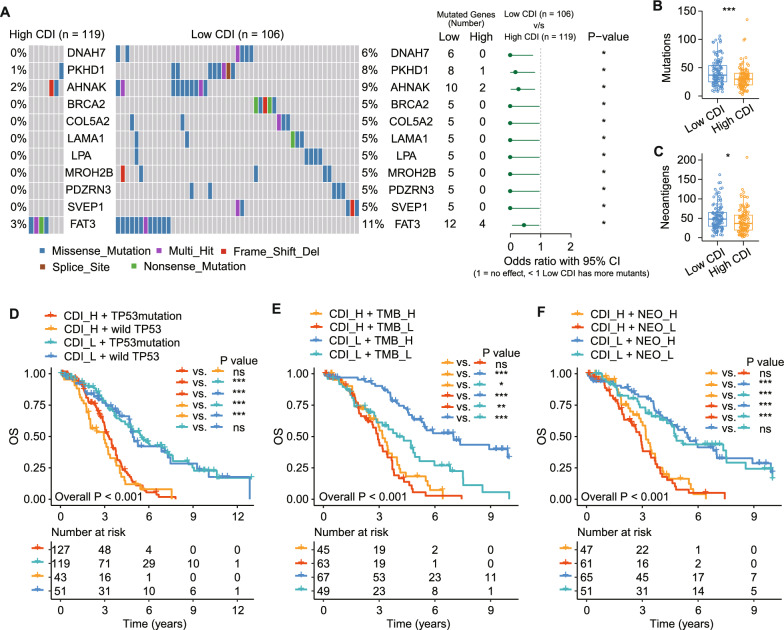
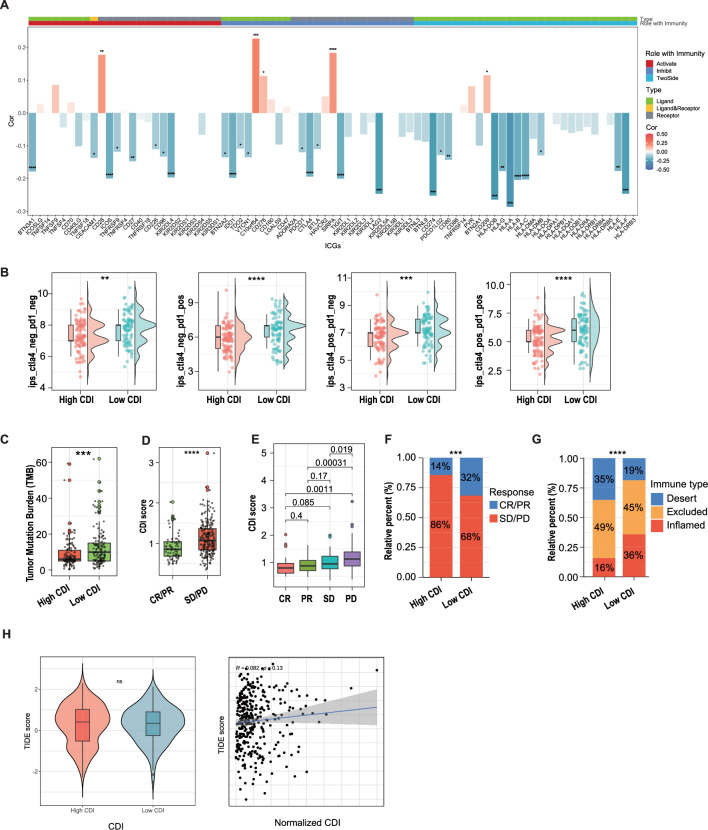
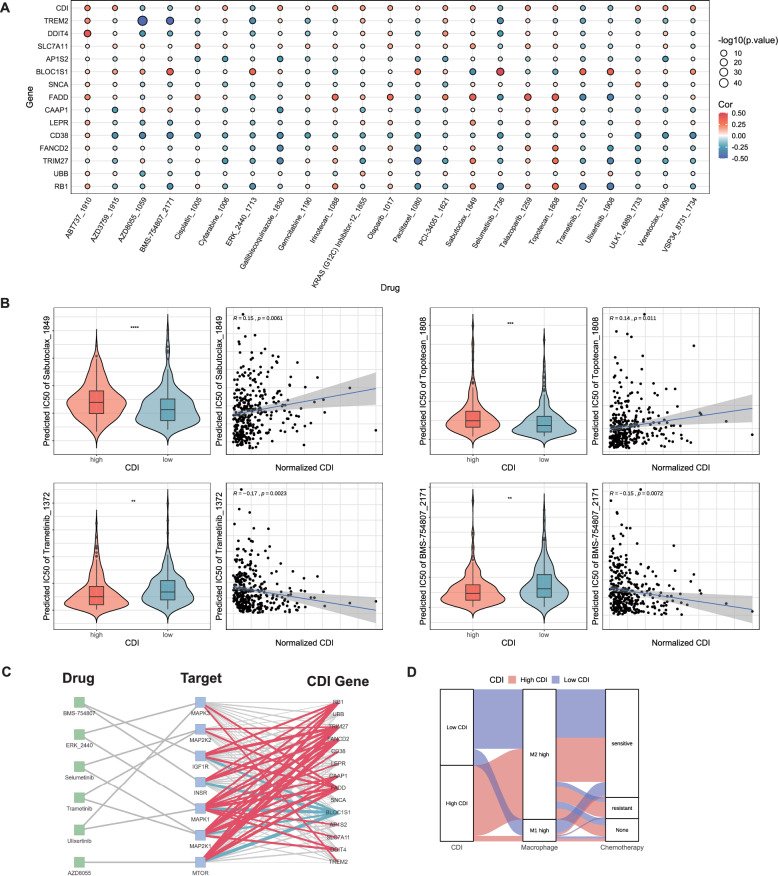
Results: The CDI was recognized as an independent prognostic risk factor for patients with SOC. Patients with SOC and a high CDI had lower survival rates and poorer prognoses than those with a low CDI. Specific clinical parameters and the CDI were combined to establish a nomogram that accurately assessed patient survival. We used the PCD-genes model to observe differences between high and low CDI groups. The results showed that patients with SOC and a high CDI showed immunosuppression and hardly benefited from immunotherapy; therefore, trametinib_1372 and BMS-754807 may be potential therapeutic agents for these patients.

Conclusions: The CDI-based model, which was established using 14 PCD-related genes, accurately predicted the tumor microenvironment, immunotherapy response, and drug sensitivity of patients with SOC. Thus this model may help improve the diagnostic and therapeutic efficacy of PPPM.

Keywords: Cell death index; Predictive model; Predictive preventive and personalized medicine (PPPM/3PM); Programmed cell death; Serous ovarian carcinoma.


Conflict of interest statement

Declarations. Ethics approval and consent to participate: The TCGA and GEO databases are publicly available. Users can download the data for free for research purposes and publish related articles. The authors declare no ethical issues or conflicts of interest. Consent for publication: Not applicable. Competing interests: The authors declare no competing interests.

Figures

Fig. 1
Fig. 1
Flowchart for comprehensive analysis of diverse PCD patterns in patients with SOC
Fig. 2
Fig. 2
Variant landscape of PCD-related genes in patients with SOC. A Heatmap of PCD-related differentially expressed genes (DEGs) between SOC and normal tissues. B Volcano plot of PCD-related DEGs. Points with labels were part of the obvious DEGs with an adjusted P-value < 0.001 and |log2FC|> 4. C Circos plot of location, fold-change (FC), expression level, and significant correlation with the PCD-related DEGs. D Kyoto Encyclopedia of Genes and Genomes (KEGG) enrichment analysis of DEGs. E Gene Ontology (GO) enrichment analysis of the DEGs. F Oncoplot of the top 20 most frequently mutated PCD-related genes in the TCGA-OV cohort. G Summary of somatic mutations in the PCD-related genes in the TCGA-OV cohort. H Top 100 PCD-related genes with the most significant copy number variations
Fig. 3
Fig. 3
Construction of the PCD-related gene signature for patients with SOC. A LASSO coefficient profiles of 272 PCD genes. B Cross-validation of the gene signature. C Violin plot showing the relationship between the cell death index (CDI) and survival status. D Heatmap of the clinical features and model gene expression in the TCGA-OV cohort. The age cutoff was the median patient age. E The mutation frequency of the top 20 mutable genes between high and low-CDI groups in SOC patients in TCGA-OV
Fig. 4
Fig. 4
Prediction model performance evaluation. A Distribution of survival status and time according to the normalized CDI in the TCGA-OV, GSE63885 + GSE26193, and GSE140082 cohorts. Dashed lines represent the dividing lines of the median number. B The principal component analysis plot based on the CDI in the TCGA-OV, GSE63885 + GSE26193, and GSE140082 cohorts. C Kaplan–Meier (KM) survival curve for the overall survival (OS) of the low and high CDI group patients in the TCGA-OV, GSE63885 + GSE26193, and GSE140082 cohorts. D Receiver operating characteristic (ROC) analysis of the model in the TCGA-OV, GSE63885 + GSE26193, and GSE140082 cohorts (Only the 3-, 5-, and 7-year survival is shown, and the rest is detailed in supplementary materials)
Fig. 5
Fig. 5
Establishment and performance evaluation of nomogram model. A Univariate Cox hazard regression for the clinicopathologic characteristics and normalized CDI in the TCGA-OV cohort. B Multivariate Cox hazard regression for the clinicopathologic characteristics and normalized CDI in the TCGA-OV cohort. C Nomogram predicting the 3-, 6-, and 9-year OS of patients with SOC. D An alluvial diagram shows the interrelationship between the grade, stage, nomogram, and CDI groups in patients with SOC. E Calibration plots for 3-, 6-, and 9-year OS probabilities in the TCGA-OV cohort. F Decision curve analysis for predicting the OS. G ROC analysis of the nomogram in the TCGA-OV, GSE63885 + GSE26193, and GSE140082 cohorts (only the 3-, 5-, and 7-year survival is shown, and the rest is detailed in supplementary materials)
Fig. 6
Fig. 6
Functional enrichment analysis of PCD genes model between low- and high-CDI patients with SOC. A Genes differentially expressed between the high- and low-CDI patients with SOC. Yellow: upregulated genes in the high CDI group; blue: upregulated genes in the low CDI group; B Network of the top 20 clusters with their representative enriched terms (one per cluster): colored by cluster ID, where nodes that share the same cluster-ID are typically close to each other. C Gene Set Enrichment Analysis (GSEA) enrichment plots for the DEGs; the top 25 pathways are displayed based on NES values. D GSEA of the epithelial-mesenchymal transition, angiogenesis, inflammatory response, and apoptosis. E KEGG analysis of genes in patients with SOC with high and low CDI. F Reactome pathway analysis of genes in patients with SOC with high and low CDI
Fig. 7
Fig. 7
Single-cell transcriptome analysis reveals an association between CDI and malignant tumor cells. A t-distributed stochastic neighbor embedding (tSNE) visualization of the diverse cell types in tumor samples from GSE184880. B Bubble plots of cell-type marker gene expression levels. C tSNE visualization of the tumor cells and WFDC2 and PAX8 expression. D tSNE and violin plots showing the high and low CDI tumor groups and the CDI values of the tumor cells. E Box plot of scaled scores of the cancer-relevant pathways in the tumor cells. F GSEA of the hallmark epithelial-mesenchymal transition gene set and hypoxia. G Chord diagram of the signaling pathways from the high and low CDI tumor groups to other cells. H Heatmaps and Circos plots of the LAMININ, COLLAGEN, and VEGF signaling pathway networks. I Heatmaps and Circos plots of the TIGIT signaling pathway networks
Fig. 8
Fig. 8
Dissection of tumor microenvironment (TME) based on PCD signature. A Box plots of the proportions of 22 types of immune cells between the high and low CDI groups, as predicted by CIBERSORT. B Violin plots of the log-homogenized M2/M1 macrophage ratio (M2/M1 ratio) between the high and low CDI groups in the TCGA-OV, GSE63885 + GSE26193, and GSE140082 cohorts. C tSNE visualization of myeloid cells from five patients with SOC in the GSE184880 cohort. D Bubble plot of the myeloid subset marker gene expression. E tSNE visualization of the CDI cluster group of macrophages. F Lollipop plot of the GSEA results for macrophage M1 and M2 scoring. G Bubble plot of the differentially expressed genes between the high and low CDI clusters of macrophages. H Bar plots showing that macrophages in the high CDI cluster are more likely to originate from high-stage patients
Fig. 9
Fig. 9
High CDI region overlaps with malignant areas of the tumor. A Projections and tSNE visualization of spot clusters from a patient with SOC. B Bar plots of cell proportions after deconvolution. C tSNE visualization of the main cell type for each spot and the expression of SOC marker genes. D tSNE visualization of the myeloid cell deconvolution and normalized CS values. E tSNE and violin plots showing the CDI group of clusters dominated by tumor cells. F tSNE visualization of angiogenesis-related gene expression. G Bubble plots showing the enriched GO terms (n = 5) of the top 200 upregulated genes in the high CDI cluster dominated by tumor cells
Fig. 10
Fig. 10
Identification of mutation landscape and tumor neoantigens. A Waterfall plot of differentiated somatic mutation features between the high and low CDI groups. B, C Mutations and neoantigen loads between the two subgroups are displayed. D, E and F Survival analyses of patients with SOC stratified by the CDI and mutation loads, TP53 status, or neoantigen burden using KM survival analysis. NEO, neoantigen burden; H, high; L, low. *P < 0.05, **P < 0.01, ***P < 0.001
Fig. 11
Fig. 11
Evaluation of immunotherapy's benefits. A Bar plot of the correlation between immune checkpoint genes and CDI values in the TCGA-OV cohort. *: P < 0.05, **: P < 0.01, ***: P < 0.001. B The immunophenoscore scores of ips_ctla4_neg_pd1_neg (CTLA4-/PD1 − treatment), ips_ctla4_neg_pd1_pos (CTLA4-/PD1 + treatment), ips_ctla4_pos_pd1_neg (CTLA4 + /PD1 − treatment), and ips_ctla4_pos_pd1_pos (CTLA4 + /PD1 + treatment) between the high and low CDI groups. C Tumor mutational burden scores in the high and low CDI groups of the IMvigor210 cohort. D Differences in the CDI scores between patients with complete response (CR)/partial response (PR) and those with stable disease (SD)/progressive disease (PD) in the Imvigor210 cohort. E The variation in CDI scores among patients with CR, PR, SD, and PD in the Imvigor210 cohort. *P < 0.05, **P < 0.01, ***P < 0.001. F The differing response rates to immunotherapy between the high and low CDI groups in the Imvigor210 cohort. G Subgroup analysis based on immune phenotypes revealed differences between the high and low CDI groups in the immune-inflamed, immune-excluded, and immune-desert subtypes. H Tumor immune dysfunction and exclusion (TIDE) scores of the high and low CDI groups in the TCGA-OV cohort
Fig. 12
Fig. 12
Estimation of drug sensitivity and chemotherapy resistance. A Bubble plot showing the relationship among drugs, model genes, and CDI. B Violin plots compare the drugs' half-maximal inhibitory concentration (IC50) between the high and low CDI groups in the TCGA-OV cohort. C Correlation between the model genes and classical therapeutic targets in SOC. The red and blue lines represent positive and negative correlations, respectively. The thickness of the lines represents the degree of correlation, and the gray line represents P > 0.05. D Alluvial diagram showing the relationship between macrophages, chemotherapy, and CDI in the TCGA-OV cohort

Similar articles

Cited by

References

    1. Awasthi N, et al. BMS-754807, a small-molecule inhibitor of insulin-like growth factor-1 receptor/insulin receptor, enhances gemcitabine response in pancreatic cancer. Mol Cancer Ther. 2012;11(12):2644–53. - PubMed
    1. Basu M, et al. Invasion of ovarian cancer cells is induced byPITX2-mediated activation of TGF-β and Activin-A. Mol Cancer. 2015;14:162. - PMC - PubMed
    1. Belur Nagaraj A, et al. The miR-181a-SFRP4 axis regulates Wnt activation to drive stemness and platinum resistance in ovarian cancer. Can Res. 2021;81(8):2044–55. - PMC - PubMed
    1. Bill R, et al. CXCL9:SPP1 macrophage polarity identifies a network of cellular programs that control human cancers. Science (New York, NY). 2023;381(6657):515–24. - PMC - PubMed
    1. Brogden RN, Wiseman LR, Topotecan. A review of its potential in advanced ovarian cancer. Drugs. 1998;56(4):709–23. - PubMed

MeSH terms

Substances

LinkOut - more resources