. 2025 Jan 7;135(4):e188222.
doi: 10.1172/JCI188222.

CXCL12 ameliorates neutrophilia and disease severity in SARS-CoV-2 infection

Affiliations

CXCL12 ameliorates neutrophilia and disease severity in SARS-CoV-2 infection

Jian Zheng et al. J Clin Invest. .

Abstract

Neutrophils, particularly low-density neutrophils (LDNs), are believed to contribute to acute COVID-19 severity. Here, we showed that neutrophilia can be detected acutely and even months after SARS-CoV-2 infection in patients and mice, while neutrophil depletion reduced disease severity in mice. A key factor in neutrophilia and severe disease in infected mice was traced to the chemokine CXCL12 secreted by bone marrow cells and unexpectedly, endothelial cells. CXCL12 levels were negatively correlated with LDN numbers in longitudinal analyses of patient blood samples. CXCL12 blockade in SARS-CoV-2-infected mice increased blood/lung neutrophil numbers, thereby accelerating disease progression without changing lung virus titers. The exaggerated mortality caused by CXCL12 blockade could be reversed by neutrophil depletion. In addition, blocking interactions between SARS-CoV-2 and angiotensin-converting enzyme 2 (ACE2) reduced CXCL12 levels, suggesting a signal transduction from virus-mediated ACE2 ligation to increased CXCL12 secretion. Collectively, these results demonstrate a previously unappreciated role of CXCL12 in diminishing neutrophilia, including low-density neutrophilia, and its deleterious effects in SARS-CoV-2 infections. The results also support the involvement of SARS-CoV-2-endothelial cell interactions in viral pathogenesis.

Keywords: COVID-19; Chemokines; Endothelial cells; Infectious disease; Neutrophils.


Conflict of interest statement

Conflict of interest: KW and KK are employees of BIOAGE Labs.

Figures

Figure 1
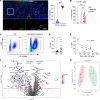
Figure 1. Neutrophilia and accumulated LDNs in COVID-19 patients.
(A) Massive infiltration of LDNs in the lungs of deceased COVID-19 patients was identified with metal isotope–labeled antibodies (left and right panels). Images are representative of 5 slides from 5 deceased COVID-19 cases. Scale bars: 100 μm. The percentage of CD16hi and CD16int neutrophils in 3 regions of interest (ROIs) of each slide (middle panel) was quantitated by FlowJo after converting imaging files into fcs files. ****P < 0.0001 by Student’s t test. (B) Peripheral blood LDNs in healthy donors (HD, n = 13) and COVID-19 patients with moderate (n = 23) or severe disease (n = 16). **P < 0.01; ****P < 0.0001 by 1-way ANOVA with Tukey’s multiple comparisons. (CE) A cohort of convalescent COVID-19 patients and healthy donors were recruited at times ranging from 1 month to 13 months after hospital discharge. A representative flow plot (C) and summary (D) of CD66b+ LDN frequency in the peripheral blood of convalescent patients (CP, collected at 1–13 months after discharge) and age-matched healthy donors (HD) are shown. n = 11. *P < 0.05 by Student’s t test. (E) Frequency of LDNs was negatively correlated with time from discharge (each point represents the data obtained from an individual patient). (F and G) A total of 1830 proteins were identified by mass spectrometry of normal-density neutrophils (NDNs) and low-density neutrophils (LDNs) analyzed from each of 13 patients with severe COVID-19. Proteins were quantified from average peptide expression of pooled data using Scaffold, and differential expression of proteins was determined by analysis with MetaboAnalyst. (F) A volcano plot of the 1830 proteins expressed by NDNs and LDNs from COVID-19 patients, comparing log2(fold change) to –log10(P value), with proteins above the red line demonstrating P < 0.05. A total of 326 proteins showed significantly greater expression in NDNs, and 134 proteins showed significantly greater expression in LDNs. (G) Differences in the pattern of protein expression by LDNs and NDNs were compared using orthogonal partial least squares discriminant analysis (orthoPLS-DA).
Figure 2
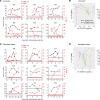
Figure 2. Plasma CXCL12 levels negatively correlate with peripheral blood LDNs in longitudinal analyses.
(A) Peripheral blood samples from 6 SARS-CoV-2–infected survivors were collected longitudinally during hospitalization, as described previously (9). Concentrations of plasma CXCL12 and peripheral blood LDNs were measured. Black dotted line: Average plasma CXCL12 of healthy donors. Red dotted line: Average LDNs of healthy donors. (B) Correlation between concentration of plasma CXCL12 and percentage of peripheral blood LDNs analyzed by repeated measures correlation (with log transformation to Ln to meet linear assumption). R = –0.5437174 (P = 0.003374754). (C) Peripheral blood samples from 9 SARS-CoV-2–infected deceased patients were collected at multiple time points during hospitalization, as described previously (9). Concentrations of plasma CXCL12 and peripheral blood LDNs are shown. Black dotted line: Average CXCL12 of healthy donors. Red dotted line: Average LDNs of healthy donors. (D) Correlation between concentration of plasma CXCL12 and percentage of peripheral blood LDNs analyzed by repeated measures correlation (with log transformation to Ln to meet linear assumption). R = –0.01767992 (P = 0.9184839).
Figure 3
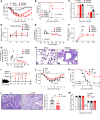
Figure 3. Neutrophil depletion ameliorates disease severity of SARS2-N501YMA30–infected mice.
(AC) Eight- to 10-month-old (n = 5) C57BL/6N mice were infected with 1000, 2000, or 5000 PFU SARS2-N501YMA30. Weight (A), survival (B), and lung infectious virus titers (C) are shown. Data are representative of 3 independent experiments. Data in A and C are mean ± SEM. LOD, limit of detection. u.d., undetected. *P < 0.05 by 1-way ANOVA with Tukey’s multiple comparisons in C. (DH) Middle-aged C57BL/6N mice (8–10 months old, n = 5) were infected with 1000, 2000, or 5000 PFU SARS2-N501YMA30 virus. (D and F) The number of neutrophils in peripheral blood (D) and lung (F) of infected (n = 8) and control mice (n = 5) was determined by flow cytometry at the indicated time points. Data are mean ± SEM and are representative of 3 independent experiments. (E and G) The correlation between the fold increase in peripheral blood (E) or lung-derived (G) neutrophils and weight change of SARS2-N501YMA30–infected mice (n = 8) on day 5 after infection is shown. Data are representative of 3 independent experiments. (H) Infiltration of neutrophils (arrows) in lungs of mock- or SARS2-N501YMA30–infected (5000 PFU) mice. Images are representative of 3 independent experiments. Arrows: PMNs. (IM) Eight- to 10-month-old C57BL/6N mice were infected with 5000 PFU SARS2-N501YMA30 and treated with PBS, α-Ly6G antibody, or isotype control (IC, isotype Ig) (n = 15 mice/group). Experimental setup (I), weight (J), survival (K), lung histopathology (L), and infectious virus titers (M) are shown. Data in J and M are mean ± SEM. Data in K are a summary of 3 independent experiments. Data in L are representative images and a summary of 2 independent experiments (data are mean ± SEM) (n = 9). **P < 0.01 by Student’s t-test. Scale bars: 25 μm (H) and 430 μm (L).
Figure 4
Figure 4. Accumulation of LDNs correlates with disease severity of SARS2-N501YMA30–infected mice.
(A) The percentage and absolute number of peripheral blood neutrophil subsets — CD15+CD16+CD115CXCR2 (immature), CD16hiCD62LhiCXCR2hiCXCR4lo (mature), CD11bhi CXCR2loCD62LloCXCR4hi (senescent), CD11b+CD18+Gr-1int (degranulated), and ARG1+CD15+CD33+CD101CXCR4+ (LDNs) — in SARS2-N501YMA30–infected mice on day 5 after infection (n = 5). Data are mean ± SEM and are representative of 3 independent experiments. *P < 0.05, **P < 0.01 by Student’s t test. (B and C) Correlation between fold increase in peripheral blood (B) and lung (C) immature neutrophils, degranulated neutrophils, and LDNs, and weight change of SARS2-N501YMA30–infected mice on day 5 after infection (n = 8). Peripheral blood: R = 0.3744 (P = 0.1069), 0.06653 (P = 0.5374), and 0.6501 (P = 0.0156) for immature neutrophils, degranulated neutrophils, and LDNs. Lung: R =0.2862 (P = 0.1719), 0.01357 (P = 0.7836), and 0.9016 (P = 0.0003) for immature neutrophils, degranulated neutrophils, and LDNs. Data are representative of 2 independent experiments. (D and E) Young (8- to 10-week-old) or middle-aged (8- to 10-month-old) C57BL/6N mice were sublethally infected with 1000 or 2000 PFU. The numbers of peripheral blood neutrophils (D) and LDNs (E) were determined at the indicated time points by flow cytometry. n = 5. Data are mean ± SEM and are representative of 2 independent experiments. *P < 0.05; **P < 0.01 by 1-way ANOVA with Tukey’s multiple comparisons.
Figure 5
Figure 5. CXCL12/CXCR4 axis regulates blood neutrophil numbers in SARS2-N501YMA30–infected mice.
(A) The correlation between the concentration of plasma CXCL12 and the fold change in peripheral blood CD4+ and CD8+ T cells, immature neutrophils, degranulated neutrophils, and LDNs in SARS2-N501YMA30–infected mice (5000 PFU) on day 5 after infection (n = 8). R = 0.003954 (P = 0.8824) (CD4+ T cells), 0.0006628 (P = 0.9518) (CD8+ T cells), 0.1851 (P = 0.2873) (immature neutrophils), 0.02186 (P = 0.7268) (degranulated neutrophils), and 0.9547 (P < 0.0001) (LDNs). Data are representative of 3 independent experiments. (B) Expression of CXCR4 by peripheral blood CD4+ and CD8+ T cells, and neutrophil subsets of mice infected with SARS2-N501YMA30 on day 5 after infection. (C) Expression of intracellular CXCL12 in CD45CD31+CD54+ vascular endothelial cells on day 5 after infection. (D) Summary of CXCL12 expression (mean fluorescence intensity, MFI) in peripheral blood cell subsets and endothelial cells, n = 5. Data are representative of 2 independent experiments and are mean ± SEM. **P < 0.01 by 1-way ANOVA with Tukey’s multiple comparisons. (E) RNA (right y axis) and protein (left y axis) CXCL12 levels in homogenates of bone marrow harvested from SARS2-N501YMA30–infected mice were determined at the indicated time points by RT-qPCR and ELISA, respectively. n = 4. Data are representative of 2 independent experiments.
Figure 6
Figure 6. Blockade of CXCL12 modifies disease severity and neutrophil distribution.
(AD) Experimental setup (A), survival (B), lung histopathology (C), and infectious viral titers (D) of 8- to 10-month-old C57BL/6N mice infected with 1000 PFU SARS2-N501YMA30 followed by treatment with α-CXCL12 antibody or its isotype control (IC, isotype Ig). Data in B are a summary of 4 independent experiments (n = 20). Data in C are representative images and a summary of 2 independent experiments (n = 10, samples harvested on day 5 after infection). Data in D are mean ± SEM (n = 8) and are a summary of 2 independent experiments. LOD, limit of detection. Scale bar: 430 μm. (EG) Experimental setup (E), numbers of total neutrophils/LDNs (F), and CFSE-stained neutrophils/LDNs (G) identified in peripheral blood, lung, and bone marrow (BM) after treatment with α-CXCL12 antibody or IC (n = 5). Data are mean ± SEM and are representative of 2 independent experiments. *P < 0.05, **P < 0.01, ***P < 0.001 by t-test in F and G. (H and I) Experimental setup (H) and survival (I) of 8- to 10-month-old C57BL/6N mice infected with 1000 PFU SARS2-N501YMA30 followed by treatment with α-CXCL12 antibody and α-Ly6G antibody or IC. Data in I are a summary of 2 independent experiments (n = 8).
Figure 7
Figure 7. SARS-CoV-2-RBD-Fc modifies CXCL12 expression by vascular endothelial cells and the outcome of SARS-CoV-2 infection.
(A) Weights of mice infected with 500 PFU IAV-PR8 (n = 6), 500 PFU MERSMA (n = 6), or 5000 PFU SARS2-N501YMA30 (n = 8) measured on day 5 after infection. (B and C) Correlation between plasma CXCL12 concentration and fold change in peripheral blood neutrophils (B) and LDNs (C) in IAV-PR8–, MERSMA-, and SARS2-N501YMA30–infected mice on day 5 after infection. (B) R = 0.04474 (P = 0.6874) (IAV-PR8), 0.02521 (P = 0.7639) (MERSMA), and 0.5072 (P = 0.0475) (SARS2-N501YMA30). (C) R = 3.492 × 10⁻⁶ (P = 0.9972) (IAV-PR8), 0.4028 (P = 0.1759) (MERSMA), and 0.9547 (P < 0.0001) (SARS2-N501YMA30). Data are representative of 2 independent experiments. Mock- (D), SARS2-N501YMA30–infected (5000 PFU) (E), or IAV-PR8–infected (500 PFU) (F) middle-aged C57BL/6N mice (8–10 months old, n = 5/group), or MERSMA-infected (500 PFU) hDPP4-KI mice (G) were treated with 0.5 mg/kg body weight of MERS (EMC)-NTD-Fc, SARS-2 (N501Y)-RBD-Fc, or SARS-2 (ancestral)-RBD-Fc in 0.5 mL PBS by i.v. injection on days 2 and 4 after infection. Mice were euthanized on day 5 after infection and abdominal aortas were harvested. The expression of CXCL12 in endothelial cells was determined by intracellular staining via flow cytometry. Data are representative of 2 independent experiments. (H and I) SARS2-N501YMA30–infected (5000 PFU) mice were treated with SARS2 (N501Y)-RBD-Fc (n = 8) or control MERS (EMC)-NTD-Fc (n = 5). Survival (H) and endothelial cell expression of CXCL12 (I) were determined. ****P < 0.01 by 1-way ANOVA with Tukey’s multiple comparisons. Data are mean ± SEM and are representative of 2 independent experiments. mpk, mg/kg body weight.

Similar articles

References

    1. Goyal P, et al. Clinical characteristics of Covid-19 in New York City. N Engl J Med. 2020;382(24):2372–2374. doi: 10.1056/NEJMc2010419. - DOI - PMC - PubMed
    1. Vabret N, et al. Immunology of COVID-19: current state of the science. Immunity. 2020;52(6):910–941. doi: 10.1016/j.immuni.2020.05.002. - DOI - PMC - PubMed
    1. Zhang W, et al. SARS-CoV-2 infection results in immune responses in the respiratory tract and peripheral blood that suggest mechanisms of disease severity. Nat Commun. 2022;13(1):2774. doi: 10.1038/s41467-022-30088-y. - DOI - PMC - PubMed
    1. Lowery SA, et al. Innate immune and inflammatory responses to SARS-CoV-2: Implications for COVID-19. Cell Host Microbe. 2021;29(7):1052–1062. doi: 10.1016/j.chom.2021.05.004. - DOI - PMC - PubMed
    1. Cavalli G, et al. Interleukin-1 and interleukin-6 inhibition compared with standard management in patients with COVID-19 and hyperinflammation: a cohort study. Lancet Rheumatol. 2021;3(4):e253–e261. doi: 10.1016/S2665-9913(21)00012-6. - DOI - PMC - PubMed

MeSH terms