. 2025 Jan 7;13(1):e009993.
doi: 10.1136/jitc-2024-009993.

Disruption of tumor-intrinsic PGAM5 increases anti-PD-1 efficacy through the CCL2 signaling pathway

Affiliations

Disruption of tumor-intrinsic PGAM5 increases anti-PD-1 efficacy through the CCL2 signaling pathway

Xiaoying Wei et al. J Immunother Cancer. .

Abstract

Background: Immunosuppressive phenotype compromised immunotherapy efficacy of hepatocellular carcinoma. Tumor cells intrinsic mitochondria dynamics could pass effects on the extracellular microenvironment through mtDNA stress. PGAM5 anchors at mitochondria and regulates mitochondria functions. We aim to explore whether the regulation of tumor-intrinsic PGAM5 on mitochondria affects tumor-infiltrating immune cells in the microenvironment and whether tumor-intrinsic PGAM5 can be a therapeutic target to enhance the immunotherapy efficacy of hepatocellular carcinoma (HCC).

Methods: We analyzed the correlation of PGAM5 expression and immune cells infiltration using Gene Expression Omnibus (GEO) and The Cancer Genome Atlas Liver Hepatocellular Carcinoma (TCGA-LIHC) data sets based on cibersort algorithm and tumor-tissue arrays from two independent cohorts. To further validate our findings, we established subcutaneous and orthotopic mouse HCC models with tumor-intrinsic Pgam5 deficiency and analyzed tumor-infiltrating immune cells by flow cytometry and single-cell RNA sequencing. Mechanistically, we established an in vitro co-culture system and analyzed proteomics data to find out the bridge between tumor cell PGAM5 and tumor-associated macrophages (TAMs) in the microenvironment. Immunofluorescence, chromatin-immunoprecipitation, ELISA, mass spectrometry were conducted to explore the molecular pathway. Macrophages were depleted to investigate whether the effects of tumor-intrinsic PGAM5 on TAMs could affect immunotherapy efficacy in HCC orthotopic and subcutaneous mouse models.

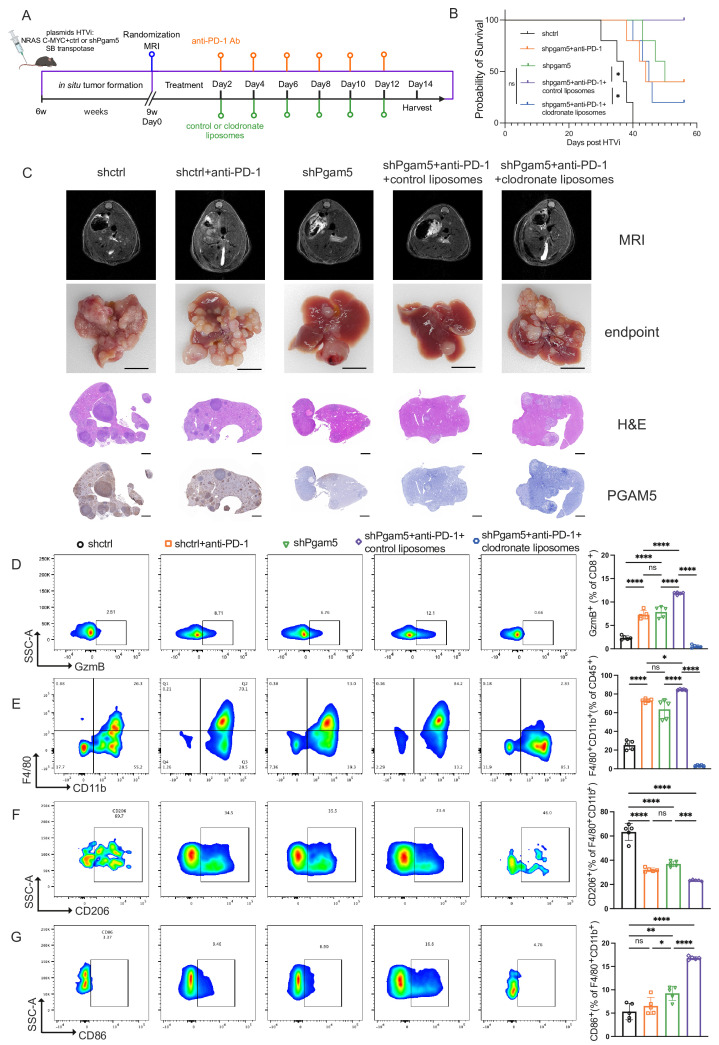
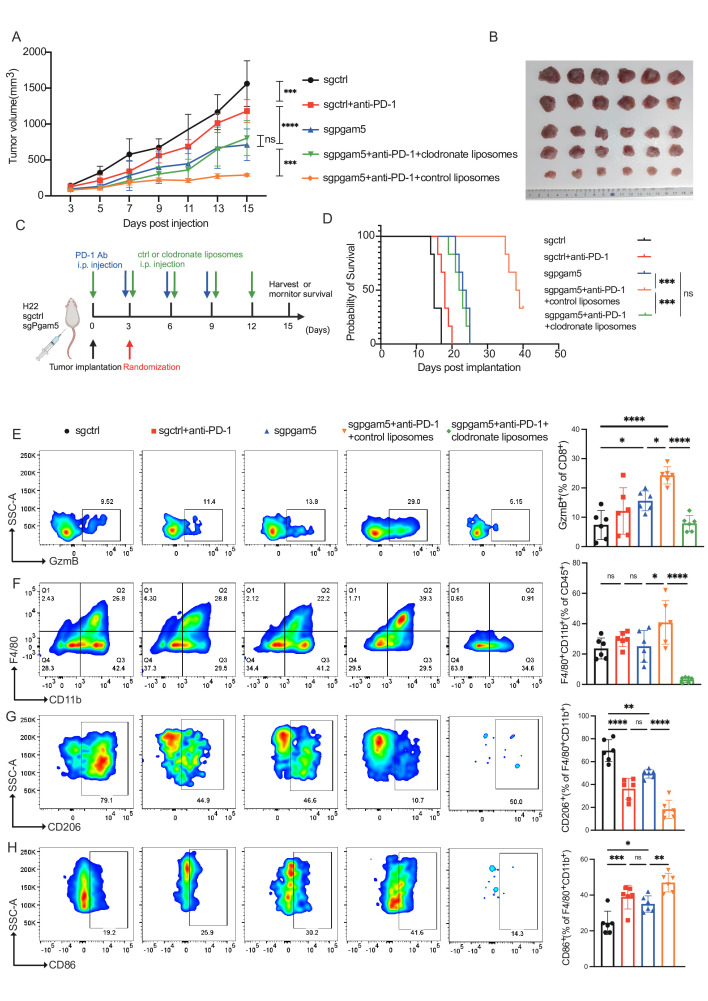
Results: PGAM5 expression in tumor was positively correlated with M2-phenotype TAM infiltration in patients with both HCC and mouse HCC tumor models. High tumor-intrinsic PGAM5 expression promoting M2 TAMs infiltration correlated with poor clinical-pathological characteristics and prognosis in patients with HCC. Disruption of tumor-intrinsic Pgam5 reduced TAM M2 polarization and inhibited HCC tumor growth in tumor-bearing mice. Mechanistically, in HCC cells PGAM5 deficiency inhibited mitochondria fission by promoting TRIM28 binding with DRP1, which increased ubiquitination and degradation of DRP1. Tumor-intrinsic PGAM5 deficiency mediated mitochondria fusion and reduced cytosolic mtDNA stress which attenuated TLR9 activation and downstream NF-κB-regulated CCL2 secretion. Furthermore, disruption of tumor-intrinsic Pgam5 significantly facilitated CD8+ T cells activation and improved anti-programmed cell death protein-1 therapeutic efficacy with macrophages depletion compromising synergistic antitumor immune response.

Conclusion: Our results shed light on the effect of tumor mitochondria dynamics on TAMs in tumor microenvironment. Tumor-intrinsic PGAM5 can be a therapeutic target to improve immunotherapy efficacy in patients with HCC.

Keywords: Cytokine; Hepatocellular Carcinoma; Immune modulatory; Macrophage; Mitochondria.


Conflict of interest statement

Competing interests: No, there are no competing interests.

Figures

Figure 1
Figure 1. Tumor-intrinsic PGAM5 positively correlates with stroma CD206 expression mediating poor prognosis in patients with HCC. (A) Representative IHC staining images of PGAM5, CD206, CD86, CD8 in HCC tissues of TJMUCH cohort. (B–D) IHC score correlation between PGAM5 and CD206 (B), CD86 (C), CD8 (D) in the TJMUCH cohort determined by Pearson correlation test. (E–G) Overall survival analysis for patients with HCC from TJMUCH cohort with PGAM5/CD206 (E), PGAM5/CD86 (F), PGAM5/CD8 (G) co-expression using Kaplan-Meier method by log-rank test. (H–I) Typical multi-immunostaining images of Hep-par1, PGAM5, CD206 (H), CD86 (I) in HCC tumor tissues of patients from the First Affiliated Hospital of USTC. (J–K) Pearson correlations between percent of tumor positive PGAM5 and CD206 (J), CD86 (K) positive per cent in the stroma of multi-immunostaining. HCC, hepatocellular carcinoma; IHC, immunohistochemistry.
Figure 2
Figure 2. Mouse tumor-intrinsic Pgam5 deficiency inhibits tumor growth and M2 macrophages infiltration. (A–F) Gross appearance (A, B), tumor volume (C, D) and tumor weights (E, F) of Hepa1-6 (n=5 in each group) and H22 (n=6 in each group) subcutaneous tumor in sgctrl and sgPgam5 groups. (G–J) Percentage of CD206+ F4/80+CD11b+ and CD86+ F4/80+CD11b+ cells in subcutaneous Hepa1-6 tumor (G, H) and H22 tumor (I, J). (K) Schematic diagram and time flow of sleeping-beauty system for induction of in situ liver cancer. (L) MRI scan, gross appearance of mice in situ liver cancer and PGAM5 immunostaining in ctrl and shPgam5 groups. (M–N) Tumor numbers (M) and tumor diameter (N) of in situ liver cancer nodules in shctrl and shPgam5 groups (n=4 in each group). (O–P) UMAPs of cell clusters distribution of whole clusters (O) and myeloid clusters (P). (Q) Dot plot showing expression of known cluster-specific marker genes. Dot size reflects the percentage of cells in the cluster expressing the marker. Dot size represents average expression level of the gene in each cluster. (R) The histogram of the proportion of the individual cell cluster in the myeloid population in shctrl and shPgam5 groups. *p<0.05, **p<0.01, and ***p<0.001, ****p<0.0001, ns: not significant. IHC, immunohistochemistry; UMAP, uniform manifold approximation and projection.
Figure 3
Figure 3. PGAM5 reduced CCL2 secretion in HCC cells by downregulating DRP1. (A) Schematic diagram of the in vitro co-culture system for Huh7 shctrl or shPGAM5 cells and phorbol-12-myristate-13-acetate-induced THP-1 cells. (B) Quantitative PCR analysis of macrophage polarization maker genes of THP-1 cells co-cultured with indicated HCC cells. (C) cytokine antibody array incubated with culture medium of Huh7 shctrl or shPGAM5 cells. (D) Quantitative PCR analysis of macrophage M1/M2 polarization maker genes of THP-1 in the co-culture system, culture medium of Huh7 shPGAM5 cells were supplemented with recombinant CCL2 and HCCLM3 PGAM5 OE cells were supplemented with neutralizing-CCL2 antibody. (E) TOP20 GO enrichment of differentially expressed proteins in Huh7 shPGAM5 cells compared with shctrl cells. (F) Volcano plot of significantly differentially expressed proteins in Huh7 shPGAM5 cells compared with shctrl cells. (G) Western blot analysis of protein expression of PGAM5 and mitochondria dynamic proteins DRP1, MFN1, MFN2, OPA1 in HCC cells. (H) Western blot analysis of DRP1 overexpression efficiency in Huh7 shPGAM5 cells by lenti-virus infection. (I) Concentration of CCL2 in the supernatant of indicated HCC cells was measured by ELISA. (J) Western blot analysis of DRP1 silencing efficiency in HCCLM3 PGAM5-OE cells by transient transfection of SiRNA. (K) Concentration of CCL2 in the supernatant of indicated HCC cells was measured by ELISA kit. *p<0.05, **p<0.01, and ***p<0.001, ****p<0.0001, ns: not significant. HCC, hepatocellular carcinoma; IHC, immunohistochemistry; UMAP, uniform manifold approximation and projection.
Figure 4
Figure 4. PGAM5 deficiency inhibits mitochondria fission and downstream mtDNA-TLR9-NF-κB-CCL2 pathway. (A) Mitochondria morphology of HCC cells with PGAM5 knock-down or overexpression indicated by mitotracker. (B) Confocal images of cytosolic mtDNA stained with picogreen (green) and mitochondria with mitotracker (red) in HCC cells as indicated. (C) Cytosolic mtDNA quantified by quantitative PCR in HCC cells with PGAM5 knock-down or overexpression. (D) Co-localization of TLR9 (red) and mtDNA (green) in Huh7 shctrl and shPGAM5 cells as indicated by confocal images. (E) upper: schematic of three NF-κB-binding sites in the promoter region of the CCL2. Bottom: chromatin immunoprecipitation analysis of NF-κB-binding sites in CCL2 promoter region in Huh7 cells. Anti-Histone3 lysates were used as positive control. (F) Western blot analysis of NF-κB in the cytoplasm and nuclear in Huh7 shctrl and shPGAM5 cells. (G) NF-κB distribution in cytoplasm and nuclear in Huh7 cells treated as indicated. (H) Concentration of CCL2 in the supernatants of Huh7 cells treated as indicated. *p<0.05, **p<0.01, and ***p<0.001, ****p<0.0001, ns: not significant. HCC, hepatocellular carcinoma.
Figure 5
Figure 5. PGAM5 interacts with DRP1 in a mutually exclusive manner with TRIM28 to attenuated DRP1 ubiquitination. (A) Western blot analysis of the effect of PGAM5 on DRP1 degradation in HCC cells treated with indicated concentrations of CHX at consecutive time points. (B) Co-immunoprecipitation of PGAM5 and DRP1 in two HCC cell lines. (C) IP analysis of ubiquitin linked to DRP1 in HCC cells in the presence of MG-132. (D) Co-immunoprecipitation of PGAM5, DRP1, TRIM28 in Huh7 shctrl and shPGAM5 cells. (E) Western blot analysis of TRIM28 silencing efficiency using small interfering RNA. (F) Western blot analysis of the effect of TRIM28 on DRP1 degradation with shPGAM5 knockdown in Huh7 cells. ***p<0.001, ****p<0.0001, ns: not significant. HCC, hepatocellular carcinoma; IP, immunoprecipitation.
Figure 6
Figure 6. Disruption of tumor-intrinsic Pgam5 synergized anti-PD-1 efficacy in orthotopic HCC mouse model. (A) Schematic illustration of orthotopic HCC model establishment and treatment timeline. (B) Survival analysis for HTVi mice in indicated groups (n=5 in each group). (C) MRI image of mouse liver at the randomization point, gross picture of mouse liver at endpoint, H&E stain and PGAM5 immunohistochemistry of mouse liver at endpoint in indicated groups. Scale bars in gross liver represent 1 cm; scale bars in H&E stain and immunohistochemistry images stand for 1000 µm. (D–G) Representative gated proportion and percentage statistics of Gzmb+CD8+ T cells ((D), F4/80+CD11b+CD45+ (E), CD206+ F4/80+CD11b+ (F), CD86+ F4/80+CD11b+ (G). *p<0.05, **p<0.01, and ***p<0.001, ns: not significant. HCC, hepatocellular carcinoma; HTVi, hydrodynamic tail vein injection; PD-1, programmed cell death protein-1.
Figure 7
Figure 7. Disruption of tumor-intrinsic Pgam5 enhanced anti-PD-1 efficacy in subcutaneous tumor-bearing mice. (A) Tumor volume of H22 subcutaneous tumor of indicated treatment (n=6 in each group). (B) Gross image of tumor in each group of part A. (C) Schematic schedule of anti-PD-1 and clodronate or ctrl liposomes treatment in subcutaneous tumor model. (D) Survival curves for mice in each group (n=6). (E–H) Flow cytometry analysis of tumor-infiltrating immune cells in subcutaneous tumor of each group (n=6). Representative gated proportion and percentage statistics of Gzmb+CD8+ T cells (E), F4/80+CD11b+(F), CD206+ F4/80+CD11b+ (G), CD86+ F4/80+CD11b+ (H). *p<0.05, **p<0.01, and ***p<0.001, ns: not significant. i.p, intraperitoneal injection; PD-1, programmed cell death protein-1.
Figure 8
Figure 8. Schematic mechanism for the effect of tumor-intrinsic PGAM5 on tumor-associated macrophages. Mitochondria in hepatocellular carcinoma cells are in a status of hyperfission. PGAM5 deficiency promotes TRIM28 bind to DRP1 and increase DRP1 ubiquitination, which accelerates DRP1 degradation by proteasome. DRP1 downregulation inhibits mitochondria fission. The leakage of mtDNA was reduced, downstream TLR9-NF-κB-CCL2 axis is deactivated. The attenuation of CCL2 secretion facilitates TAM repolarization to M1 phenotype and potentiates PD-1 antibody-mediated activation of CD8+ T cells. PD-1, programmed cell death protein-1; TAM, tumor-associated macrophage; TGF, transforming growth factor; TNF, tumor necrosis factor.

References

    1. Sung H, Ferlay J, Siegel RL, et al. Global Cancer Statistics 2020: GLOBOCAN Estimates of Incidence and Mortality Worldwide for 36 Cancers in 185 Countries. CA Cancer J Clin. 2021;71:209–49. doi: 10.3322/caac.21660. - DOI - PubMed
    1. Rumgay H, Ferlay J, de Martel C, et al. Global, regional and national burden of primary liver cancer by subtype. Eur J Cancer. 2022;161:108–18. doi: 10.1016/j.ejca.2021.11.023. - DOI - PubMed
    1. Singal AG, Kanwal F, Llovet JM. Global trends in hepatocellular carcinoma epidemiology: implications for screening, prevention and therapy. Nat Rev Clin Oncol. 2023;20:864–84. doi: 10.1038/s41571-023-00825-3. - DOI - PubMed
    1. Finn RS, Qin S, Ikeda M, et al. Atezolizumab plus Bevacizumab in Unresectable Hepatocellular Carcinoma. N Engl J Med. 2020;382:1894–905. doi: 10.1056/NEJMoa1915745. - DOI - PubMed
    1. Abou-Alfa GK, Lau G, Kudo M, et al. Tremelimumab plus Durvalumab in Unresectable Hepatocellular Carcinoma. NEJM Evid. 2022;1 doi: 10.1056/EVIDoa2100070. - DOI - PubMed

MeSH terms