. 2025 Jan 7;13(1):e010127.
doi: 10.1136/jitc-2024-010127.

Targeting the NLRP3 inflammasome abrogates cardiotoxicity of immune checkpoint blockers

Affiliations

Targeting the NLRP3 inflammasome abrogates cardiotoxicity of immune checkpoint blockers

Yang Lu et al. J Immunother Cancer. .

Abstract

Background: Immune checkpoint inhibitors (ICIs) have revolutionized the treatment of many malignant tumors. However, ICI-induced hyper-immune activation causes cardiotoxicity. Traditional treatments such as glucocorticoids and immunosuppressants have limited effectiveness and may even accelerate tumor growth. This study aimed to identify approaches that effectively reduce cardiotoxicity and simultaneously preserve or enhance the antitumor immunity of ICI therapy.

Methods: ICI injection in melanoma-bearing C57BL/6J female mice was used to simulate cardiotoxicity in patients with tumor undergoing immune therapy. MCC950 was used to block nod-like receptor protein 3 (NLRP3) inflammasome activity. Echocardiography, immunofluorescence, flow cytometry, and reverse transcription quantitative polymerase chain reaction were used to assess cardiac function, immune cell populations, and inflammatory factor levels. Bulk and single-cell RNA sequencing was used to detect the changes in cardiac transcriptome and immunological network.

Results: NLRP3 inhibition reduced inflammatory response and improved cardiac function. Notably, NLRP3 inhibition also resulted in a pronounced suppression of tumor growth. Single-cell RNA sequencing elucidated that MCC950 treatment reduced the cardiac infiltration of pathogenic macrophages, cytotoxic T cells, activated T cells, and their production of inflammatory cytokines, while enhancing the presence of reparative macrophages and naive T cells. In addition, MCC950 attenuated cardiotoxicity induced by dual programmed cell death protein 1 (PD-1) and cytotoxic T-lymphocyte-associated protein 4 (CTLA-4) immunotherapy and promoted tumor regression, and showed efficacy in treating established cardiotoxicity.

Conclusions: Our findings provide a promising clinical approach for preventing and treating cardiotoxicity induced by ICIs, dissociating the antitumor efficacy of ICI-based therapies from their cardiotoxic side effects.

Keywords: Cardiotoxicity; Immune Checkpoint Inhibitor; Immunotherapy; Macrophage; T cell.


Conflict of interest statement

Competing interests: No, there are no competing interests.

Figures
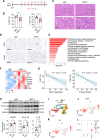
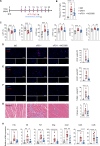
Figure 1
Figure 1. ICI activates the NLRP3/IL-1β pathway of mice and human. C57BL/6J female mice were inoculated with B16F10 melanoma cells on day 0, and were injected intraperitoneally with IgG or αPD-1 antibody every other day from day 7 to day 19. Hearts were collected on day 20. (A) Experimental design. (B) Echocardiographic analysis showing LVEF and LVFS (IgG: n=4, αPD-1: n=8). (C) Representative H&E staining showing inflammatory cells infiltration in heart tissues; scale bar, 50 µm. (D) Representative images of immunostaining for CD8 (top) and F4/80 (bottom) in heart sections of mice; scale bar, 50 µm. (E) Bulk RNA-sequencing analysis was performed on the hearts from IgG group (n=4) and αPD-1 group (n=6). KEGG analysis showing the upregulated pathway in αPD-1 group. (F) Heatmap showing the upregulated genes involved in NLRP3 inflammasome pathway in the αPD-1 group. (G) Correlation analysis between expression level of Nlrp3/Il1b and LVEF in mice. (H) Western blot analysis showing the protein levels of NLRP3, pro-IL-1β, and IL-1β in hearts tissues (IgG: n=5, αPD-1: n=5). (I) Uniform manifold approximation and projection (UMAP) plot of scRNA-seq of public datasets (GSE180045) from peripheral blood mononuclear cells. (J and K) Feature plots with NLRP3 (J) and IL1B (K). (L) Dot plot showing the expression of NLRP3 and IL1B in monocytes from healthy controls (HC), ICI users without myocarditis (ICI), and ICI users with myocarditis (ICI-MC). Data are presented as mean±SD. Data were analyzed by Student’s t-test (B and H) and Spearman’s correlation test (G). *p<0.05, **p<0.01, ***p<0.001, ****p<0.0001 compared with indicated group. DCs, dendritic cells; ICI, immune checkpoint inhibitor; LVEF, left ventricular ejection fraction; LVFS, left ventricular fractional shortening; NLRP3, nod-like receptor protein 3; pDCs, plasmacytoid dendritic cells; RBCs, red blood cells; pB cells, plasma B cells.
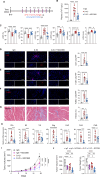
Figure 2
Figure 2. NLRP3 inhibition attenuates ICI-induced cardiac injury. Mice were inoculated with B16F10 melanoma cells on day 0, and injected with either IgG+vehicle, or αPD-1 antibody+vehicle, or αPD-1 antibody+MCC950 every other day from day 7 to day 19. Hearts were collected on day 20. (A) Experimental design. (B) ELISA for plasma cTnT levels of indicated groups. (C) Echocardiographic analysis showing LVEF, LVFS, LVESV, LVEDV, LVIDs, and LVIDd, in mice of each group. (D, E and F) Representative immunofluorescence images for CD8 (D), F4/80 (E), TUNEL (F) and their statistical analysis of per high-power field (HPF, average of 3–6 different 200× visual fields) in the hearts of each group; scale bar, 50 µm. (G) Representative Masson staining images in mouse hearts of each group and their statistical analysis. Scale bar, 50 µm. (H) RT-qPCR analysis for the expression of Il1b, Il6, Tnf, Ifng, Ccl2, Ccl3, Ccl5. n=8 per group. Data are presented as the mean±SD. Data were analyzed by one-way ANOVA followed by Tukey post hoc multicomparison test. *p<0.05, **p<0.01, ***p<0.001, ****p<0.0001 compared with indicated group.cTnT, cardiac troponin t; ICI, immune checkpoint inhibitor; LVEF, left ventricular ejection fraction; LVFS, left ventricular fractional shortening; LVEDV, left ventricular end-diastolic volume; LVESV, left ventricular end-systolic volume; LVIDd, left ventricular internal dimension in diastole; LVIDs, left ventricular internal dimension in systole; RT-qPCR, reverse transcription quantitative polymerase chain reaction; TUNEL, TdT-mediated dUTP nick-end labeling.
Figure 3
Figure 3. NLRP3 blockade promotes antitumor immunity. (A) Tumor volume measurements of the female B16F10 tumor-bearing mice treated with IgG antibody+vehicle, or IgG+MCC950, or αPD-1 antibody+vehicle, or αPD-1 antibody+MCC950. (B) Tumor volume at day 19 of each group. (C) Tumor weight at day 20 of each group. (D) Flow cytometry analysis for the percentage of myeloid cells, TAM, granulocytic MDSC, and monocytic MDSC in the CD45+ immune cells isolated from the tumor. (E) Flow cytometry analysis for the percentage of CD8+ T cells in the CD45+ immune cells, as well as the percentage of CD44+, IFN-γ and TNF-α-producing cells among CD8+ T cells. n=8 per group. Data are presented as mean±SD. Data were analyzed by one-way ANOVA followed by Tukey post hoc multicomparison test. *p<0.05, **p<0.01, ***p<0.001, ****p<0.0001 compared with indicated group. MDSC, myeloid-derived suppressor cell; TAM, tumor-associated macrophage.
Figure 4
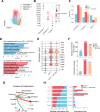
Figure 4. ScRNA-seq of cardiac immune cells and macrophage cell clusters after MCC950 treatment. (A) UMAP plot showing cell clusters of 68 058 cells by scRNA-seq analysis of mouse hearts from IgG group, αPD-1 group and αPD-1 + MCC950 group. (B) Pie chart showing the percentage of each cell cluster in eight immune cell clusters. (C) Proportion of each immune cell cluster in different samples. (D) The UMAP plot of four macrophage subpopulations. (E) Bar plot showing upregulated Gene Ontology biological processes in each macrophage subpopulation. (F) Dot plot showing the expression of specific genes in each macrophage subpopulation. (G) Proportion of each macrophage subpopulation in different samples. (H) Bar plot showing the differences in GO biological processes. DCs, dendritic cells; ILCs, innate lymphocytes; RBCs, red blood cells; ScRNA-seq, single-cell RNA sequencing.
Figure 5
Figure 5. T-cell clusters and intercellular crosstalk analysis. (A) The UMAP plot of three T-cell subpopulations. (B) Dot plot showing the expression of specific genes in each T-cell subpopulation. (C) Proportion of each T-cell subpopulation in different samples. (D) Bar plot showing the differences in GO biological processes. (E) Dot plot showing the expression of specific genes. (F) Bar plot showing the number of intercellular crosstalk inferred interactions in each group. (G) Chord plot of the total number of interactions of cytotoxic T cells with other immune cell subpopulations. (H) Bar plot showing the relative information flow and information flow for different ligand–receptor pathways.
Figure 6
Figure 6. NLRP3 inhibition ameliorates cardiotoxicity of combined ICI therapy. Mice were inoculated with B16F10 melanoma cells on day 0, and were administrated with IgG+vehicle, or anti-PD-1 + anti-CTLA-4 + vehicle, or anti-PD-1 + anti-CTLA-4 + MCC950 every other day from day 7 to day 19. Hearts were collected on day 20. (A) Experimental design. (B) ELISA for plasma cTnT levels of IgG group, dual ICI (D-ICI) group and dual ICI+MCC950 (D-ICI+MCC950) group. (C) Echocardiographic analysis showing cardiac function of each group. (D, E, and F) Representative immunofluorescence images for CD8 (D), F4/80 (E), TUNEL (F) and their statistical analysis of per high-power field (HPF, average of 3–6 different 200× visual fields) in the heart of each group; scale bar, 50 µm. (G) Representative Masson staining images in mouse hearts of each group and their statistical analysis. Scale bar, 50 µm. (H) RT-qPCR analysis for relative mRNA expression of Il1b, Il6, Tnf, Ifng, Ccl2, Ccl3, Ccl5 in the heart of each group. (I) Tumor volume measurements of the female B16F10 tumor-bearing mice of each group. (J) Tumor volume at day 19 of each group (left) and tumor weight at day 20 of each group (right). n=8 per group. Data are presented as mean±SD. Data were analyzed by one-way ANOVA followed by Tukey post hoc multicomparison test. *p<0.05, **p<0.01, ***p<0.001, ****p<0.0001 compared with indicated group. RT-qPCR, reverse transcription quantitative polymerase chain reaction; TUNEL, TdT-mediated dUTP nick-end labeling.

Similar articles

Cited by

References

    1. Pardoll DM. The blockade of immune checkpoints in cancer immunotherapy. Nat Rev Cancer. 2012;12:252–64. doi: 10.1038/nrc3239. - DOI - PMC - PubMed
    1. D’Souza M, Nielsen D, Svane IM, et al. The risk of cardiac events in patients receiving immune checkpoint inhibitors: a nationwide Danish study. Eur Heart J. 2021;42:1621–31. doi: 10.1093/eurheartj/ehaa884. - DOI - PubMed
    1. Norwood TG, Westbrook BC, Johnson DB, et al. Smoldering myocarditis following immune checkpoint blockade. J Immunother Cancer. 2017;5:91. doi: 10.1186/s40425-017-0296-4. - DOI - PMC - PubMed
    1. Faron A, Isaak A, Mesropyan N, et al. Cardiac MRI Depicts Immune Checkpoint Inhibitor-induced Myocarditis: A Prospective Study. Radiology. 2021;301:602–9. doi: 10.1148/radiol.2021210814. - DOI - PubMed
    1. Zhu H, Galdos FX, Lee D, et al. Identification of Pathogenic Immune Cell Subsets Associated With Checkpoint Inhibitor-Induced Myocarditis. Circulation . 2022;146:316–35. doi: 10.1161/CIRCULATIONAHA.121.056730. - DOI - PMC - PubMed

MeSH terms

Substances