. 2025 Jan 7;44(1):8.
doi: 10.1186/s13046-024-03264-9.

hnRNPU-mediated pathogenic alternative splicing drives gastric cancer progression

Affiliations

hnRNPU-mediated pathogenic alternative splicing drives gastric cancer progression

Guoguo Jin et al. J Exp Clin Cancer Res. .

Abstract

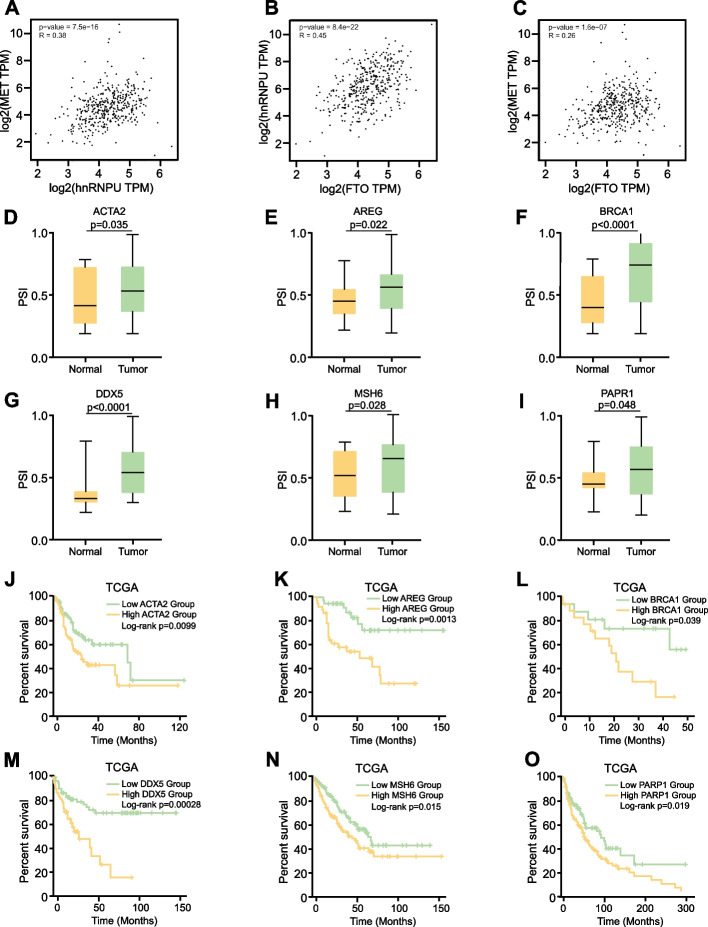
Background: Alternative splicing (AS) is a process that facilitates the differential inclusion of exonic sequences from precursor messenger RNAs, significantly enhancing the diversity of the transcriptome and proteome. In cancer, pathogenic AS events are closely related to cancer progression. This study aims to investigate the role and regulatory mechanisms of AS in gastric cancer (GC).

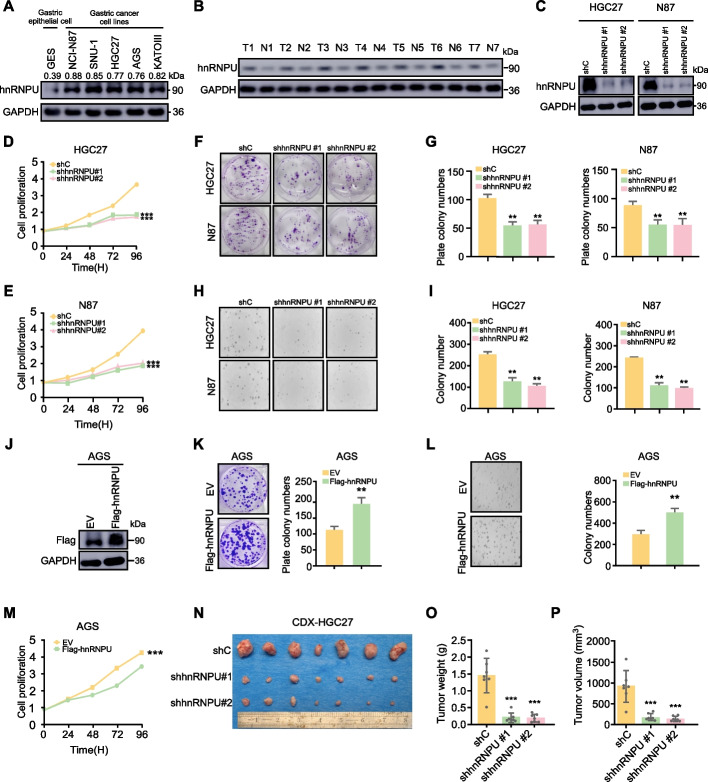
Methods: We analyzed AS events in various tumor samples and identified hnRNPU as a key splicing factor in GC. The effects of hnRNPU on cancer progression were assessed through in vitro and in vivo experiments. Gene knockout models and the FTO inhibitor (meclofenamic acid) were used to validate the interaction between hnRNPU and FTO and their impact on AS.

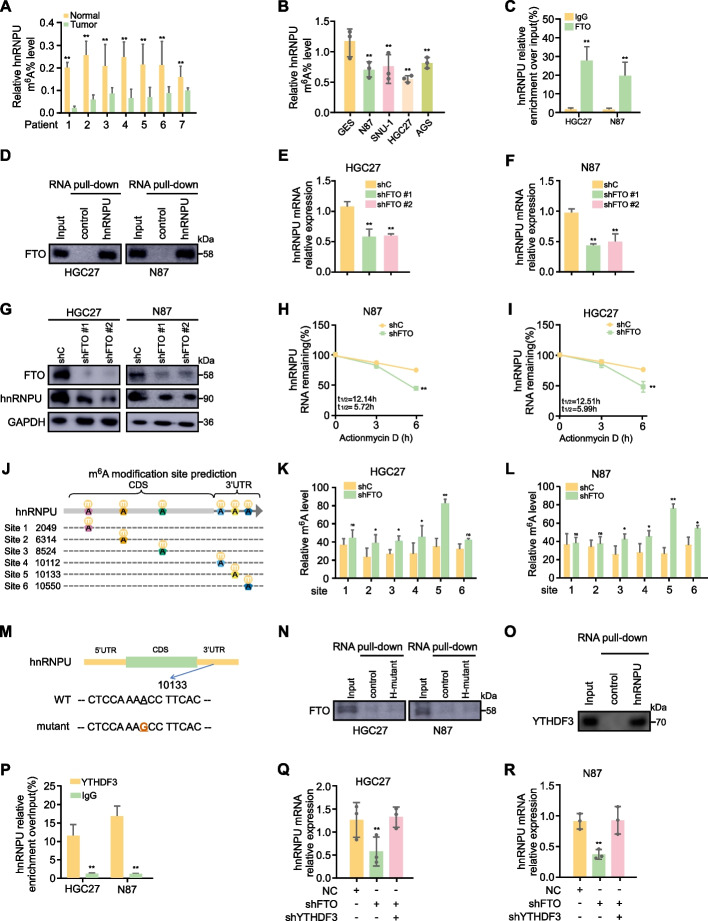
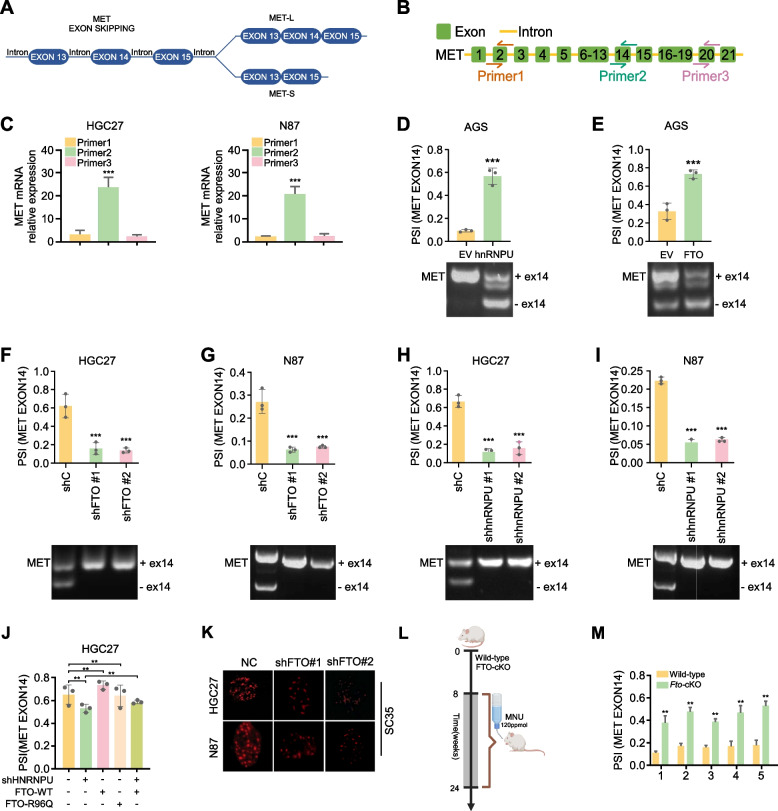
Results: We found that hnRNPU serves as a key splicing factor in GC, and its high expression is associated with poor clinical prognosis. Genetic depletion of hnRNPU significantly reduced GC progression. Mechanistically, the m6A demethylase FTO interacts with hnRNPU transcripts, decreasing the m6A modification levels of hnRNPU, which leads to exon 14 skipping of the MET gene, thereby promoting GC progression. The FTO inhibitor meclofenamic acid effectively inhibited GC cell growth both in vitro and in vivo.

Conclusion: The FTO/hnRNPU axis induces aberrant exon skipping of MET, thereby promoting GC cell growth. Targeting the FTO/hnRNPU axis may interfere with abnormal AS events and provide a potential diagnostic and therapeutic strategy for GC.

Keywords: Alternative splicing; FTO; Gastric cancer; hnRNPU.


Conflict of interest statement

Declarations. Ethics approval and consent to participate: This study was approved by the Ethics Committee of China-US (Henan) Hormel Cancer Institute (Zhengzhou, Henan, China). The ethical review approval number was CUHCI2019082. Consent for publication: All authors agree to publish this manuscript. Competing interests: The authors declare no conflict of interest.

Figures

Fig. 1
Fig. 1
Identification of hnRNPU as a crucial regulator of AS events in GC. A The data comes from TCGA database, and the alternative splicing events is calculated between normal and tumor group. Statistical analysis was performed using the unpaired Student's t-test. B The data set GSE27342 is downloaded from GEO database, and then calculated and visualized based on the correlation between data matrices. The colors indicate the "distance" between genes and module eigengenes in WGCNA, which is a measure of the correlation of gene expression patterns. The intensity of blue indicates a stronger correlation, while the intensity of red signifies a weaker correlation. C Correlation between different modules and clinical traits. The colors in the upper left corner indicate the correlation coefficients (the bluer the color, the higher the correlation; the redder, the lower the correlation) and the colors in the lower right corner indicate the p-values (the bluer the color, the smaller the p-value). D Hub genes were identified by intersecting the results from WGCNA with known splicing factors. From this intersection, we selected the three genes exhibiting the most significant differential expression. E Analysis of expression levels of hnRNPU, RBM23, and TNKS2 in samples from TCGA datasets, comprising 414 primary GC tissues and 211 normal tissues. Different colors represent distinct sample groups. Statistical analysis was performed using the unpaired Student's t-test. F The relationship between the expression of hnRNPU, RBM23 and TNKS2 and the prognosis of GC. The p value was calculated using the log-rank test. G Differential expression of hnRNPU in gastric, colorectal, pulmonary, and esophageal carcinomas compared to adjacent normal tissues. Statistical analysis was performed using the unpaired Student's t-test. H hnRNPU protein levels across progressive stages of various cancer types. I Kaplan–Meier analysis of overall survival curve for GC (GC) patients with low and high hnRNPU levels, as characterized by TCGA database. The p value was calculated using the log-rank test. J Quantitative real-time PCR showing hnRNPU expression levels in GC tissues and adjacent tissues from 8 GC patients. Data are presented as mean ± SD. The p-value was determined using a two-tailed Student's t-test. K Representative immunohistochemistry images and evaluation of hnRNPU expression in a tissue microarray containing 56 GC tumors and 39 adjacent tissues. The p-value was determined using a two-tailed paired Student's t-test. L-M Quantitative analysis confirmed significantly higher hnRNPU protein level in GC tissue compared to the adjacent tissues. Statistical analysis was performed using the unpaired (L) paired (M) Student's t-test. N Stratifying by clinicopathologic characteristics, hnRNPU expression was dramatically increased with higher lymph node involvement, larger tumor size, and more advanced stage. Statistical analysis was performed using One-Way ANOVA. *p < 0.05, **p < 0.01, and ***p < 0.001 indicate significant differences between the groups
Fig. 2
Fig. 2
hnRNPU promotes GC progression in vitro and in vivo. A-B WB to detect the hnRNPU protein level in GC cell lines (NCI-N87, SNU-1, HGC27, AGS, KATOIII) and normal gastric epithelial cell (GES) or 7 paired patient gastric tumor and adjacent normal tissues. The efficacy of two short hairpin RNAs (shRNAs), designated as #1 and #2, in knocking down hnRNPU expression was assessed by Western blot analysis in HGC27 and N87 GC cell lines. D-E MTT assay evaluating cellular proliferation of HGC27 and N87 cells following transduction with control (shC) or hnRNPU-targeted short hairpin RNA (shhnRNPU) vectors, maintained in RPMI-1640 medium supplemented with 10% heat-inactivated fetal bovine serum (FBS). Data represent the mean ± SD. Statistical significance was assessed via repeated measures two-way ANOVA. F-I Plate colony formation assay and anchorage-independent growth assays were used to assess the effect of knocking down hnRNPU on the proliferation ability of HGC27 and N87 cells, with representative images on the left and statistical graphs on the right. Data represent the mean ± SD. p value was calculated based on unpaired Student's t-test. J Western blot showed the overexpression of hnRNPU in AGS cells. K-M MTT assay showing the proliferation ability of AGS cells transfected with control (EV) vector or hnRNPU expression vector (hnRNPU) when cultured in 1640 medium supplemented with 10% FBS. Data are presented as mean ± SD. The p-value was determined using a unpaired Student's t-test. N To evaluate the effects of hnRNPU depletion on tumorigenicity, HGC27 GC cells with stable knockdown of hnRNPU expression via short hairpin RNAs (shRNAs) or non-targeting control shRNA were subcutaneously injected into athymic nude mice (n = 7 per group). Tumor weight (O) and tumor volume (P) measurements are presented and quantified in the right panel. Statistical analysis was performed using the unpaired Student's t-test. *p < 0.05, **p < 0.01, and ***p < 0.001 indicate significant differences between the groups
Fig. 3
Fig. 3
Identification of FTO as an m6A eraser targeting hnRNPU. A-B MeRIP-qPCR assay showing hnRNPU m6A modification levels in GC and adjacent tissues collected from 7 patients with GC. Data represent the mean ± SD. p value was calculated based on unpaired Student's t-test. C RIP assays were performed to evaluate the interaction between FTO and hnRNPU transcripts. p value was calculated based on unpaired Student's t-test. D RNA pull-down experiments were conducted to validate the interaction between FTO and hnRNPU transcripts. EG qPCR and WB were employed to measure hnRNPU mRNA and protein levels following FTO knockdown in GC cell lines. p value was calculated based on unpaired Student's t-test. H-I Following FTO knockdown, the hnRNPU mRNA decay rate was analyzed using nonlinear regression analysis. p value was calculated based on repeated measures two-way ANOVA. J Potential m6A sites in hnRNPU transcripts. K-L MeRIP-qPCR assay showing hnRNPU m6A modification levels in HGC27 and N87 cells with control (shC) or hnRNPU knocdown vector (shhnRNPU) cultured in 1640 medium with 10% FBS. Data represent the mean ± SD. p value was calculated based on unpaired Student's t-test. M Schematic representation of the mutated m.6A modification site 5 in hnRNPU mRNA. N. RNA pull-down experiments to verify FTO interaction with hnRNPU transcripts following mutation of site 5. O-P RNA pull-down assay and RIP assays to evaluate the interaction between hnRNPU and YTHDF3. Q-R Quantitative real-time PCR showing hnRNPU expression levels in HGC27 and N87 cells with normal control (NC), FTO knockdown (shFTO) or YTHDF3 knockdown (shYTHDF3) cultured in 1640 medium with 10% FBS, Error bars denote mean ± SD. p value was calculated based on One-Way ANOVA. Significant differences between groups are indicated as *p < 0.05 and **p < 0.01
Fig. 4
Fig. 4
FTO overexpression correlates with poor prognosis. A FTO expression in normal gastric cell GES and GC cell lines NCI-N87, SNU-1, HGC27, AGS, and KATOIII. B Representative immunohistochemistry images and evaluation of FTO expression measured on a tissue microarray that contains 70 paired GC tumors andadjacent tissues. p value was calculated based on unpaired Student's t-test. C-E Quantitative analysis of FTO protein levels in GC tissue microarray based on IHC staining results. Statistical analysis was performed using the unpaired (D) paired (E) Student's t-test. F FTO expression in GC based on TCGA database analysis. P value was calculated based on unpaired Student's t-test. G FTO expression in patients with different clinical stages as determined by tissue microarray analysis. p value was calculated based on One-Way ANOVA. H Number of lymph node metastases (LNM) stratified by FTO expression levels. p value was calculated based on One-Way ANOVA. I FTO expression in relation to tumor size in tissue microarray analysis. p value was calculated based on One-Way ANOVA. J Kaplan–Meier analysis of survival curve of patients with GC with low (n = 290) and high (n = 103) hnRNPU levels characterized by TCGA database. p value was calculated based on log-rank test. K Schematic diagram illustrating the generation of stomach-specific conditional Fto-KO mice. L Schematic representation of the GC primary induction model. Representative macroscopic images of stomachs from WT and Fto-KO mice. Quantitative analysis of tumor area (N) and tumor volume (O) in WT and FTO-KO mice with or without MNU treatment. p value was calculated based on One-Way ANOVA. P Relative hnRNPU m.6A levels in WT and Fto-KO groups. Statistical analysis was performed using the unpaired Student's t-test. Significant differences between groups are indicated as *p < 0.05 and **p < 0.01
Fig. 5
Fig. 5
FTO promotes GC progression in m6A-dependent manner. A Establishment and validation of FTO knockdown and overexpression in cells, confirmed by Western blot analysis. EpiQuik M6A RNA Methylation Quantification Kit assay showing total m6A modification levels in HGC27 and N87 cells with control (shC) or FTO knocdown vector (shFTO) cultured in 1640 medium with 10% FBS. Data represent the mean ± SD. p value was calculated based on One-Way ANOVA. C-E MTT, Plate colony formation and anchorage-independent growth assays showing proliferation ability of HGC27 and N87 cells with control (shC) or FTO knocdown vector (shFTO) cultured in 1640 medium with 10% FBS. Data represent the mean ± SD. p value was calculated based on one-Way ANOVA (D, E) and two-Way ANOVA (C). F-I MTT, Plate colony formation and anchorage-independent growth assays showing proliferation ability of SUN cell with control (EV) vector or FTO expression vector (FTO) cultured in 1640 medium with 10% FBS. Data represent the mean ± SD. P value was calculated based on two-tailed Student’s t test. J EpiQuik M6A RNA Methylation Quantification Kit assay showing total m6A modification levels of HGC27 and N87 cells with with control (EV) vector or FTO expression vector (FTO) cultured in 1640 medium with 10% FBS. Data represent the mean ± SD. Statistical analysis was performed using the unpaired Student's t-test. K, L Subcutaneous injection of HGC27 and N87 cells stably expressing shNT, shFTO#1, or shFTO#2 into the right flank of nude mice (n = 7 per group). Analysis of tumor weight in CDX mouse model in right panel. p value was calculated based on One-Way ANOVA. M, N Impact of FTO demethylase mutant R96Q on hnRNPU m.6A levels in HGC27 and N87 cells. p value was calculated based on One-Way ANOVA. O MTT assay showing proliferation ability of HGC27 and N87 cells with control (EV) vector, FTO expression vector (FTO) and FTO-R96Q mutant expression vector (R96Q) cultured in 1640 medium with 10% FBS. Data represent the mean ± SD. p value was calculated based on unpaired Student's t-test. P, Q R, S Quantitative analysis of plate crystal violet staining and soft agar colony formation assays. Statistical analysis was performed using one-Way ANOVA (R, S) and two-Way ANOVA (O). Significant differences between groups are indicated as *p < 0.05 and **p < 0.01
Fig. 6
Fig. 6
hnRNPU controlled the exon skipping of MET in GC cells. A Schematic workflow of RNA-seq and RIP-seq. B Distribution of different types of alternative splicing (AS) events. C Violin plots of changes of the significant percent splicing inclusion (ΔPSI) in the hnRNPU knockdown cells. D Heatmap visualization of gene expression changes following hnRNPU knockdown in HGC27 cells. E Volcano plot of gene changes after knockdown of hnRNPU F. Gene Ontology analysis of biological processes affected in hnRNPU-knockdown HGC27 cells. G KEGG pathway analysis in hnRNPU-knockdown HGC27 cells. H Venn diagram showing four genes (MET, METTL14, CALU, HSDL2) identified at the intersection of hnRNPU-RIP, RNA-seq, and AS datasets. I,J RIP and RNA pull-down assays confirming the interaction between hnRNPU and MET mRNA. K Kaplan–Meier analysis of survival curve of patients with GC with low MET PSI values (n = 112) and high MET PSI values (n = 23) characterized by TCGA database. p value was calculated based on log-rank test. L Quantitative real-time PCR showing MET PSI values in GC tissues and adjacent tissues from 8 GC patients. Data are presented as mean ± SD. The p-value was determined using an unpaired Student's t-test. M Analysis of the expression levels of MET between samples of GC and normal that contain 415 primary GC and 34 normal patients in TCGA datasets. Different colors refer to different samples. Significant differences between groups are indicated as *p < 0.05 and **p < 0.01
Fig. 7
Fig. 7
hnRNPU enhances proliferation in GC cells by promoting the skipping of exon 14 in the MET proto-oncogene transcript. A Schematic representation of alternative splicing patterns in MET. B Design of specific primers labeled as primer 1 to primer 3. C RIP assays to detect the specific interaction sites between hnRNPU and MET. Statistical analysis was performed using one-Way ANOVA D, E. Quantitative real-time PCR assay showing PSI of MET exon 14 skipping in AGS cell with with control (EV) vector, hnRNPU expression vector (hnRNPU) or FTO expression vector (FTO) cultured in 1640 medium with 10% FBS. Data represent the mean ± SD. p value was calculated based on unpaired Student's t-test F-I. Quantitative real-time PCR assay showing PSI of MET exon 14 skipping in HGC27 and N87 cells with control (shC), hnRNPU knocdown vector (shhnRNPU) or FTO knockdown vector (shFTO) in 1640 medium with 10% FBS. Data represent the mean ± SD. p value was calculated based on one-Way ANOVA. J Comparison of PSI values in hnRNPU knockdown cells, FTO wild-type (WT) cells, and FTO mutant cells. p value was calculated based on one-Way ANOVA. K Nuclear speckle assay to assess splicing activity following FTO knockdown. L. The schematic of MUN induced Fto-KO mouse model. M Analysis of MET exon 14 skipping PSI in WT and Fto-KO tumor tissues. The p-value was determined using an unpaired Student's t-test. Significant differences between groups are indicated as *p < 0.05 and **p < 0.01
Fig. 8
Fig. 8
Identification of GC prognosis-related AS events. A-C Analysis of protein expression level correlations between hnRNPU and MET, FTO and hnRNPU, and FTO and MET using the Gene Expression Profiling Interactive Analysis (GEPIA) database. D-I Comparative analysis of PSI values for ACTA2, AREG, BRCA1, DDX5, MSH6, and PARP1 in tumor tissues versus adjacent normal tissues using TCGA database. J-O Evaluation of the relationship between PSI values of the aforementioned genes and clinical prognosis. p value was calculated based on log-rank test
Fig. 9
Fig. 9
Meclofenamic acid (MA), a selective inhibitor of FTO, attenuates GC progression in vitro and in vivo. A The chemical structure of MA. B MTT assay showing proliferation ability of HGC27 and N87 cells with 0 μm,10 μm, 20 μm, 30 μm, 40 μm, 50 μm MA cultured in 1640 medium with 10% FBS. Data represent the mean ± SD. p value was calculated based on two-Way ANOVA. C, D Plate colony formation assay showing proliferation ability of HGC27 and N87 cells with 0 μm,10 μm, 20 μm, 50 μm MA cultured in 1640 medium with 10% FBS. Data represent the mean ± SD. p value was calculated based on one-Way ANOVA E. Relative hnRNPU mRNA levels following MA treatment, measured by qPCR. The p-value was determined using an unpaired Student's t-test. F hnRNPU m.6A level was checked after treatment with MA. The p-value was determined using an unpaired Student's t-test. G RNA decay rates in response to MA treatment. p value was calculated based on two-Way ANOVA. H-J MA effect on GC using HGC27 CDX model, with representative images, tumor weight and tumor volume were quantification. K-M PDX model assessment of MA effect on GC, including representative images, and tumor weight analysis. p value was calculated based on two-Way ANOVA. N, O Effect of FTO inhibitor on the PSI of MET exon 14 skipping. The p-value was determined using an unpaired Student's t-test. **P < 0.01, ***P < 0.001

Similar articles

Cited by

References

    1. Ajani JA, Lee J, Sano T, Janjigian YY, Fan D, Song S. Gastric adenocarcinoma. Nat Rev Dis Primers. 2017;3:17036. - PubMed
    1. Bray F, Laversanne M, Sung H, Ferlay J, Siegel RL, Soerjomataram I, et al. Global cancer statistics 2022: GLOBOCAN estimates of incidence and mortality worldwide for 36 cancers in 185 countries. CA Cancer J Clin. 2024;74(3):229–63. - PubMed
    1. Rawla P, Barsouk A. Epidemiology of GC: global trends, risk factors and prevention. Prz Gastroenterol. 2019;14(1):26–38. - PMC - PubMed
    1. Dicken BJ, Bigam DL, Cass C, Mackey JR, Joy AA, Hamilton SM. Gastric adenocarcinoma: review and considerations for future directions. Ann Surg. 2005;241(1):27–39. - PMC - PubMed
    1. Bonnal SC, Lopez-Oreja I, Valcarcel J. Roles and mechanisms of alternative splicing in cancer - implications for care. Nat Rev Clin Oncol. 2020;17(8):457–74. - PubMed