. 2025 Jan 7;17(1):11.
doi: 10.1186/s13195-024-01660-z.

Neuronal CD59 isoforms IRIS-1 and IRIS-2 as regulators of neurotransmitter release with implications for Alzheimer's disease

Affiliations

Neuronal CD59 isoforms IRIS-1 and IRIS-2 as regulators of neurotransmitter release with implications for Alzheimer's disease

Ewelina Golec et al. Alzheimers Res Ther. .

Abstract

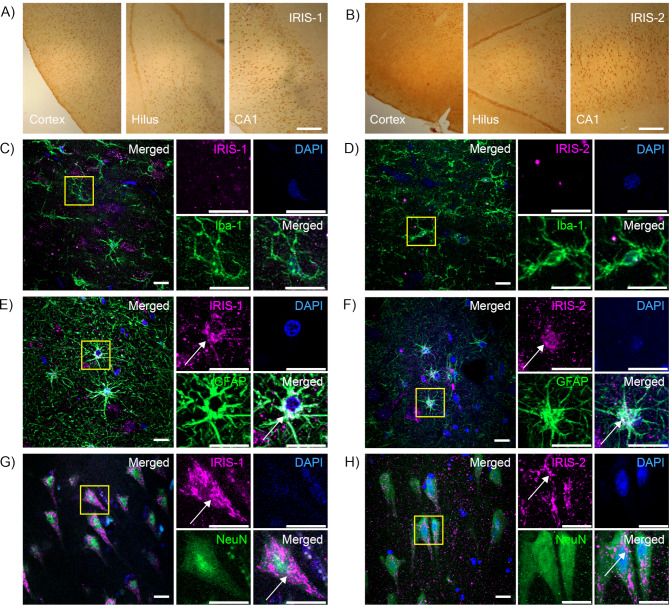
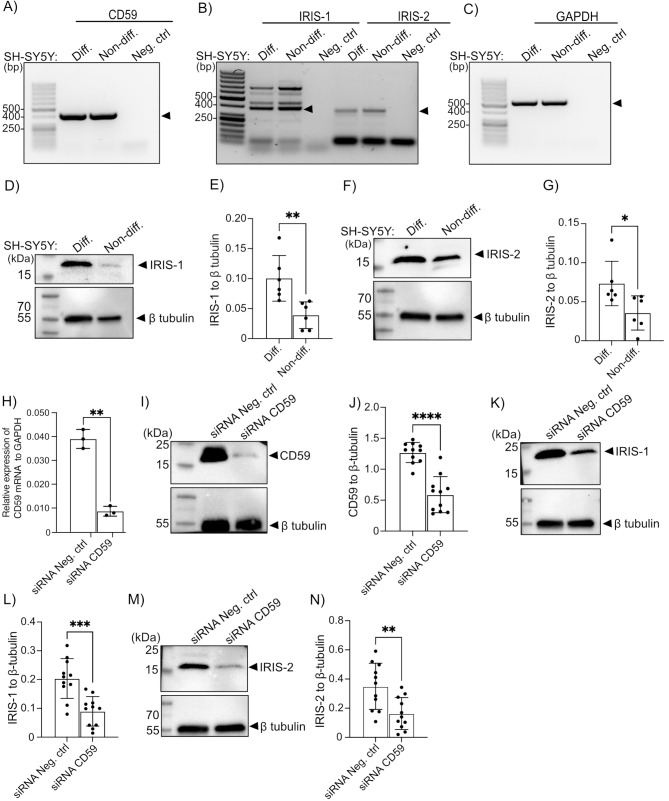
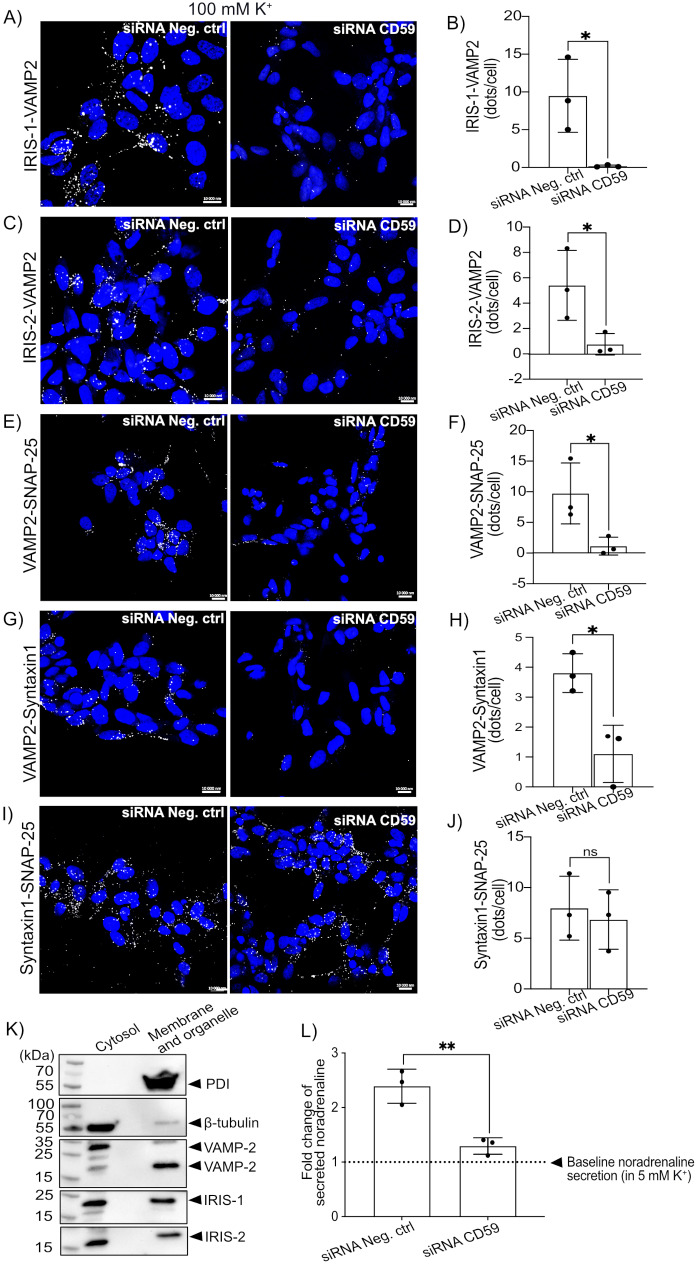
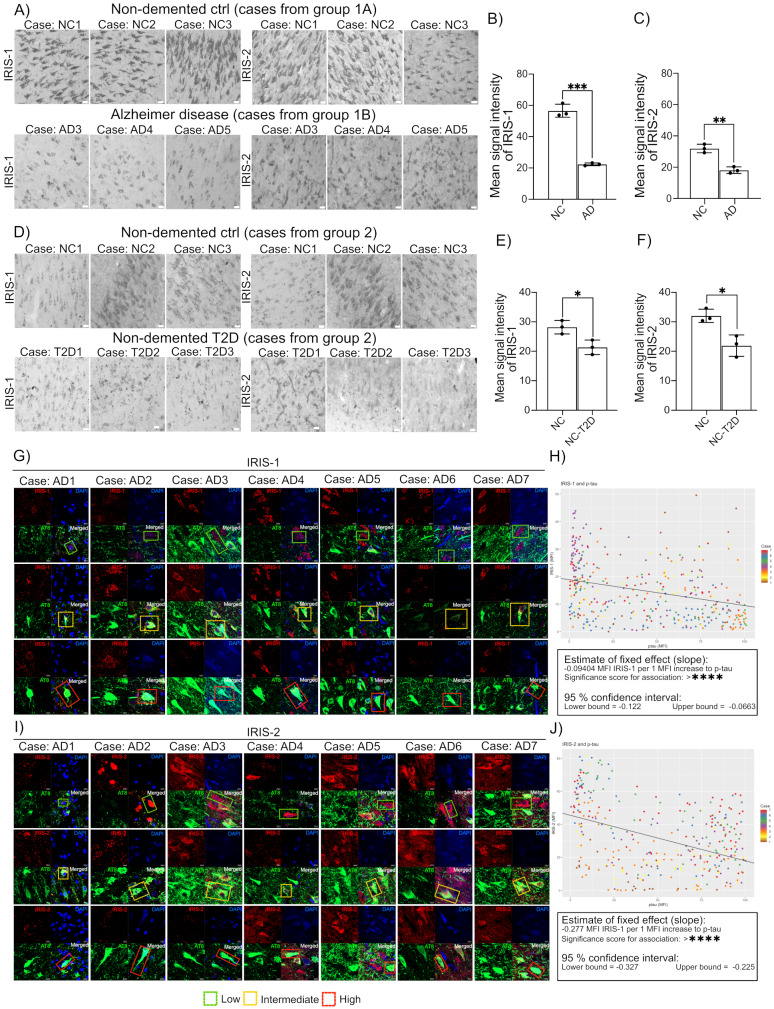
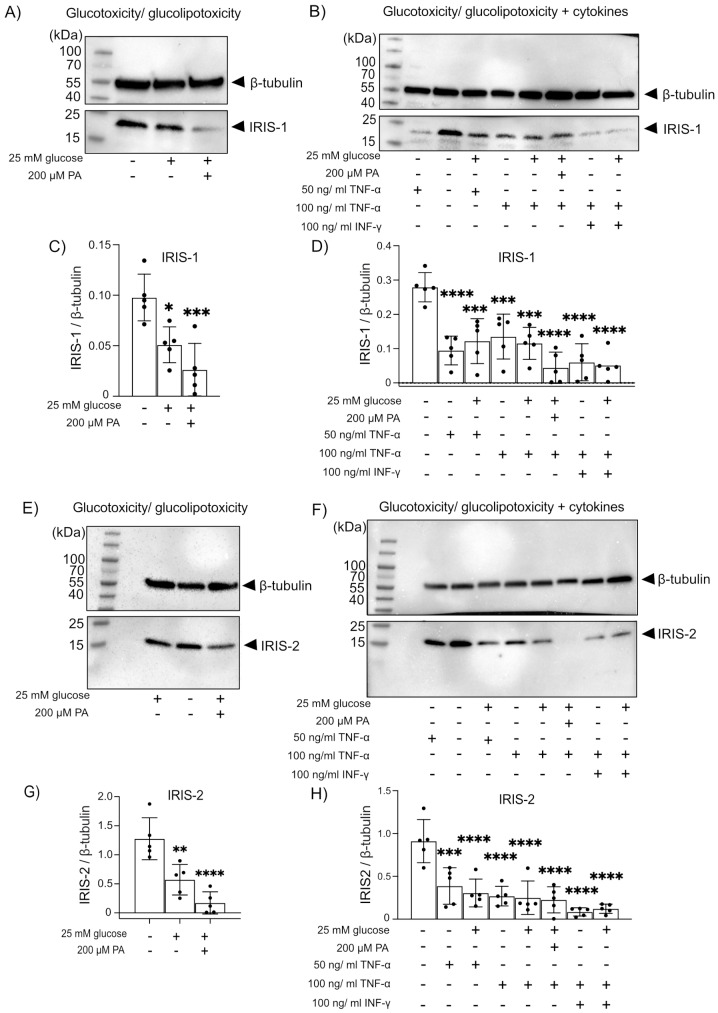
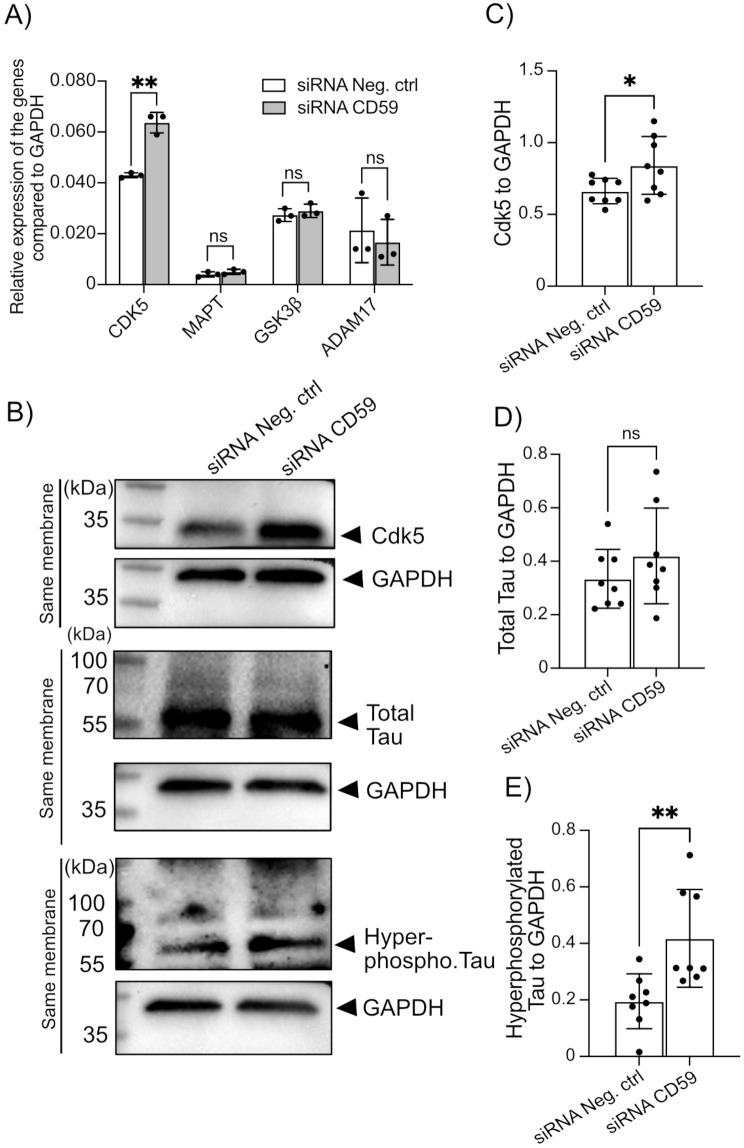
We have previously demonstrated that the intracellular, non-GPI anchored CD59 isoforms IRIS-1 and IRIS-2 (Isoforms Rescuing Insulin Secretion 1 and 2) are necessary for insulin secretion from pancreatic β-cells. While investigating their expression across human tissues, we identified IRIS-1 and IRIS-2 mRNA in the human brain, though their protein expression and function remained unclear. This study shows the presence of both IRIS-1 and 2 proteins in the human brain, specifically in neurons and astrocytes. In the neuroblastoma cell line (SH-SY5Y), both isoforms are intracellular, and their expression increases upon differentiation into mature neurons. Silencing IRIS-1 and 2 in SH-SY5Y cells reduces the SNARE complex formation, essential for synaptic vesicle exocytosis, leading to a reduction in noradrenaline secretion. Notably, we observed diminished expression of neuronal IRIS-1 and 2 in patients with Alzheimer's disease (AD) and non-demented individuals with type 2 diabetes (T2D). In SH-SY5Y cells, knockdown of all isoforms of CD59 including IRIS-1 and 2 not only elevates phosphorylated tau but also increases cyclin-dependent kinase 5 (CDK5) expression, known promoter of hyperphosphorylation and accumulation of tau, a key pathological feature of AD. Additionally, we found that prolonged exposure to high glucose or cytokines markedly reduces the expression of IRIS-1 and 2 in SH-SY5Y cells, suggesting a link between AD pathology and metabolic stress through modulation of these isoforms.

Keywords: Alzheimer’s disease; CD59; IRIS-1; IRIS-2; Intracellular complement; Neurotransmitters release; SNARE; Tau hyperphosphorylation; Type 2 diabetes.


Conflict of interest statement

Declarations. Ethics approval and consent to participate: Informed consents for the use of brain tissue, plasma, and clinical data for research purposes were obtained from all subjects or their legal representatives in accordance with the International Declaration of Helsinki [15]. The tissue collection protocols were approved by the medical ethics committee of VU medical Centre in Amsterdam, the Netherlands and the Swedish Ethical Review Authority approved the study (Dnr 2016/155, 2017/717). Consent for publication: Not applicable. Competing interests: The authors declare no competing interests. Financial disclosures: The authors declare no financial disclosures.

Figures

Fig. 1
Fig. 1
Images of hippocampus and entorhinal cortex from non-demented controls immunohistochemically stained against IRIS-1 (A) and IRIS-2 (B) show specific immunoreactivity in both cortex and the hippocampal subregions hilus and Cornu Ammonis 1 (CA1) Scale Bar = 400 μm. Images in (C-H) show representative images of hippocampal sections immunostained against IRIS-1 or IRIS-2 together with the microglia marker Iba-1, the astrocytic marker GFAP and the neuronal marker NeuN. Image in (C and D) shows a staining against IRIS-1 and IRIS-2 (purple in C and D, respectively) together with Iba-1 (green) and the nuclei staining DAPI (blue). Zoomed-in images of microglias in the yellow squares are shown to the right in (C and D). The images revealed no or very little colocalization between IRIS-1 and IRIS-2 and Iba-1. Images in (E and F) demonstrate GFAP positive astrocytes (green) co-stained against IRIS-1 and IRIS-2 (purple) and DAPI (blue). Zoomed-in images of astrocytes in the yellow squares are found to the right. The staining showed a moderate degree of colocalization between GFAP and IRIS-1 or IRIS-2 in astrocytes (indicated with arrows). Colocalization was also observed between IRIS-1 and IRIS-2 and the neuronal marker NeuN (visible as white puncta). Images, and zoomed-in neurons within yellow squares in (G and H) show localization of IRIS-1 and IRIS-2 (purple) within NeuN positive neurons (green) (indicated with arrows). The thickness of the Z-stack varies between 19.8 and 39.6 μm. Scale Bar = 20 μm
Fig. 2
Fig. 2
(A) Expression of canonical CD59 and (B) its isoforms: IRIS-1, and IRIS-2 in human neuroblastoma cells line (SH-SY5Y) undifferentiated and differentiated into mature neurons with BDNF and retinoic acid analyzed by semi-quantitative RT-PCR (n = 3). The negative control is the reaction mix, without template (no cDNA). (C) GAPDH served as a control. (D) Western blot analysis of IRIS-1 protein level in undifferentiated vs. differentiated SH-SY5Y cells, showing increased expression post-differentiation (n = 6). β tubulin was used as a loading control. The quantification is shown in (E). (F) Similarly, IRIS-2 protein levels were higher in differentiated cells, as shown by Western blotting (n = 6). Quantification is shown in (G). (H) CD59 expression in SH-SY5Y cells was measured by QRT-PCR to verify the mRNA level of CD59 knockdown (n = 3). Non-targeting negative control siRNA (Ambion, #4390843) was used as a negative control. GAPDH was used as a reference gene. (I) Western blot for CD59 protein to confirm knockdown efficiency for repeats from both the noradrenaline secretion assay- and p-tau/Cdk5 expression experiments, with β-tubulin as a loading control (n = 11). Quantification shown in (J). (K, M) Western blotting assessed IRIS-1 and IRIS-2 protein levels post-knockdown, respectively (n = 11, each). Quantifications are shown in (L and N). Statistics (in E, G, H, J, L, and N): two-tailed student T-test. Error bars indicate SD
Fig. 3
Fig. 3
Proximity ligation assay was used to assess interactions (represented by white dots) between IRIS-1 with VAMP2 (A with quantification in B) and IRIS-2 with VAMP2 (C with quantification in D) under high potassium stimulation. Proximity ligation assay was used to assess the SNARE complex formation under high potassium stimulation in SH-SY5Y cells treated with siRNA negative control and siRNA targeting CD59, IRIS-1, and 2. The following complexes were assessed: VAMP2 and SNAP-25 (E with quantification in F), VAMP2 and Syntaxin1 (G with quantification in H), Syntaxin 1 and SNAP-25 (I with quantification in J). n = 3, biological repeats in (A-J). (K) Subcellular fractionation of SH-SY5Y cells analyzed through western blot showing that IRIS-1 and 2 localizes within the same cellular compartments as VAMP2. The purity of fractions were assessed with specific antibodies form disulfide isomerase (PDI), specific for membranes, and β-tubulin, enriched in cytosolic fraction. n = 3. (L) Noradrenaline secretion from SH-SY5Y cells with or without CD59, IRIS-1, and 2 knockdown. Data are represented as a fold change of secreted noradrenaline in cells stimulated with 100 mM potassium (evoked noradrenaline release) compared to cells stimulated with 5 mM potassium (baseline noradrenaline secretion, represented as a dotted line). The amount of secreted noradrenaline in 5 mM and 100 mM potassium was normalized to total protein content, representing the number of cells. Statistics (in B, D, F, H, J, and L): two-tailed student T-test. The thickness of the Z-stack varies between 19.8 and 39.6 μm
Fig. 4
Fig. 4
Images in (A) show representative images of human hippocampal sections from three AD cases and three NC (Group 1 A, 1B) immunohistochemically stained against IRIS-1 and IRIS-2. The graphs in (B, C) demonstrate significantly lowered IRIS-1 of IRIS-2 immunoreactivity in the CA1 region of AD compared to NC (each dot represents the mean value of 6 images with 10–12 neurons used for quantification from every image. Each group consists of n = 3 cases). In (D) representative images of the CA1 region in three T2D cases and three NC are shown (Group 2). The graph in (E, F) shows the significantly lowered IRIS-1 of IRIS-2 immunoreactivity in T2D cases compared to NC (each dot represents the mean value of 6 images with 10–12 neurons used for quantification from every image. Each group consists of n = 3 cases). Statistical analysis of changes between NC vs. AD and NC vs. T2D was performed using two-tailed student T-tests, with error bars indicating standard deviation (SD). Of note, the difference in immunoreactivity seen in (A and D) is due to the different postfixation methods used after autopsy, where tissue from cases in Group 1 A and B (A) were immersion fixed in PFA directly after autopsy, while tissue from cases in Group 2 (C) was first snap frozen, followed by immersion fixation in PFA. Scale bars = 50 μm. Images in (G, I) show representative immunofluorescence stainings against IRIS-1 and IRIS-2 (red), tau phosphorylated at Ser 202/ Thr205 (AT8) (green) and DAPI (blue) of sections from the AD cases included in Group B (n = 7 AD cases). IRIS-1 (G) and IRIS-2 (I) positive neurons in the CA1 regions was divided into low, intermediate or high AT8 immunoreactivity, where low represents healthy neurons (very low or no AT8 staining), and high represents neurons with high amount of AT8 immunoreactivity (each representative neuron is indicated with dotted rectangles, green for low, yellow for intermediate and red for high, n ≥ 30 neurons per case and n ≥ 10 neurons per AT8 immunoreactivity category was analyzed). The thickness of the Z-stack varies between 19.8 and 39.6 μm. Scale bars = 10 μm. Dotplots for all neurons analysed were included and color coded by case number, with the estimate of the fixed effect as the slope, shown in (H) for IRIS-1 and (J) for IRIS-2
Fig. 5
Fig. 5
(A) Western blots showing the impact of glucose and glucolipotoxicity treatment (induced by with glucose and palmitic acid for 48 h) on IRIS-1 protein expression, and (B) the effect of gluco-lipo-toxicity in combination with pro-inflammatory cytokines (TNF-α, IFN-ɣ) on IRIS-1 expression, in neuroblastoma cell line (SH-SY5Y) to induce conditions mimicking AD and T2D. Quantifications are shown in (C) and (D) respectively (n = 5). (E) Western blots showing the effect of glucose and glucolipotoxicity on IRIS-2 expression, and (F) effects of glucolipotoxicity and pro-inflammatory cytokine addition on IRIS-2 expression, with quantifications shown in (G) and (H), respectively (n = 5). Graphs represent the ratio of band intensity for IRIS-1 or 2 to β-tubulin. Statistical analyses for panels (C, D, G and H) were performed using one-way ANOVA. Error bars indicate standard deviation (SD). Each group was compared to the untreated group (first bar) to determine the statistical significance
Fig. 6
Fig. 6
(A) QRT-PCR analysis of mRNA levels for CDK5, MAPT, GSK3β, and ADAM17 in SH-SY5Y cells with and without CD59, IRIS-1, and IRIS-2 knockdown, using GAPDH as a reference gene (n = 3). (B) Western blotting assessments of separate representative repeats for Cdk5, total tau, and phosphorylated tau (AT8 antibody targeting phosphorylation at Ser 202, Thr 205) protein levels, respectively, in SH-SY5Y cells with and without CD59, IRIS-1, and IRIS-2 knockdown. Each representative membrane is grouped with its loading control (GAPDH) as indicated by the lines. Quantifications for each protein, based on eight biological repeats, are presented in (C, D and E), respectively. Statistical analyses for panel (A) were performed using two-way ANOVA and for panels (C, D and E) using two-tailed student T-test, with error bars indicating standard deviation (SD)

References

    1. Qiu C, Kivipelto M, von Strauss E. Epidemiology of Alzheimer’s disease: occurrence, determinants, and strategies toward intervention. Dialogues Clin Neurosci. 2009;11(2):111–28. - PMC - PubMed
    1. Abubakar MB, Sanusi KO, Ugusman A, Mohamed W, Kamal H, Ibrahim NH, et al. Alzheimer’s Disease: an update and insights into pathophysiology. Front Aging Neurosci. 2022;14:742408. - PMC - PubMed
    1. Shah A, Kishore U, Shastri A. Complement System in Alzheimer’s Disease. Int J Mol Sci. 2021;22(24). - PMC - PubMed
    1. Rollins SA, Zhao J, Ninomiya H, Sims PJ. Inhibition of homologous complement by CD59 is mediated by a species-selective recognition conferred through binding to C8 within C5b-8 or C9 within C5b-9. J Immunol. 1991;146(7):2345–51. - PubMed
    1. Yang LB, Li R, Meri S, Rogers J, Shen Y. Deficiency of complement defense protein CD59 may contribute to neurodegeneration in Alzheimer’s disease. J Neurosci. 2000;20(20):7505–9. - PMC - PubMed

LinkOut - more resources