. 2025 Jan 7;10(4):e186000.
doi: 10.1172/jci.insight.186000.

Metabolic fitness of NAC1-deficient Tregs in the tumor microenvironment fuels tumor growth

Affiliations

Metabolic fitness of NAC1-deficient Tregs in the tumor microenvironment fuels tumor growth

Anil Kumar et al. JCI Insight. .

Abstract

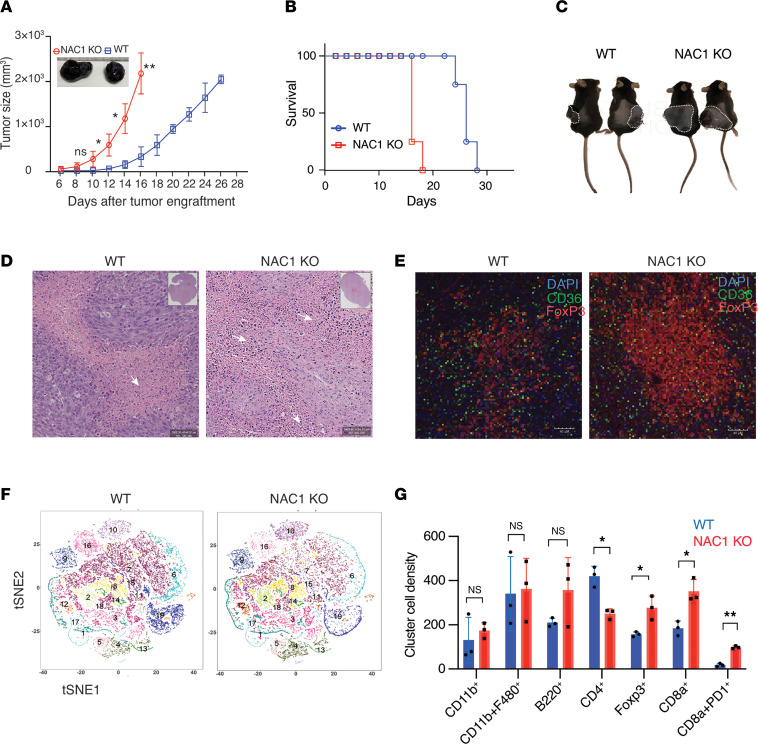
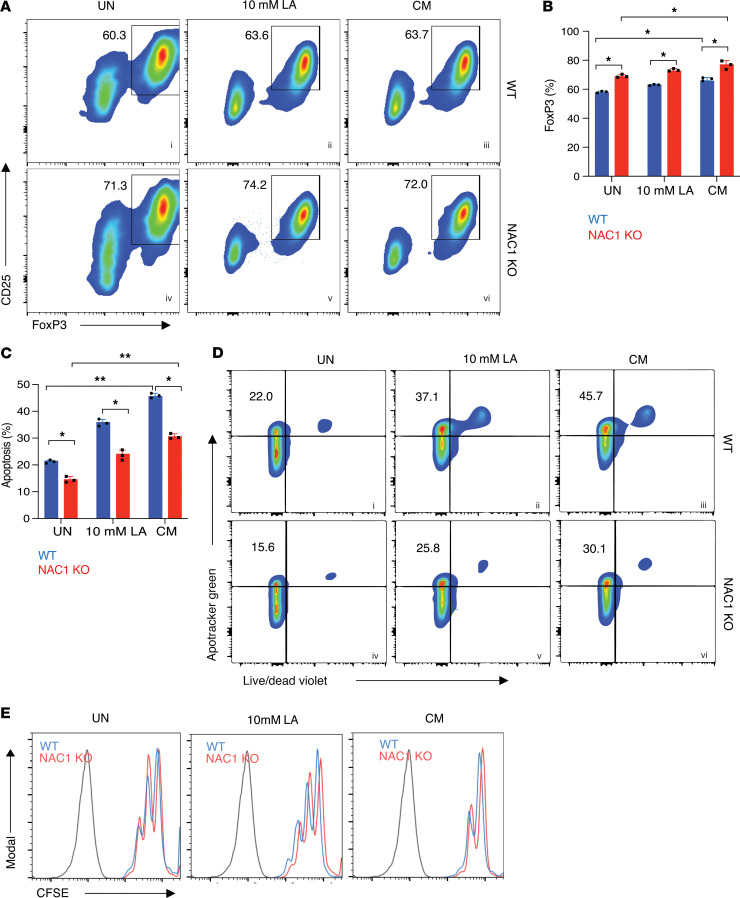
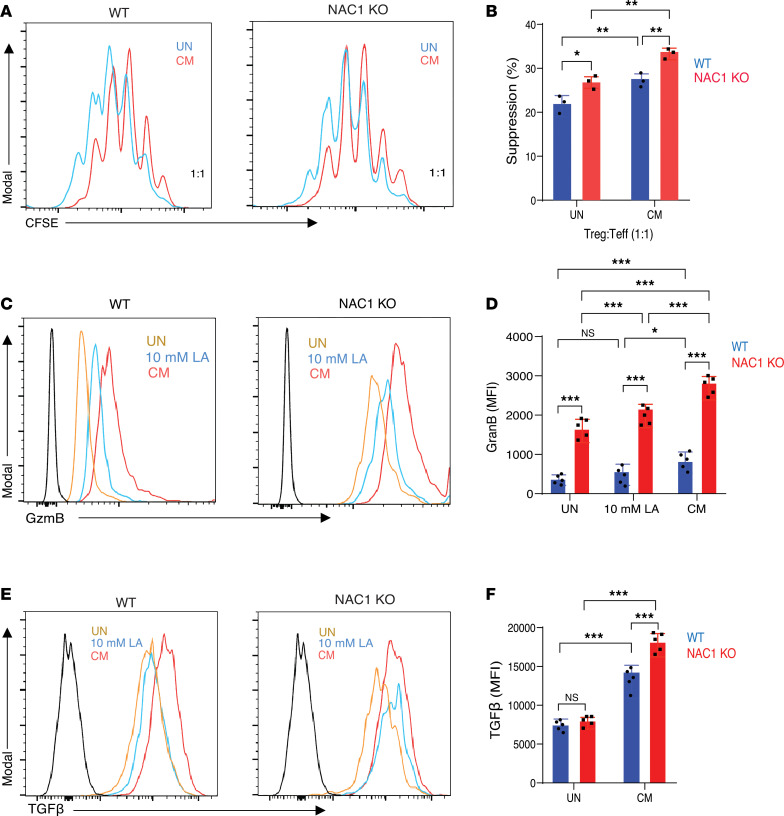
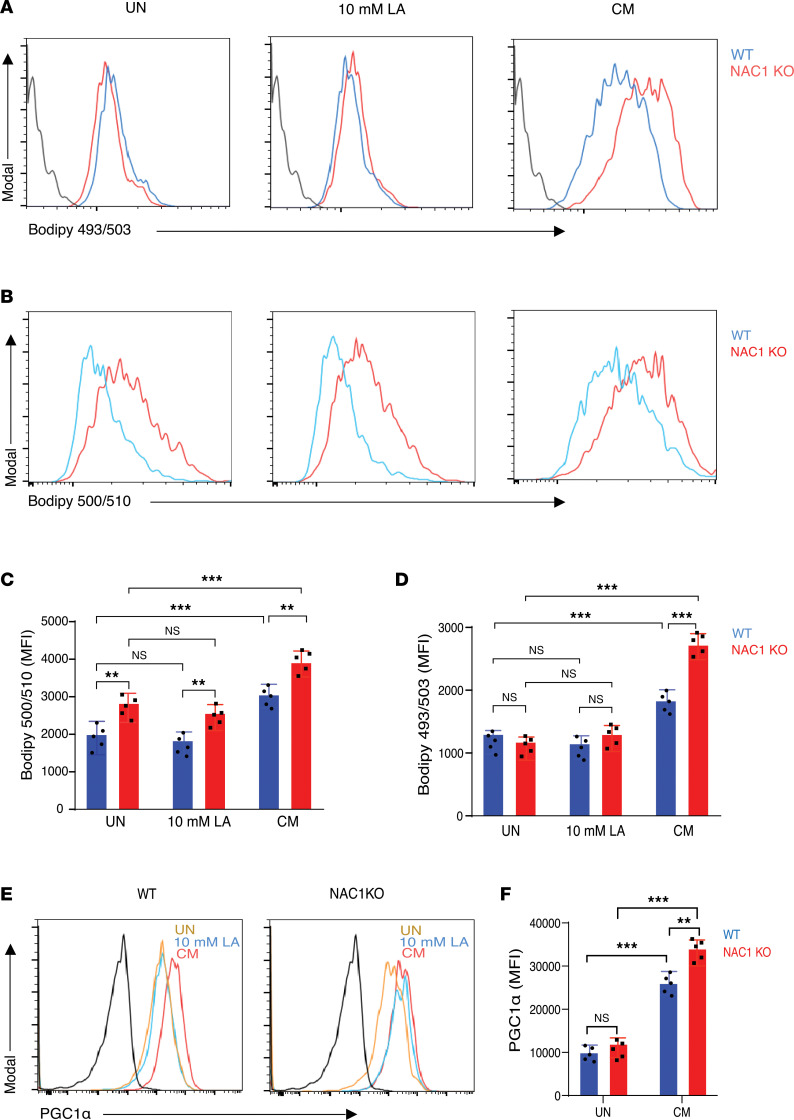
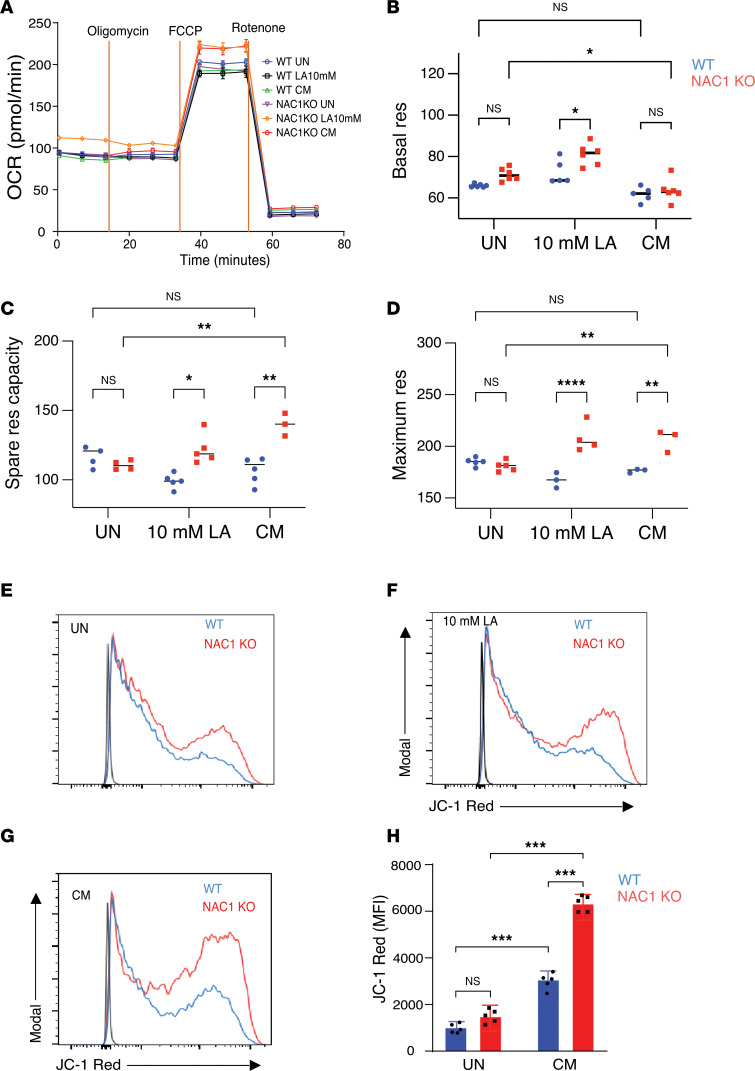
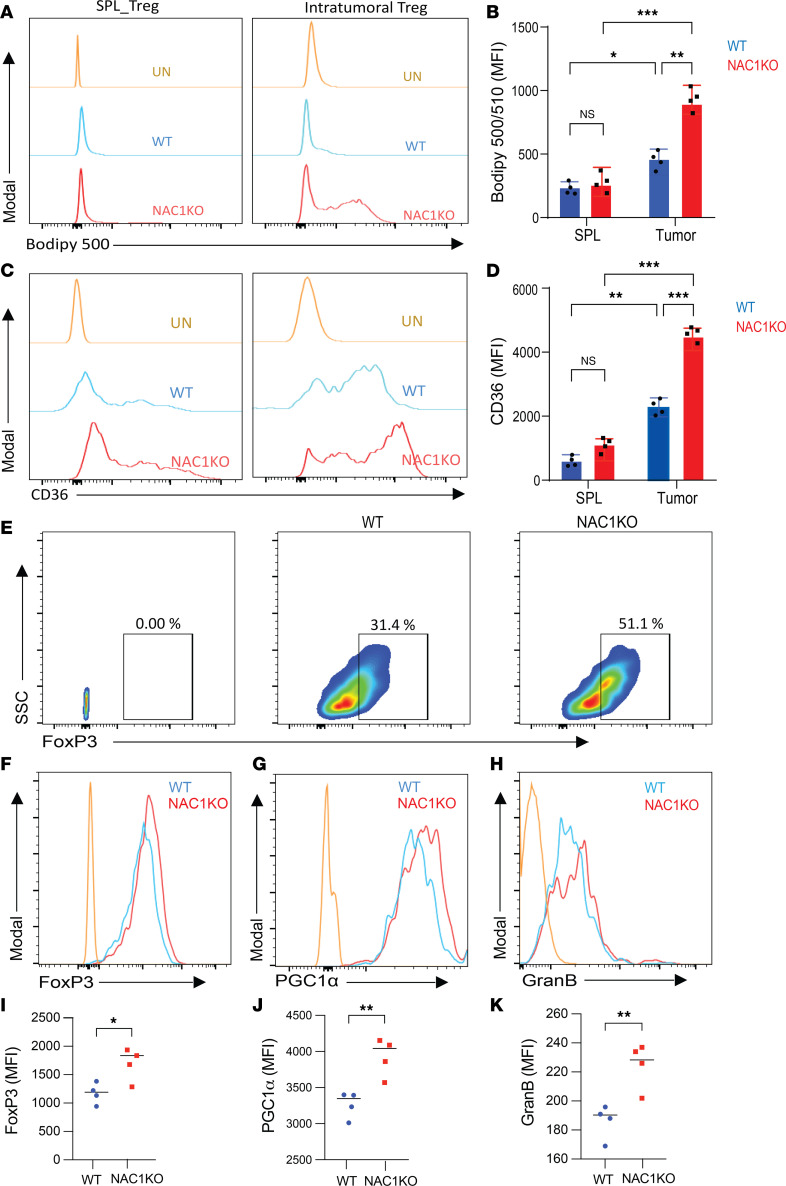
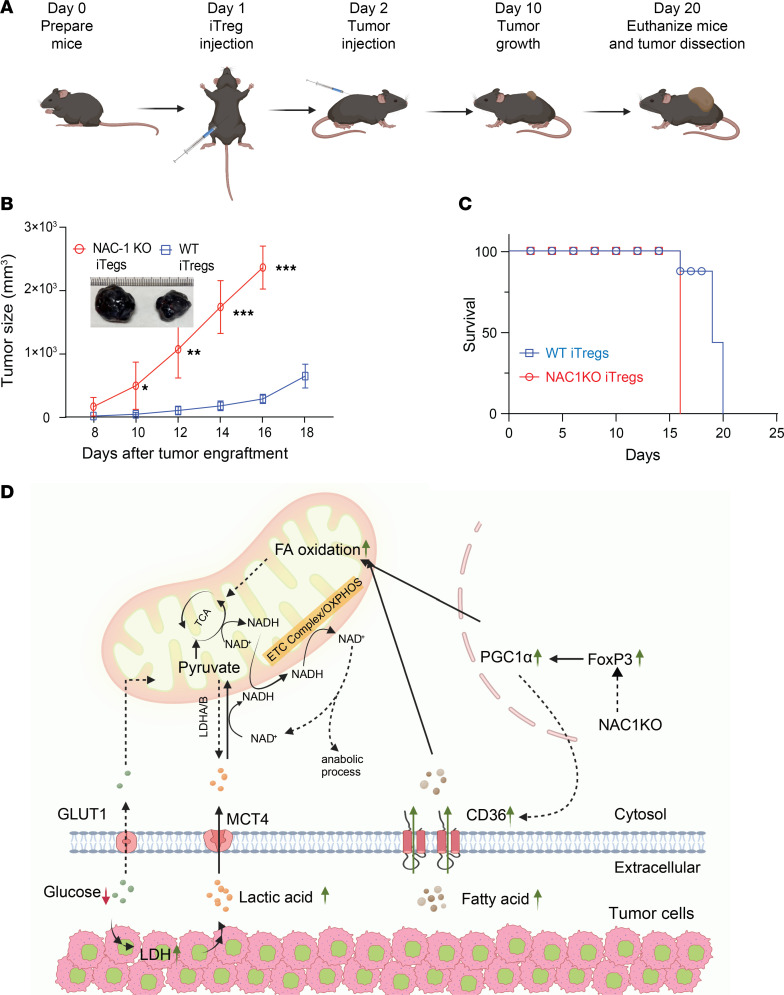
The nucleus accumbens-associated protein 1 (NAC1) has recently emerged as a pivotal factor in oncogenesis by promoting glycolysis. Deletion of NAC1 in regulatory T cells (Tregs) has been shown to enhance FoxP3 stability, a suppressor of glycolysis. This study delves into the intriguing dual role of NAC1, uncovering that Treg-specific deletion of NAC1 fosters metabolic fitness in Tregs, thereby promoting tumorigenesis. Our results unveil that NAC1-deficient Tregs exhibited prolonged survival and heightened function, particularly in acidic environments. Mechanistically, we find that NAC1-deficient Tregs adapted to adverse conditions by upregulating FoxP3 expression, engaging in CD36-mediated lipid metabolism, and enhancing peroxisome proliferator-activated receptor gamma coactivator 1-alpha-regulated mitochondrial function. In mouse tumor xenograft models, NAC1-deficient mice demonstrated increased susceptibility to tumor growth. Notably, Tregs lacking NAC1 not only displayed elevated lipid metabolism and mitochondrial fitness but also exhibited enhanced tumoral infiltration. Adoptive Treg transfer experiments further underscored the supportive role of NAC1-deficient Tregs in tumor growth. These findings suggest that modulating NAC1 expression in FoxP3+ Tregs could serve as a promising approach to augment antitumor immunity. Understanding the intricate interplay between NAC1 and Tregs opens avenues for potential therapeutic strategies targeting the tumor microenvironment.

Keywords: Cancer; Immunology.


Conflict of interest statement

Conflict of interest: PDF and JS have an affiliation with Tranquility Biodesign, LLC, as cofounders and scientific advisors. Tranquility Biodesign, LLC, holds intellectual property. JS and JMY are inventors on a pending patent (US Application No. PCT/US22/80367, titled “ METHODS AND COMPOSITIONS TARGETING NUCLEUS ACCUMBENS-ASSOCIATED PROTEIN-1 FOR TREATMENT OF AUTOIMMUNE DISORDERS AND CANCERS”) filed by Texas A&M University (TAMUS 5777, filed on November 22, 2022). JS is an inventor on a pending patent (US Application No. 63/291,462) related to this work filed by Texas A&M University (TAMUS 5869, filed on December 20, 2022).

Figures

Figure 1
Figure 1. NAC1 deficiency supports tumor growth in mice.
B16-F10 melanoma cells (3 × 10⁶ cells/mouse) were s.c. inoculated into WT and NAC1-KO mice, and the tumors were harvested for histology examination. (A) Tumor growth curves (n = 5). (B) Representative survival curve was plotted. (CE) Tumors were harvested and examined for the infiltration of lymphocytes by H&E staining (D) and FoxP3-expressing Tregs by IHC staining (E). Scale bars, 40 µm (D); 40 μm (E). (F) T-distributed stochastic neighbor embedding (t-SNE) plot showing quantification of infiltrating immune cell population in WT versus NAC1-KO generated by IMC analysis performed with the tumor tissue section. (G) Quantification of infiltrating immune cell population analyzed by IMC analysis. PD-1, programmed cell death 1. *: P ≤ 0.05, **: P ≤ 0.01, 2-way ANOVA.
Figure 2
Figure 2. NAC1-KO Tregs show prolonged survival and enhanced polarization in acidic environments.
(A) Representative flow cytometry shows FoxP3+CD25+ Treg frequency following LA and CM treatment. (B) Quantification of differential expression of FoxP3+ Treg frequency after the indicated treatment for 48 hours (n = 3). (C) Quantification of apoptosis in Tregs after the indicated treatment for 48 hours (n = 3). (D) Representative plots of Apotracker Green and Live/Dead expression on the WT and NAC1-KO Tregs treated with LA or CM for 48 hours (n = 3). (E) Proliferation of Tregs as determined by CFSE staining (n = 3). The data are represented as mean ± SEM. The differences were analyzed by 2-way ANOVA with multiple comparisons correction using GraphPad Prism. *: P ≤ 0.05, **: P ≤ 0.01.
Figure 3
Figure 3. NAC1-KO Tregs show enhanced functional activity of Tregs in acidic environments.
(A) CD8+ cells were labeled with CFSE and cocultured with WT or NAC1-KO Tregs (1:1) in the presence of anti-CD3 and -CD28 antibodies. Histogram of representative experiment showing the proliferation of CD8+ cells in the CM-treated culture. (B) Quantification analysis of the in vitro suppression assay (n = 3). (C) Representative histogram of the expression of GzmB in WT and NAC1-KO Tregs after 48-hour treatment with LA or CM (n = 5). (D) Quantification of differential expression of GzmB in WT versus NAC1-KO Tregs after the indicated treatment for 48 hours (n = 5). (E) Representative histogram of TGF-β expression in WT Tregs and NAC1-KO Tregs after 48-hour treatment with LA or CM (n = 5). (F) Quantification of differential expression of TGF-β in WT Tregs versus NAC1-KO Tregs after the indicated treatment for 48 hours (n = 5). The data are represented as mean ± SEM. *: P ≤ 0.05, **: P ≤ 0.01, ***: P ≤ 0.001, 2-way ANOVA with multiple comparisons correction using GraphPad Prism.
Figure 4
Figure 4. NAC1-KO Tregs have elevated lipid uptake and neutral lipid content in an acidic condition.
(A) Representative histogram of lipid content measured by BODIPY 493/503 staining in Tregs in the indicated culture conditions. (B) Representative histogram of fatty acid uptake measured by C1-BODIPY 500/510 C12 staining in Tregs in the indicated culture conditions. (C) Quantification of fatty acid uptake (C1-BODIPY 500/510 C12; n = 5). (D) Quantification of lipid content (BODIPY 493/503; n = 5). (E) Representative histogram of PGC-1α expression in WT and NAC1-KO Tregs in the indicated culture conditions. (F) Quantification of PGC-1α expression in WT and NAC1-KO Tregs in the indicated culture conditions. The data are represented as mean ± SEM. The differences were analyzed by 2-way ANOVA with multiple comparisons correction using GraphPad Prism software. **: P ≤ 0.01, ***: P ≤ 0.001.
Figure 5
Figure 5. NAC1-KO Tregs show enhanced mitochondrial respiration in an acidic environment.
(A) Effect of LA or CM treatment on mitochondrial respiration of WT and NAC1-KO Tregs, as measured by Seahorse XFe96 Metabolic Analyzer. Data are represented as mean ± SEM; n = 6 per condition from 2 independent experiments. (B) Basal respiration. (C) Spare respiratory capacity. (D) Maximum respiration quantified by Seahorse wave 3.0 software. (EH) The mitochondrial membrane potential of WT versus NAC1-KO Tregs measured by JC-1 staining (x axis of EG). (E) Untreated. (F) 10 mM LA. (G) CM. (H) Quantification of mitochondrial membrane potential (n = 5). Data are represented as mean ± SEM. The differences were analyzed by 2-way ANOVA with multiple comparisons correction using GraphPad Prism software. *: P ≤ 0.05, **: P ≤ 0.01, ***: P ≤ 0.001.
Figure 6
Figure 6. NAC1-KO Tregs are robust in the TME.
B16-F10 tumors from WT or NAC1-KO mice were harvested, dissociated, and the tumoral Tregs were stained and analyzed by flow cytometry. (A and B) Fatty acid uptake of intratumoral Tregs and splenic Tregs as measured by C1-BODIPY 500/510 C12. (A) Representative histogram; (B) quantification of fatty acid uptake. (C and D) CD36 expression in intratumoral Tregs and splenic Tregs. (C) Representative histogram; (D) quantification of CD36 expression (n = 3). (E) FoxP3+CD4+ Treg frequency in tumors isolated from WT or NAC1-KO mice. Representative histogram of expression of FoxP3 (F), PGC-1α (G), and GzmB (H) and their quantification: FoxP3 (I), PGC-1α (J), and GzmB (K) (n = 4). Data are represented as mean ± SEM. The differences were analyzed by 2-way ANOVA with multiple comparisons correction using GraphPad Prism software. *: P ≤ 0.05, **: P ≤ 0.01, ***: P ≤ 0.001.
Figure 7
Figure 7. NAC1-KO Tregs support tumor growth.
Three million Tregs were i.p. injected in each of the recipient Thy1.1 congenic mice, followed by tumor engraftment. (A) Schematic representation of adoptive Treg transfer and tumor engraftment. (B) Tumor growth curve of B16-F10 melanoma (n = 5). (C) Representative survival curve. (D) Illustration of the proposed and the rational pathway regulated by NAC1-FoxP3, leading to mitochondrial fitness in the TME. *: P ≤ 0.05, **: P ≤ 0.01, ***: P ≤ 0.001, unpaired t test.

Similar articles

References

    1. Rahman MT, et al. NAC1, a BTB/POZ protein overexpressed in uterine sarcomas. Anticancer Res. 2012;32(9):3841–3845. - PubMed
    1. Chen F, et al. NAC1 promotes the migration of prostate cancer cells and participates in osteoclastogenesis by negatively regulating IFNβ. Oncol Lett. 2018;15(3):2921–2928. - PMC - PubMed
    1. Wang X, et al. Identification of a small-molecule compound that inhibits homodimerization of oncogenic NAC1 protein and sensitizes cancer cells to anticancer agents. J Biol Chem. 2019;294(25):10006–10017. doi: 10.1074/jbc.RA119.007664. - DOI - PMC - PubMed
    1. Wang L, et al. NAC1 confines virus-specific memory formation of CD4+ T cells through the ROCK1-mediated pathway. J Med Virol. 2023;95(7):e28957. doi: 10.1002/jmv.28957. - DOI - PMC - PubMed
    1. Wang L, et al. Autophagy in T-cell differentiation, survival and memory. Immunol Cell Biol. 2021;99(4):351–360. doi: 10.1111/imcb.12422. - DOI - PubMed

MeSH terms

Substances