. 2025 Jan 8;16(1):473.
doi: 10.1038/s41467-024-55798-3.

Interconnected pathways link faecal microbiota plasma lipids and brain activity to childhood malnutrition related cognition

Affiliations

Interconnected pathways link faecal microbiota plasma lipids and brain activity to childhood malnutrition related cognition

T Portlock et al. Nat Commun. .

Abstract

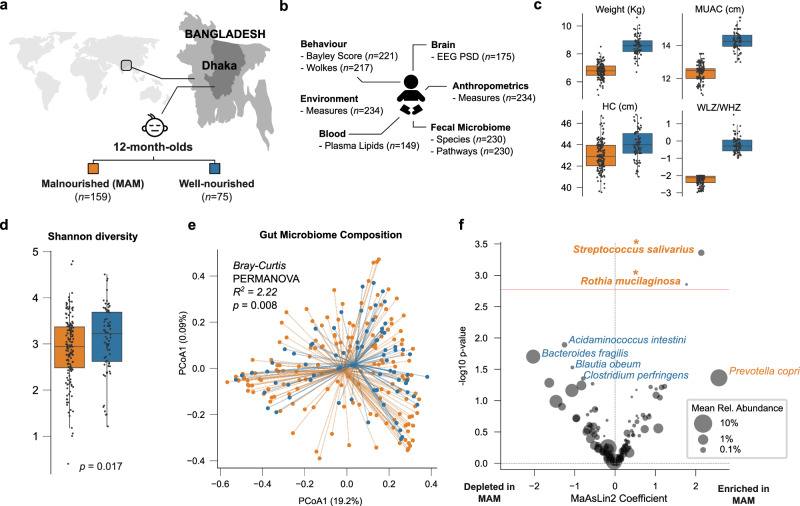
Malnutrition affects over 30 million children annually and has profound immediate and enduring repercussions. Survivors often suffer lasting neurocognitive consequences that impact academic performance and socioeconomic outcomes. Mechanistic understanding of the emergence of these consequences is poorly understood. Using multi-system SHAP interpreted random forest models and network analysis, we show that Moderate Acute Malnutrition (MAM) associates with enrichment of faecal Rothia mucilaginosa, Streptococcus salivarius and depletion of Bacteroides fragilis in a cohort of one-year-old children in Dhaka, Bangladesh. These microbiome changes form interconnected pathways that involve reduced plasma odd-chain fatty acid levels, decreased gamma and beta electroencephalogram power in temporal and frontal brain regions, and reduced vocalization. These findings support the hypothesis that prolonged colonization by oral commensal species delay gut microbiome and brain development. While causal links require empirical validation, this study provides insights to improve interventions targeting MAM-associated neurodevelopmental deficits.


Conflict of interest statement

Competing interests: The authors declare no competing interests.

Figures

Fig. 1
Fig. 1. MAM impacts the 12-month-old faecal microbiome.
a Schematic of study design. b Summary of data collected. Boxplots of significant differences (MMU, p < 0.05) in c anthropometric measurements between MAM (n = 156) and well-nourished controls (n = 74). d Boxplots of significant difference (MWU, p = 0.01) in alpha diversity between MAM (n = 159) and well-nourished controls (n = 75). Box plots show the median, the 25th–75th percentiles (IQR), and whiskers extending up to 1.5 × IQR. e PCoA Scatterplot of Bray–Curtis beta diversities of samples (each marker is a single child’s sample). f Volcano plot of differences in species relative abundance (CPM) that are associated with MAM (n = 159) versus well-nourished controls (n = 75) measured using MaAsLin2 (two-sided and corrected for multiple comparisons). Red horizontal line signifies a significance threshold of q = 0.25, with point size representing the mean relative abundance across all 12-month-old children and Streptococcus salivarius (q = 0.23) and Rothia mucilaginosa (q = 0.23) being the only statistically significant results as signified by an asterisk. All subplots are coloured orange and blue representing MAM and well-nourished 12-month-olds, respectively.
Fig. 2
Fig. 2. Differences in cognitive development of 12-month-old children associate with MAM.
a Heatmap of lobe and frequency-specific changes in EEG resting state power spectral density (PSD) in MAM (n = 120) versus well-nourished (n = 55) 12-month-olds. PSD was measured in µVolts-squared per Hz and log10-transformed for normalization. b Boxplots of distributions of significant EEG PSD changes as in subplot A. c Bayley score differences in MAM (n = 151) versus well-nourished controls (n = 70). d Wolke score differences in MAM (n = 152) versus well-nourished controls (n = 65). *q < 0.05. Box plots show the median, the 25th–75th percentiles (IQR), and whiskers extending up to 1.5 × IQR. All differences were measured using MaAsLin2 (two-sided and corrected for multiple comparisons as is the default). All subplots are coloured orange and blue representing MAM and well-nourished 12-month-olds, respectively.
Fig. 3
Fig. 3. MAM results in major, compositional differences in plasma lipids of 12-month-old children.
a Volcano plot of changes to plasma lipids between MAM (n = 76) and well-nourished (n = 73) 12-month-olds. (Upper left and upper right quadrants signify significant changes where the red horizontal line signifies q < 0.05 after mixed effect modelling adjusting for covariates. Vertical lines represent the mixed effect model coefficient of −0.1 and 0.1, respectively). b Box plot of changes in plasma odd-chain fatty acid (OCFA) and lysolipid relative abundance due to MAM. c Box plots of changes to lipid classes associated with MAM. *p < 0.05. Box plots show the median, the 25th–75th percentiles (IQR), and whiskers extending up to 1.5 × IQR. All differences were measured using MaAsLin2 (two-sided and corrected for multiple comparisons). All subplots are coloured orange and blue representing MAM and well-nourished 12-month-olds, respectively.
Fig. 4
Fig. 4. Integration of multimodal datasets influences the importance of features of random forest models predicting nutritional status.
a Mean AUCROC values of the predictive power of each modal dataset on predicting nutritional status (error bars are standard deviation). b Schematic describing interpreted multimodal approach to predict MAM. c AUCROC curve of multimodal model prediction of MAM. d Scatterplot to show the relationship between mixed effect model significance as −log(pval) and mean|SHAP|. e Pie chart of proportional contribution of each dataset to multimodal model prediction Σ(mean|SHAP|). f Circos plot of the contribution of interactions between dataset to MAM prediction. All subplots are coloured orange and blue representing MAM and well-nourished 12-month-olds, respectively.
Fig. 5
Fig. 5. Bacteroides fragilis forms a network with propanoate synthesis, EEG PSD, and expressive communication that is anti-correlated with a Rothia mucilaginosa, Streptococcus salivarius focused cluster of features in MAM and well-nourished children.
a Network illustrating inter-relationships of feature associations that predict MAM. Inclusion in the network requires a feature to be important in the prediction of MAM (mean|SHAP| of >0.0016, 90% quantile) and a significant Spearman correlation (q < 0.05). Nodes are features coloured by their enrichment (MaAsLin2) in MAM (orange and blue are enriched (MaAsLin2 coef > 0) and depleted (MaAsLin2 coef < 0 in MAM, respectively). Nodes are scaled proportionately to their mean|SHAP|. Edges are Spearman correlations coloured red, and blue being positively and negatively correlated respectively. b Mechanism of MAM pathogenesis. Scatterplots show a correlation between features, with points coloured orange and blue representing children that are MAM and well-nourished, respectively. The shaded areas represent the 95% confidence intervals for predictions from a linear model. Boxplots are differences in each feature between MAM and well-nourished children. Box plots show the median, the 25th–75th percentiles (IQR), and whiskers extending up to 1.5 × IQR. All subplots are coloured orange and blue representing MAM and well-nourished 12-month-olds, respectively.

References

    1. De Onis, M., et al. WHO Global Database on Child Growth and Malnutrition (WHO, 1997).
    1. Martorell, R. & Ho, T. J. Malnutrition, morbidity, and mortality. Popul. Dev. Rev.10, 49–68 (1984).
    1. Nyaradi, A., Li, J., Hickling, S., Foster, J. & Oddy, W. H. The role of nutrition in children’s neurocognitive development, from pregnancy through childhood. Front. Hum. Neurosci.7, 97 (2013). - PMC - PubMed
    1. Jamison, D. T. Child malnutrition and school performance in China. J. Dev. Econ.20, 299–309 (1986).
    1. Gunston, G. D., Burkimsher, D., Malan, H. & Sive, A. A. Reversible cerebral shrinkage in kwashiorkor: an MRI study. Arch. Dis. Child.67, 1030–1032 (1992). - PMC - PubMed

LinkOut - more resources