. 2025 Jan 7;16(1):446.
doi: 10.1038/s41467-025-55873-3.

High frequency CCR5 editing in human hematopoietic stem progenitor cells protects xenograft mice from HIV infection

Affiliations

High frequency CCR5 editing in human hematopoietic stem progenitor cells protects xenograft mice from HIV infection

Daniel T Claiborne et al. Nat Commun. .

Abstract

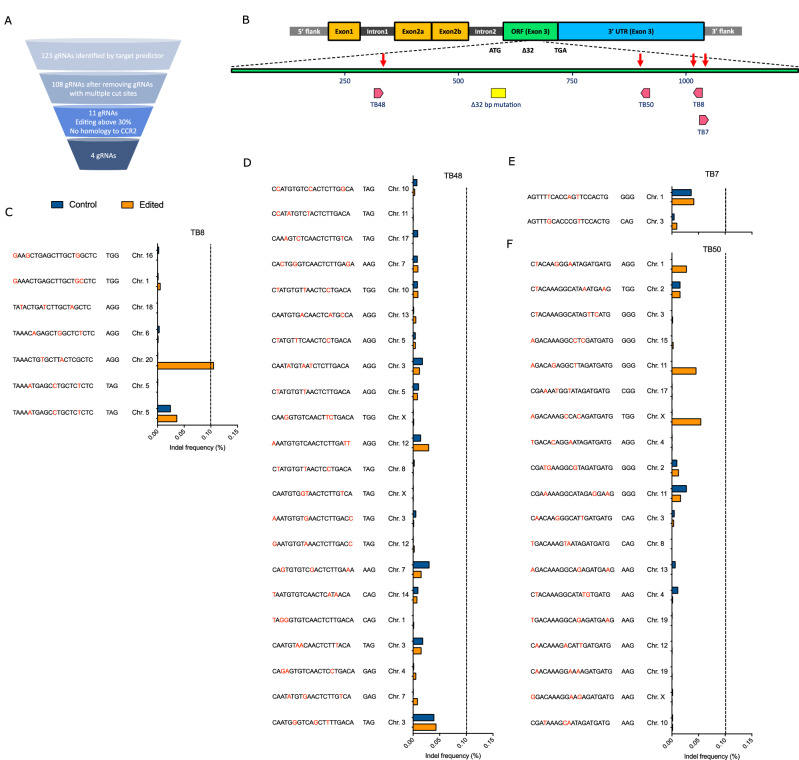
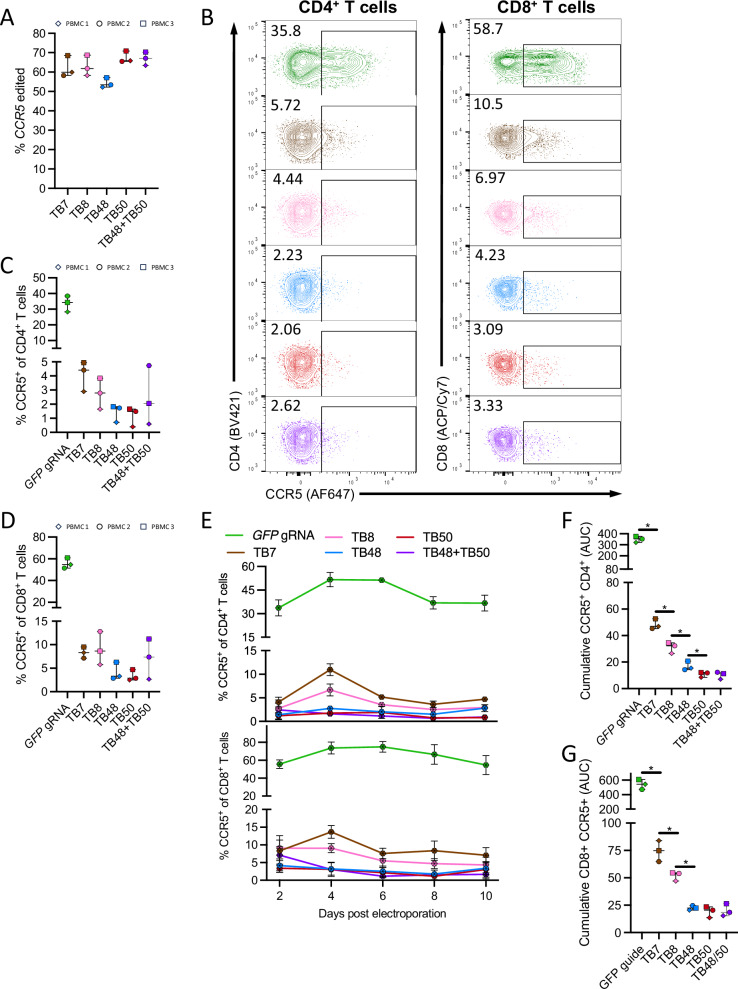
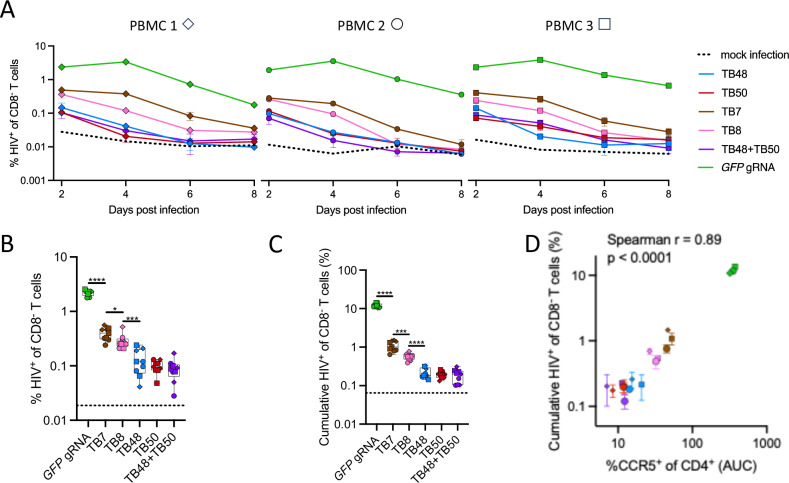
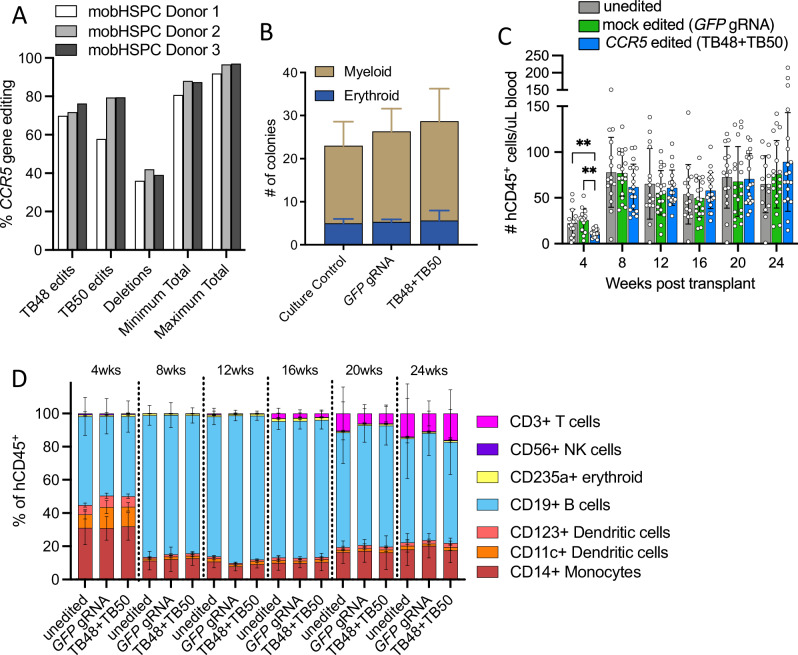
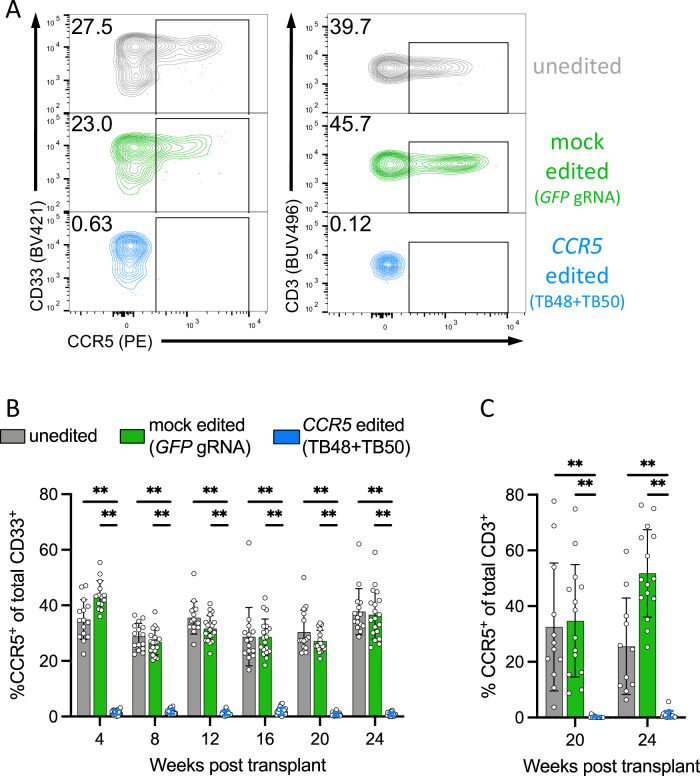
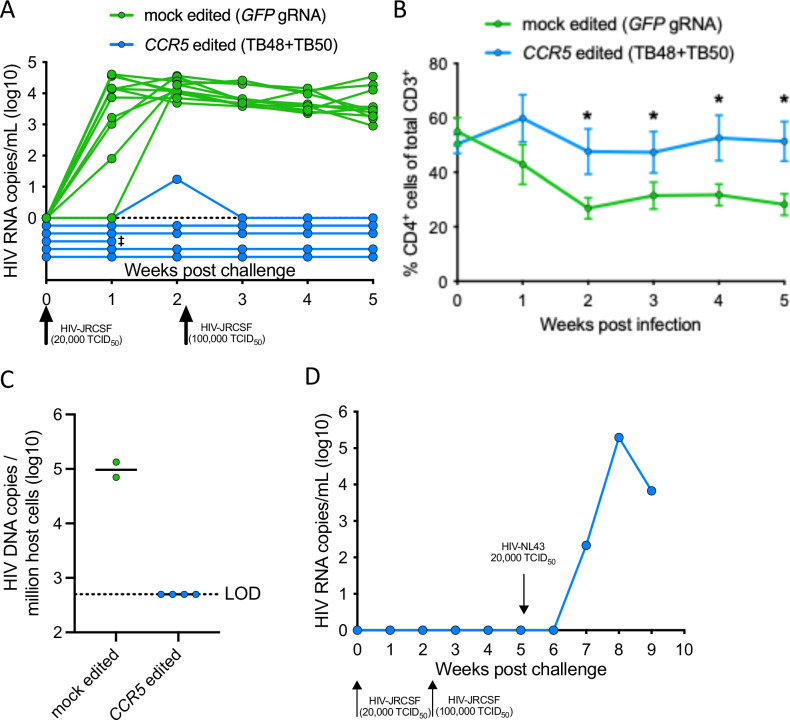
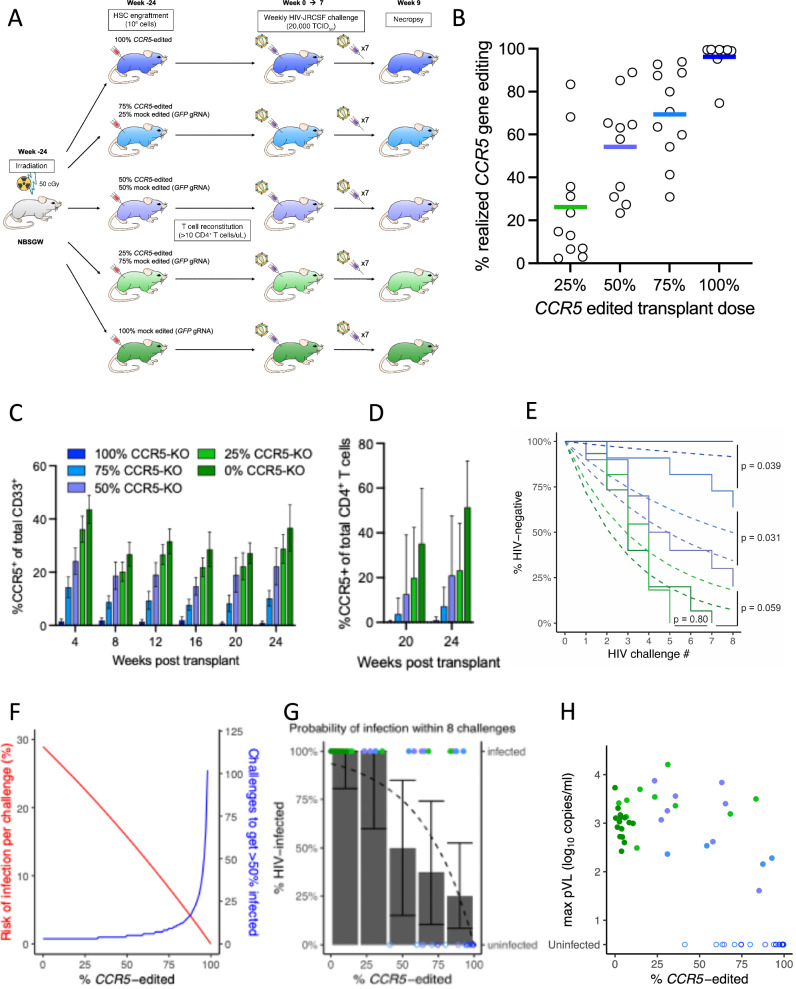
The only cure of HIV has been achieved in a small number of people who received a hematopoietic stem cell transplant (HSCT) comprising allogeneic cells carrying a rare, naturally occurring, homozygous deletion in the CCR5 gene. The rarity of the mutation and the significant morbidity and mortality of such allogeneic transplants precludes widespread adoption of this HIV cure. Here, we show the application of CRISPR/Cas9 to achieve >90% CCR5 editing in human, mobilized hematopoietic stem progenitor cells (HSPC), resulting in a transplant that undergoes normal hematopoiesis, produces CCR5 null T cells, and renders xenograft mice refractory to HIV infection. Titration studies transplanting decreasing frequencies of CCR5 edited HSPCs demonstrate that <90% CCR5 editing confers decreasing protective benefit that becomes negligible between 54% and 26%. Our study demonstrates the feasibility of using CRISPR/Cas9/RNP to produce an HSPC transplant with high frequency CCR5 editing that is refractory to HIV replication. These results raise the potential of using CRISPR/Cas9 to produce a curative autologous HSCT and bring us closer to the development of a cure for HIV infection.


Conflict of interest statement

Competing interests: ZD is a current employee, holds stock and stock options in CRISPR Therapeutics AG. TB and TH are former employees and shareholders of CRISPR Therapeutics AG. The other authors declare no competing interests.

Figures

Fig. 1
Fig. 1. Screening, location, and off-target analysis of optimal CCR5-targeting gRNAs.
A Diagram of the screening process used to identify optimal gRNAs from the initial pool of 123 gRNAs predicted to induce double-stranded breaks in CCR5 exon 3. B Genome organization of the CCR5 locus, and the relative positions of each of the 4 optimal gRNAs within the CCR5 exon 3 open reading frame and in relation to the naturally occurring Δ32 deletion. CF CD34+ HSPCs were edited with each lead gRNA using a concentration of 150 µg/mL or mock edited. Predicted off-target sites were amplified, sequenced, and analyzed for indel formation. The blue bars represent indel frequency at the off-target sites for gRNAs (C) TB8, (D) TB48, (E) TB7, and (F) TB50 in mock edited CD34+ HSPCs. The orange bars represent indel frequency at off-target sites in CD34+ HSPCs edited with the respective gRNA and Cas9 protein. An indel frequency level of ≥0.10%, represented by the dashed line, was considered the threshold for off-target editing.
Fig. 2
Fig. 2. Robust and durable ablation of CCR5 surface expression in primary human T cells.
AF Human PBMCs from 3 donors were stimulated with phytohemagglutinin (PHA) for 3 days, electroporated with either a “mock” non-specific gRNA targeting GFP (green), single gRNAs targeting CCR5 (TB7-pink, TB8-brown, TB48-blue, TB50-red), or a dual gRNA approach comprising TB48 + TB50 (purple). Each symbol represents a distinct donor. A 48-h post electroporation, gene editing was measured by Sanger sequencing of CCR5 amplified from genomic DNA. B FACS plots depict CCR5 surface expression on mock edited (GFP gRNA) or CCR5 edited CD4+ (left) and CD8+ (right) T cells in a representative donor 48-h post electroporation. CCR5 expression levels 48-h after electroporation with various gRNAs on (C) CD4+ and (D) CD8+ T cells. E Longitudinal expression of CCR5 in vitro on CD4+ (top) and CD8+ (bottom) T cells up to 10 days post electroporation. Data from 3 independent PBMC donors are averaged, and error bars show ± SD. Area-under-the-curve (AUC) analysis of total CCR5 expression on (F) CD4+ and (G) CD8+ T cells throughout 10 days in culture. Each data point represents the average of 3 technical replicates, and each data point represents a distinct biological replicate using different donor PBMCs. Error bars denote minimum to maximum values. *denotes p < 0.05 and statistics generated from the Mann–Whitney test and p values are one-tailed.
Fig. 3
Fig. 3. CCR5 ablation in primary CD4+ T cells prevents HIV spread in vitro.
PBMCs from 3 healthy adult donors were stimulated with PHA for 3 days, electroporated with indicated gRNAs complexed with Cas9, and challenged with HIVJRCSF at a 0.5 multiplicity of infection 2 days after electroporation and in triplicate for each donor. HIV spread in culture was assessed at 2-day intervals by intracellular staining for Gag p24 antigen. A Kinetics of HIV spread following HIVJRCSF infection of either mock edited (GFP gRNA, green) or CCR5 edited CD4+ T cells. Error bars represent ± SD for 3 technical replicates. B A box and whisker plot depicts the average initial infection rate 2 days after infection for all biological and technical replicates (n = 9) for each gRNA. Error bars denote minimum and maximum values, the line denotes median, and box bounds the 25th and 75th percentiles. C A box and whisker plot depicts the cumulative infection rate calculated as the area-under-the-curve (AUC) for all biological and technical replicates (n = 9) for each gRNA. Error bars denote minimum and maximum values, the line denotes median, and box bounds the 25th and 75th percentiles. Dotted horizontal lines represent the average background Gag p24 staining in mock-infected CD4+ T cells. D Plot depicting the association between the log10-transformed total AUC percentage of CCR5+ CD4+ T cells and the log10-transformed total AUC percentage of p24+ CD8- T cells per PBMC donor and gRNA condition. Different symbols represent distinct PBMC donors and represent the mean of 3 technical replicates. Error bars denote ± SD. B, C ****denotes p < 0.0001, ***denotes p < 0.001, **denotes p < 0.01, *denotes p < 0.05. Statistics were generated from the Mann-Whitney test and p values are two-tailed. D Statistics were generated from a two-tailed Spearman rank correlation (p < 0.0001).
Fig. 4
Fig. 4. CCR5 editing in human HSPCs does not significantly alter longitudinal engraftment or hematopoiesis.
A Mobilized CD34+ HSPCs derived from three healthy adult human donors were electroporated with Cas9 complexed to gRNAs TB48 and TB50. Single gRNA gene disruptions were measured by Sanger sequencing of CCR5 amplified from genomic DNA isolated 48-h after electroporation. Dual gRNA deletions were measured via droplet-digital PCR. Minimum and maximum editing was calculated using single and dual gRNA editing frequencies (see Methods for calculation details). B Number and type of colonies derived from 3 donor HSPCs for each condition culture control, mock edited (GFP gRNA), and CCR5 edited (TB48 + TB50 dual gRNA) cultured in a methylcellulose-based colony forming unit assay. Bars represent the mean and error bars represent the standard deviation for the number of colonies of each type for the 3 distinct HSPC donors. C, D The absolute number and lineage distribution of human CD45+ cells in the blood were measured at 1-month intervals by multiparameter flow cytometry in NBSGW immunodeficient mice engrafted with 1 × 106 untouched (n = 15), mock edited (GFP gRNA) (n = 19), or CCR5 edited (n = 19) HSPCs. C The absolute number of human CD45+ cells per uL of blood in NBSGW mice engrafted with untouched (gray bars), mock edited (green bars), or CCR5 edited (blue bars) HSPCs. Bars represent mean and error bars denote ± SD. Statistics generated from the Student’s t-test and p values are two-tailed. **denotes p < 0.01. D Stacked bar graphs depict the average frequency of distinct human hematopoietic cell lineages in mice transplanted with untouched, mock edited, or CCR5 edited HSPCs at monthly intervals. Error bars represent the standard deviation in each lineage frequency.
Fig. 5
Fig. 5. Robust CCR5 editing in HSPCs is stable in vivo and gives rise to differentiated myeloid and lymphoid cell lineages lacking CCR5.
A Representative FACS plots demonstrating ablation of surface CCR5 protein in CD33+ myeloid cells (left panel) and CD3+/CD4+ T cells (right panel) in the peripheral blood of xenograft mice 20 weeks post-transplant. B The percentage of CCR5-expressing myeloid cells as measured by flow cytometry in the peripheral blood of mice transplanted with 1 × 106 untouched (n = 15, gray bars), mock edited (GFP gRNA) (n = 19, green bars), or dual gRNA CCR5 edited (n = 19) HSPCs at monthly intervals. **denotes p < 0.01 and statistics generated from the Student’s t-test and p values are two-tailed. Bars represent mean and error bars denote ± SD. C The percentage of CCR5-expressing CD3+ T cells at 20 and 24 weeks post-transplant in xenograft mice with appreciable human T cell numbers from different HSPC transplant groups. **denotes p < 0.01 and statistics generated from the Student’s t-test and p values are two-tailed. Bars represent mean and error bars denote ± SD.
Fig. 6
Fig. 6. Xenograft transplant with HSPCs exhibiting high-frequency CCR5 editing confers resistance to CCR5-tropic HIV infection.
NSG mice were transplanted with either 1 × 106 mock edited (GFP gRNA) or CCR5 edited (TB48 + TB50 dual gRNA) HSPCs following sublethal irradiation of 200 cGy. 24 weeks after transplant, mice demonstrating sufficient human T cell reconstitution (>10 CD4+ T cells/uL of blood) were challenged intraperitoneally with 20,000 TCID50 of CCR5-tropic HIVJRCSF. Viral loads and CD4+ T cell counts were assessed weekly by qRT-PCR and flow cytometry, respectively. Following two negative viral loads, uninfected mice were re-challenged with 100,000 TCID50 HIVJRCSF. A Viral load in individual mock edited (n = 11, green) and CCR5 edited (n = 6, blue) mice via qRT-PCR from weekly blood draws following HIVJRCSF challenge. denotes animal euthanized prior to experimental endpoint due to health concerns. B Average frequency of human CD4+ T cells within total T cells in the blood of mock edited (green, n = 11) and CCR5 edited (blue, n = 5) mice following HIVJRCSF challenge. *denotes p < 0.05 and statistics are generated from a one-tailed Student’s t-test. Error bars represent ± SEM. C Log10-transformed number of HIV DNA copies per 1 × 106 human cells as measured in genomic DNA extracted from pooled lymph nodes by a multiplexed droplet-digital PCR assay. The limit of detection (LOD) for the assay is set as the threshold to detect a single HIV DNA copy in the total number of human cells assayed per mouse. Lines represent the mean. D A single CCR5 edited humanized mouse that was resistant to both HIVJRCSF challenges was subsequently challenged with 20,000 TCID50 of HIVNL4-3 via the intraperitoneal route and log10-transformed HIV RNA copies per mL are plotted.
Fig. 7
Fig. 7. Frequency of CCR5 editing determines risk of HIV infection.
A NBSGW mice were transplanted with 1 × 106 HSPCs in five “doses” of CCR5 edited HSPCs with the balance of HSPCs comprising mock edited (GFP gRNA) cells ranging from 100% to 0%. Animals were monitored for frequency of CCR5 expression on relevant cell populations via flow cytometry at 1-month intervals for 6 months, then challenged weekly with 20,000 TCID50 of HIVJRCSF via the intraperitoneal route for 8 weeks. B CD19+ B cells were isolated from the bone marrow of HIV-challenged mice at necropsy and CCR5 gene editing in the human graft was quantified for each CCR5 edited HSPC transplant dose. Group means indicated by horizontal lines. C CCR5 expression levels in human CD33+ myeloid cells at monthly intervals following transplant for each HSPC titration group (n = 19 mice per group) and before HIV challenge. Bars represent mean and error bars denote ± SD. D CCR5 expression levels in CD3+CD4+ T cells 20 and 24 weeks after transplant and before HIV challenge (n = 15 mice per group). Bars represent mean and error bars denote + SD. E Plasma viral loads were monitored weekly for all mice via qRT-PCR. Kaplan–Meier curves for each study arm (solid lines) and corresponding expected survival curves based on the best fit mechanistic model assuming the “barrier at inoculation” mechanism (dashed curves). Statistics were generated by comparing each pair of transplant groups using the log-rank test. F Mechanistic model of the risk of infection per HIV challenge (red line) and the corresponding number of inoculations required to infect 50% of animals (blue line) as functions of the quantified frequency of CCR5 editing. G Observed percentage of animals infected after 8 HIV challenges for each quintile of frequency of CCR5 editing (bars with 95% confidence intervals) and the expected percentage of infection (dashed curve) based on the model in (F). Infection status of each animal after 8 challenges (solid or open points for infected or uninfected, respectively) indicated by the right-hand vertical axis. H Maximum viral load vs. %CCR5 edited.
Fig. 8
Fig. 8. Potential protective mechanisms of CCR5 editing in the human clinical context.
A Schematics of mechanisms of action by which partial CCR5 editing may confer protection from post-transplant, post-ART HIV rebound. In this study, we have shown that protection from HIV challenge is conferred by CCR5 editing in proportion to the frequency of CCR5 edited target cells. The same mechanism of reducing the available target cell concentration may also reduce the chance of successful HIV reactivation from latency during a post-transplant cessation of ART as reactivating virions will not encounter sufficient target cells (creating a “Barrier at Inoculation”; red panel). Additionally, a sub-sterilizing reduction of target cell concentration may still reduce subsequent HIV replication capacity (R0) by reducing target cell availability. If the frequency of target cells is sufficiently reduced, by virtue of a high enough frequency of CCR5 edited cells, post-ART viral replication, and viremia may be blunted (“Barrier at Dissemination”, blue panel). B Projected post-transplant, post-ART time-to-rebound (red; corresponding to “Barrier at Inoculation” mechanism) and fold change in set-point viral load (blue; corresponding to “Barrier at Dissemination” mechanism), shown as functions of theoretical frequency of CCR5 editing, based on the observed relationship between HIV infection risk and frequency of CCR5 editing in this study (see Supplementary Text S1.8 for details).

Similar articles

Cited by

References

    1. Siliciano, J. D. et al. Long-term follow-up studies confirm the stability of the latent reservoir for HIV-1 in resting CD4+ T cells. Nat. Med.9, 727–728 (2003). - PubMed
    1. Josefsson, L. et al. The HIV-1 reservoir in eight patients on long-term suppressive antiretroviral therapy is stable with few genetic changes over time. Proc. Natl. Acad. Sci. USA110, E4987–E4996 (2013). - PMC - PubMed
    1. Besson, G. J. et al. HIV-1 DNA decay dynamics in blood during more than a decade of suppressive antiretroviral therapy. Clin. Infect. Dis.59, 1312–1321 (2014). - PMC - PubMed
    1. von Stockenstrom, S. et al. Longitudinal genetic characterization reveals that cell proliferation maintains a persistent HIV type 1 DNA pool during effective HIV therapy. J. Infect. Dis.212, 596–607 (2015). - PMC - PubMed
    1. Brodin, J. et al. Establishment and stability of the latent HIV-1 DNA reservoir. Elife5, e18889 (2016). - PMC - PubMed

LinkOut - more resources