. 2025 Jan 7;16(1):451.
doi: 10.1038/s41467-024-55758-x.

Mitochondria- and ER-associated actin are required for mitochondrial fusion

Affiliations

Mitochondria- and ER-associated actin are required for mitochondrial fusion

Priya Gatti et al. Nat Commun. .

Abstract

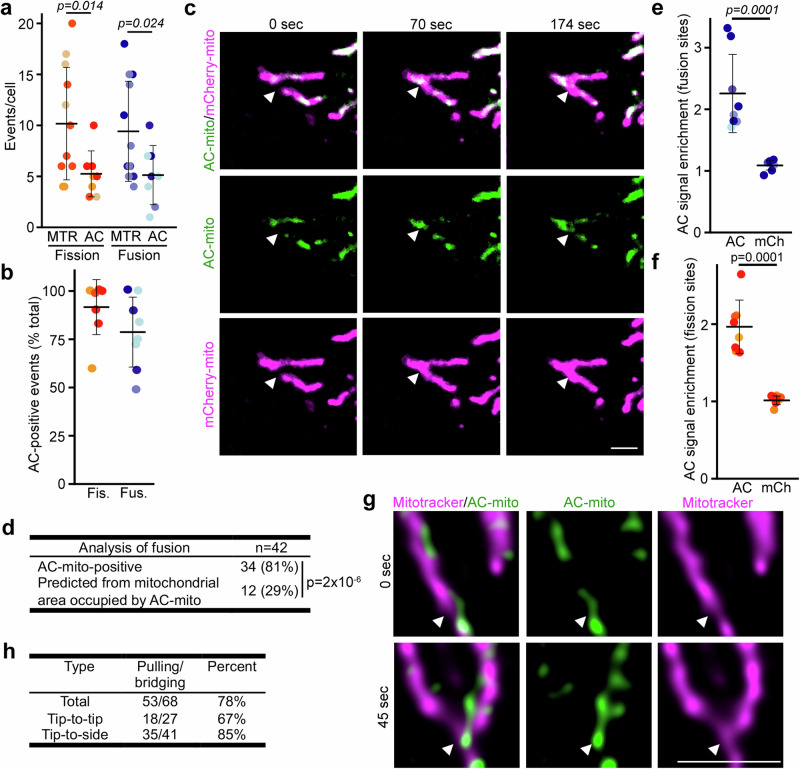
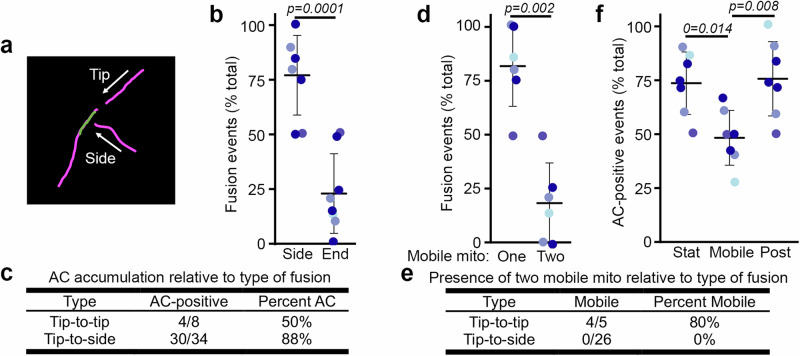
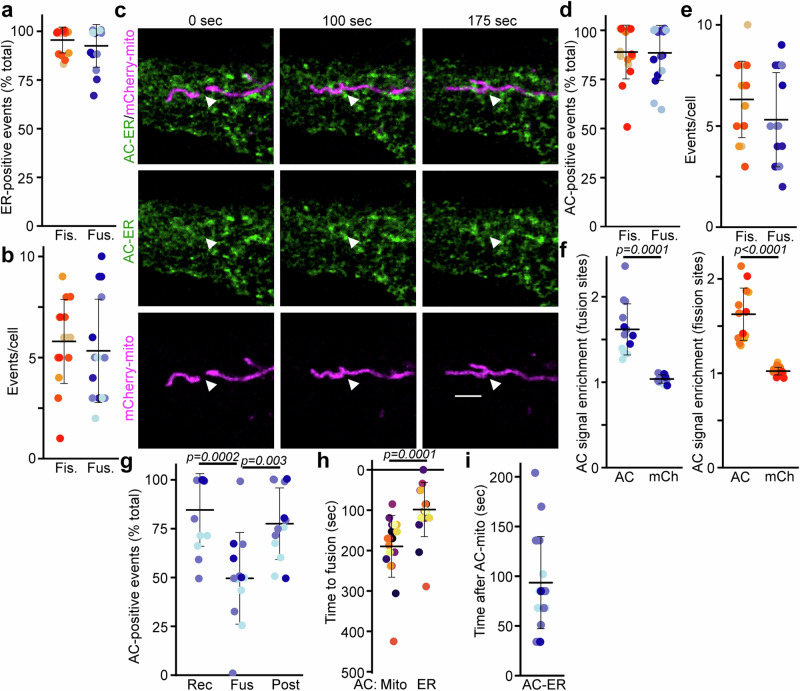
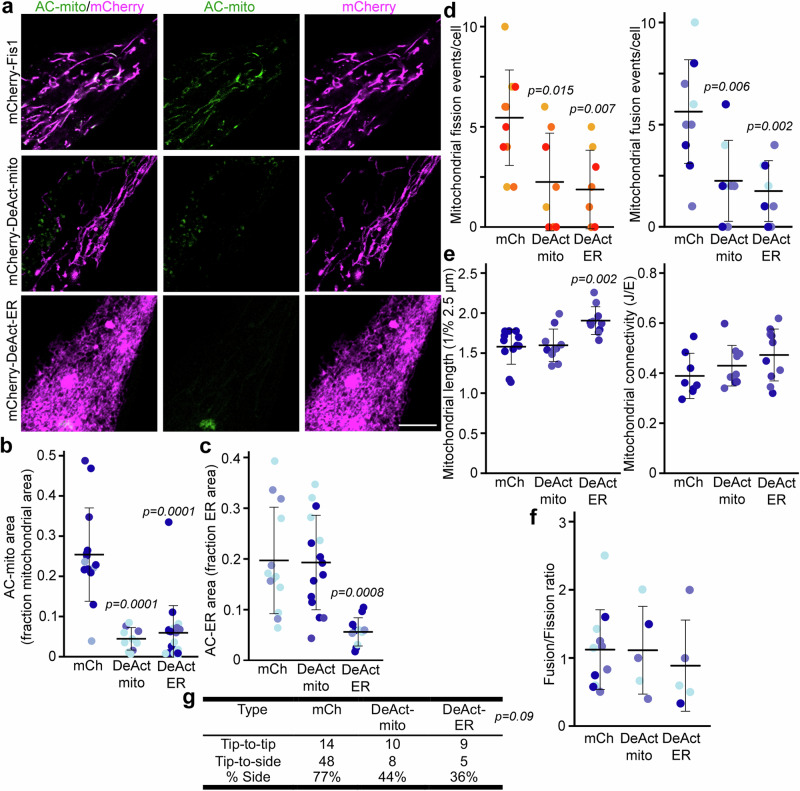
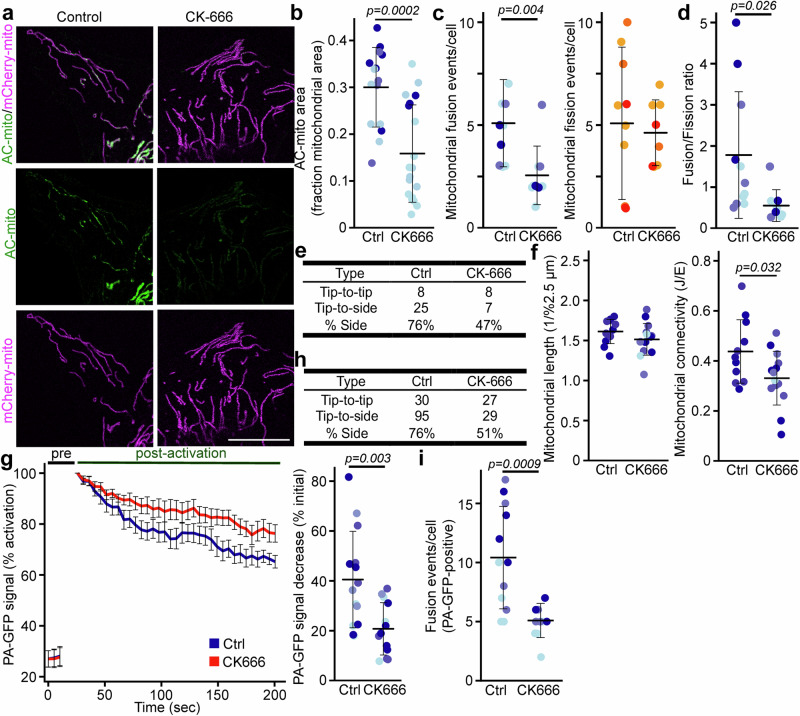
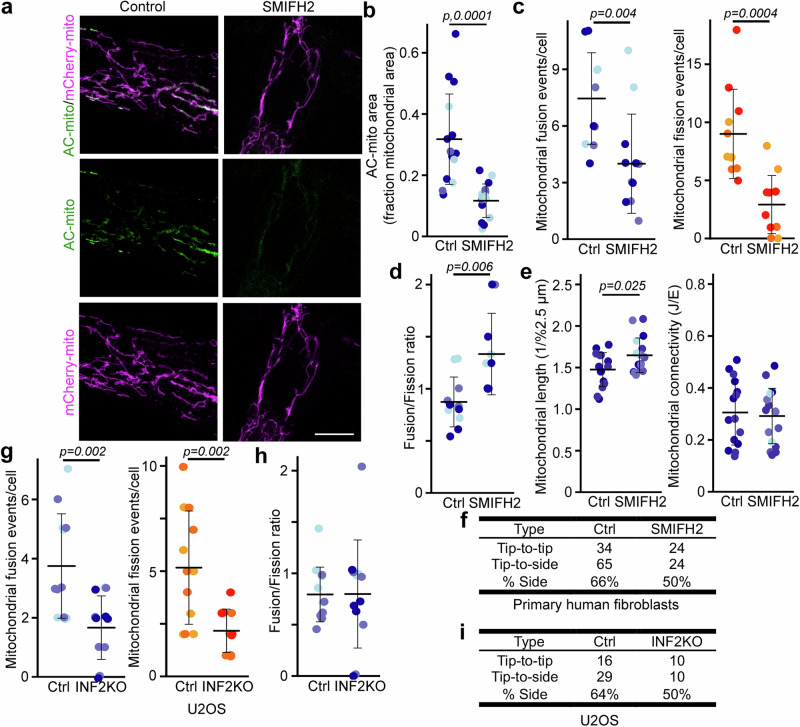
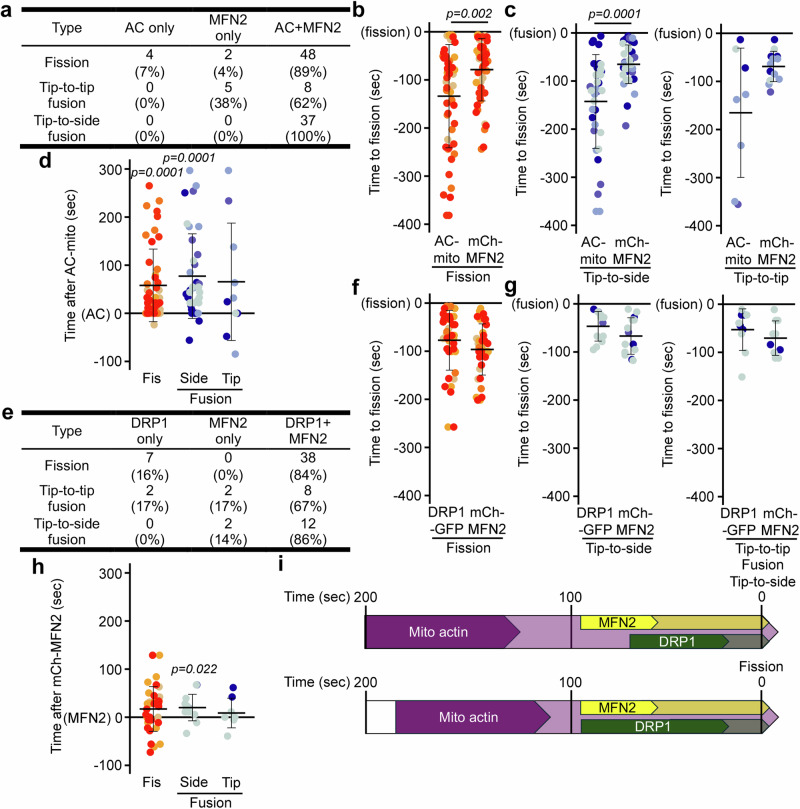
Mitochondria are crucial for cellular metabolism and signalling. Mitochondrial activity is modulated by mitochondrial fission and fusion, which are required to properly balance metabolic functions, transfer material between mitochondria, and remove defective mitochondria. Mitochondrial fission occurs at mitochondria-endoplasmic reticulum (ER) contact sites, and requires the formation of actin filaments that drive mitochondrial constriction and the recruitment of the fission protein DRP1. The role of actin in mitochondrial fusion remains entirely unexplored. Here we show that preventing actin polymerisation on either mitochondria or the ER disrupts both fission and fusion. We show that fusion but not fission is dependent on Arp2/3, whereas both fission and fusion require INF2 formin-dependent actin polymerization. We also show that mitochondria-associated actin marks fusion sites prior to the fusion protein MFN2. Together, our work introduces a method for perturbing organelle-associated actin and demonstrates a previously unknown role for actin in mitochondrial fusion.


Conflict of interest statement

Competing interests: The authors declare no competing interests.

Figures

Fig. 1
Fig. 1. Actin marks the site of mitochondrial fusion.
a Quantification of fission and fusion events in cells in which mitochondria were stained with Mitotracker (MTR) and cells transfected with mCherry-mito and AC-mito (AC). Each point represents an individual cell, with at 12 cells (MTR) and 8 cells (AC) quantified in 4 independent experiments. Bars show the average ±SD. b, c AC-positive fission and fusion events. Cells were transfected with mCherry-mito (mitochondria, magenta) and AC-mito (actin, green). Quantification of fission (Fis.) and fusion (Fus.) events positive for AC-mito. Each point represents an individual cell, with 10 cells quantified in 4 independent experiments (same cells as in (a) AC). Bars show the average ± SD. Two-sided t-test. Representative fusion event showing the enrichment of AC-mito at the fusion site (arrowhead) is shown in (c). Scale bar 2 µm. d Number of AC-mito-positive fusion events compared to the expected number AC-mito-positive fusion events predicted from the mitochondrial area covered AC-mito). Fisher’s exact test. e, f AC-mito signal enrichment at fusion (e) and fission (f) sites in cells transfected as in B. Signal intensity at the event site relative to an adjacent site on the mitochondrial network was quantified for AC-mito (AC) and mCherry-mito (mCh). Each point represents an individual cell, with 8 cells quantified in 4 independent experiments. Bars show the average ±SD. Two-sided t-test. g, h SIM imaging of U2OS transfected with AC-mito and stained with mitotracker. g Representative image showing AC-mito (Green) and mitochondria (Mitotracker, Magenta). Scale bar 1 µm. The arrowheads point to the fusion site. h Quantification of the number of fusion events where actin bridges the two fusing mitochondria as in the bottom image in (g). The total number of fusion events from 5 cells is shown. The same data was also separated into tip-to-tip and tip-to-side fusion events (see Fig. 2).
Fig. 2
Fig. 2. Actin is mainly associated with tip-to-side mitochondrial fusion.
a Schematic representation of tip-to-tip and tip-to-side fusion events. b, c Quantification of fusion events as end to-side (Side) or tip-to-tip (End) (b), and their corresponding association with AC-mito (c) in cells from Fig. 1b, c (transfected with mCherry-mito and AC-mito). Each point represents an individual cell, with 10 cells (e) quantified in 4 independent experiments. Bars show the average ± SD. Two-sided t-test. Total events from the quantified cells are shown in (c). d, e Quantification of fusion events containing one or two mobile mitochondria (d) and their corresponding association with AC-mito (e). Each point represents an individual cell with 8 cells quantified in 4 independent experiments. Bars show the average ± SD. Two-sided t-test. Total events from the quantified cells are shown in (e). f Quantification of AC-mito signal associated with each of the fusing mitochondria (the stationary mitochondrion (Stat) and the mobile mitochondrion (Mobile)) as well as with the fusion site one frame post-fusion (Post). Each point represents an individual cell, with 9 cells quantified in 4 independent experiments. Bars show the average ± SD. One-way ANOVA.
Fig. 3
Fig. 3. ER-associated actin is present at the site of mitochondrial fusion.
a, b Quantification of fission (Fis.) and fusion (Fus.) events associated with ER. Cells were transfected with mCherry-ER and mito-GFP. Each point represents an individual cell, with 15 cells quantified in 4 independent experiments. a ER-Positive events (%), (b) Total events per cell. Bars show the average ± SD. c Representative fusion event showing the enrichment of AC-ER at the fusion site (arrowhead). Cells were transfected with mCherry-mito (mitochondria, magenta) and AC-ER (actin, green). Scale bar 2 µm. d, e Quantification of fission (Fis.) and fusion (Fus.) events positive for AC-mito. Each point represents an individual cell, with 13 cells quantified in 3 independent experiments. d ER-Positive events (%), (e) Total events per cell. f AC-ER signal enrichment at fusion (Left) and fission (Right) sites in cells transfected as in (c). Signal intensity at the event site relative to an adjacent site on the ER network was quantified for AC-ER (AC) and mCherry-ER (mCh). Each point represents an individual cell, with 13 cells quantified in 3 independent experiments. Bars show the average ± SD. two-sided t-test. g Quantification of AC-ER signal associated with each of the fusing mitochondria (the stationary mitochondrion (Rec) and the mobile mitochondrion (Fus)) as well as with the fusion site one frame post-fusion (Post). Each point represents an individual cell, with 13 cells quantified in 3 independent experiments. Bars show the average ± SD. One-way ANOVA. h, i Kinetics of recruitment of AC-mito and AC-ER at the fusion site showing AC-ER recruitment relative to AC-mito (g) and recruitment of either marker relative to the time of fusion (h). Each point represents an individual event (20 events total in 4 cells within 3 independent experiments). two-sided t-test.
Fig. 4
Fig. 4. Mitochondrial actin is required for both fission and fusion.
a Representative images showing the loss of AC-mito signal (green) in cells transfected with DeAct-mito or DeAct-ER (magenta) and AC-mito. b, c Quantification of AC-mito (b) and AC-ER (c) signal accumulation in cells transfected as in (a). Each point represents an individual cell, with 14 (mCh), 10 (DeAct mito; b), 16 (DeAct mito; c), 22 (DeActER; b) and 14 (DeActER; c) cells quantified in 3 independent experiments for each condition. Bars show the average ± SD. One-way ANOVA. d Quantification of the number of fission (Left) and fusion (Right) events in cells transfected with the indicated DeAct probe, AC-mito and mCherry-Fis1 (to label mitochondria). Each point represents an individual cell, with 11 (mCh), 8 (DeAct-mito) and 9 (DeAct-ER) cells quantified in 3 independent experiments. Bars show the average ± SD. One-way ANOVA. e Quantification of mitochondrial length (Left) and connectivity (Right) in cells from (d). Each point represents an individual cell. Bars show the average ± SD. One-way ANOVA. f fusion/fission ratio quantified from the data in (d). g Quantification of fusion events as tip-to-side (Side) or tip-to-tip (End). The total number of events for 8 cells in 3 experiments is shown for each condition. Chi-square test.
Fig. 5
Fig. 5. The Arp2/3 complex regulates mitochondrial fusion.
a Representative images showing the loss of AC-mito signal in primary fibroblasts transfected with AC-mito (green) and mCherry-Fis1 (magenta), and treated with the Arp2 inhibitor CK-666. Scale bar 10 µm (b) Quantification of AC-mito signal accumulation in cells transfected as in (a). Each point represents an individual cell, with 15 cells quantified per condition in 3 independent experiments. Bars show the average ± SD. Two-sided t-test. (c) Quantification of the number of fusion (Left, blue) and fission (Right, orange) events, as well as the fusion/fission ratio (d) in cells transfected as in (a) and treated as indicated. Each point represents an individual cell, with 12 (control) and 9 (CK-666) cells quantified in 3 independent experiments. Bars show the average ± SD. Two-sided t-test. e Quantification of fusion events as tip-to-side (Side) or tip-to-tip (End). The total number of events for 9 cells in 3 experiments is shown for each condition. f Quantification of mitochondrial length (Left) and connectivity (Right) in cells from (c). Each point represents an individual cell. Bars show the average ± SD. One-way ANOVA. gi Mitochondrial fusion assay. Human primary fibroblasts were transfected with photoactivatable-GFP (PA-GFP), treated as indicated and imaged before (pre) and after activation with the 405 nm laser. Fluorescence traces (g, Left) and the quantification of the loss of fluorescence at 3 min relative to the initial time post-activation (g, Right) are shown. Each point (g, Right) represents an individual cell, with 14 ctrl and 16 CK-666 cells quantified in 4 independent experiments. Bars show the average ± SD. Two-sided t-test. Fusion was also directly quantified by measuring the events in which PA-GFP was transferred from one mitochondrion to another upon fusion (H, separation by fusion type; I, total fusion events). Each point represents an individual cell, with 12 ctrl and 11 CK-666 cells quantified in 3 independent experiments. Bars show the average ± SD. Two-sided t-test.
Fig. 6
Fig. 6. Formin-dependent regulation of mitochondrial fusion.
a Representative images showing AC-mito signal in primary fibroblasts transfected with AC-mito (green) and mCherry-Fis1 (magenta), and treated with the formin inhibitor SMIFH2. Scale bar 10 µm (b) Quantification of AC-mito signal accumulation in cells transfected as in (a). Each point represents an individual cell, with 12 cells quantified in 3 independent experiments. Bars show the average ±SD. Two-sided t-test. c, d Quantification of the number of fusion (c, Left, blue) and fission (c, Right, orange) events, as well as the fusion/fission ratio (d) in cells transfected as in (a) and treated as indicated. Each point represents an individual cell, with 12 cells quantified in 3 independent experiments. Bars show the average ± SD. Two-sided t-test. e Quantification of mitochondrial length (Left) and connectivity (Right) in cells from (b). Each point represents an individual cell. Bars show the average ± SD. Two-sided t-test. f Quantification of fusion events as tip-to-side (Side) or tip-to-tip (End). The total number of events for 12 cells in 3 experiments is shown for each condition. g, h Quantification of the number of fusion (Left, blue) and fission (Right, orange) events, as well as the fusion/fission ratio (h) in U2OS cells in which INF2 has been deleted using CRISPR/Cas9. Each point represents an individual cell, with 12 cells quantified in 3 independent experiments. Bars show the average ± SD. Two-sided t-test. i Quantification of fusion events as tip-to-side (Side) or tip-to-tip (End). The total number of events for 12 cells in 3 experiments is shown for each condition.
Fig. 7
Fig. 7. Mitochondrial actin precedes the recruitment of mitochondrial Dynamins at fusion and fission sites.
ad Temporal relationship between mitochondrial actin and the fusion dynamin MFN2. Cells were transfected with mCherry-MFN2 and AC-mito while mitochondria were visualised with Mitotracker Deep red. (a) Presence of AC-mito and mCherry-MFN2 at sites of mitochondrial fission, tip-to-side fusion and tip-to-tip fusion. bd Kinetics of recruitment of AC-mito and mCherry-MFN2 at fission (b) and fusion (c) sites showing recruitment of either marker relative to the time of fusion, as well as mCherry-MFN2 recruitment relative to AC-mito (d). Each point represents an individual event in 4 cells within 3 independent experiments). Bars show the average ± SD. two-sided t-test. eh Temporal relationship between the fusion dynamin MFN2 and the fission Dynamin DRP1. Cells were transfected with mCherry-MFN2 and GFP-DRP1 while mitochondria were visualised with Mitotracker Deep red. e Presence of GFP-DRP1 and mCherry-MFN2 at sites of mitochondrial fission, tip-to-side fusion and tip-to-tip fusion. (fh) Kinetics of recruitment of mCherry-MFN2 andGFP-DRP1 at fission (f) and fusion (g) sites showing recruitment of either marker relative to the time of fusion, as well as GFP-DRP1 recruitment relative to mCherry-MFN2 (d). Each point represents an individual event in 3 cells within 3 independent experiments). Bars show the average ± SD. two-sided t-test. (i) Schematic representation of the timing of MFN2 and DRP1 recruitment to tip-to-side fusion (Top) and fission (Bottom) relative to actin recruitment (AC-mito-positive).

Update of

Similar articles

Cited by

References

    1. Chandel, N. S. Evolution of Mitochondria as Signaling Organelles. Cell Metab.22, 204–206 (2015). - PubMed
    1. Chen, H. et al. Mitofusins Mfn1 and Mfn2 coordinately regulate mitochondrial fusion and are essential for embryonic development. J. Cell Biol.160, 189–200 (2003). - PMC - PubMed
    1. Shirihai, O. S., Song, M. & Dorn, G. W. 2nd How mitochondrial dynamism orchestrates mitophagy. Circ. Res116, 1835–1849 (2015). - PMC - PubMed
    1. Tan, J. X. & Finkel, T. Mitochondria as intracellular signaling platforms in health and disease. J. Cell Biol.219, e202002179 (2020). - PMC - PubMed
    1. Detmer, S. A. & Chan, D. C. Functions and dysfunctions of mitochondrial dynamics. Nat. Rev. Mol. Cell Biol.8, 870–879 (2007). - PubMed

MeSH terms