

Modelling hepatocellular carcinoma microenvironment phenotype to evaluate drug efficacy
- PMID: 39774014
- PMCID: PMC11706984
- DOI: 10.1038/s41598-024-84304-4
Modelling hepatocellular carcinoma microenvironment phenotype to evaluate drug efficacy
Abstract
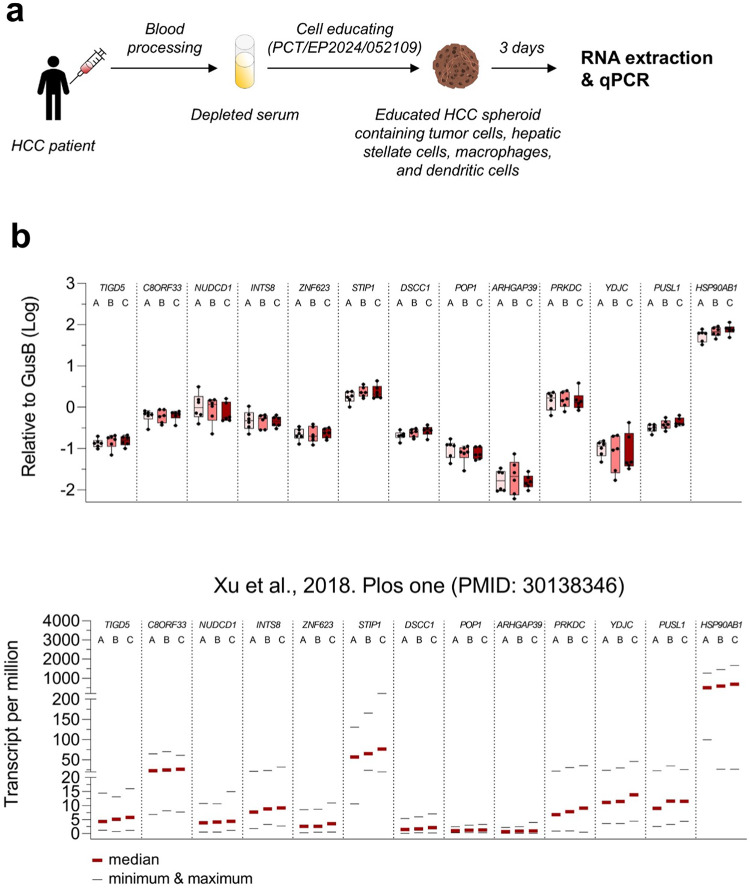
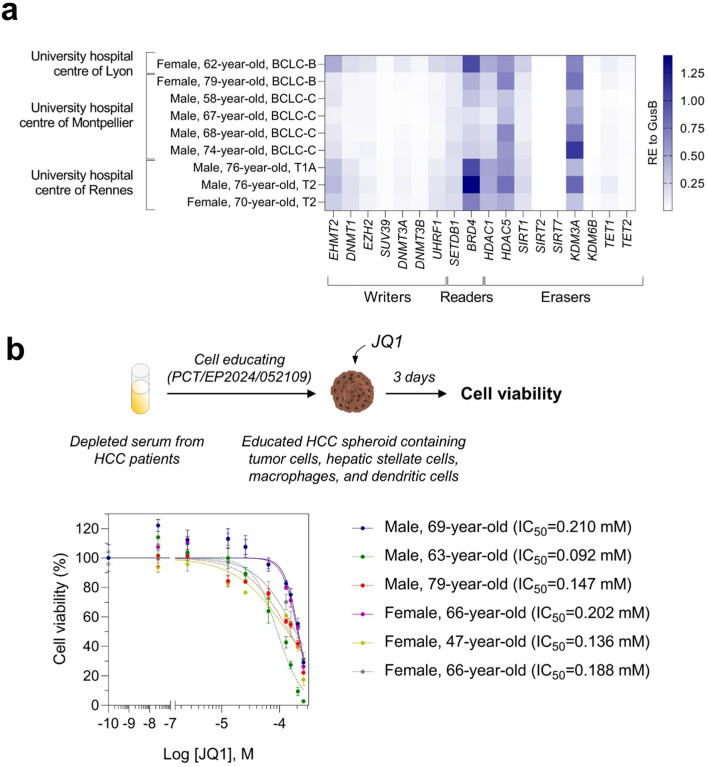
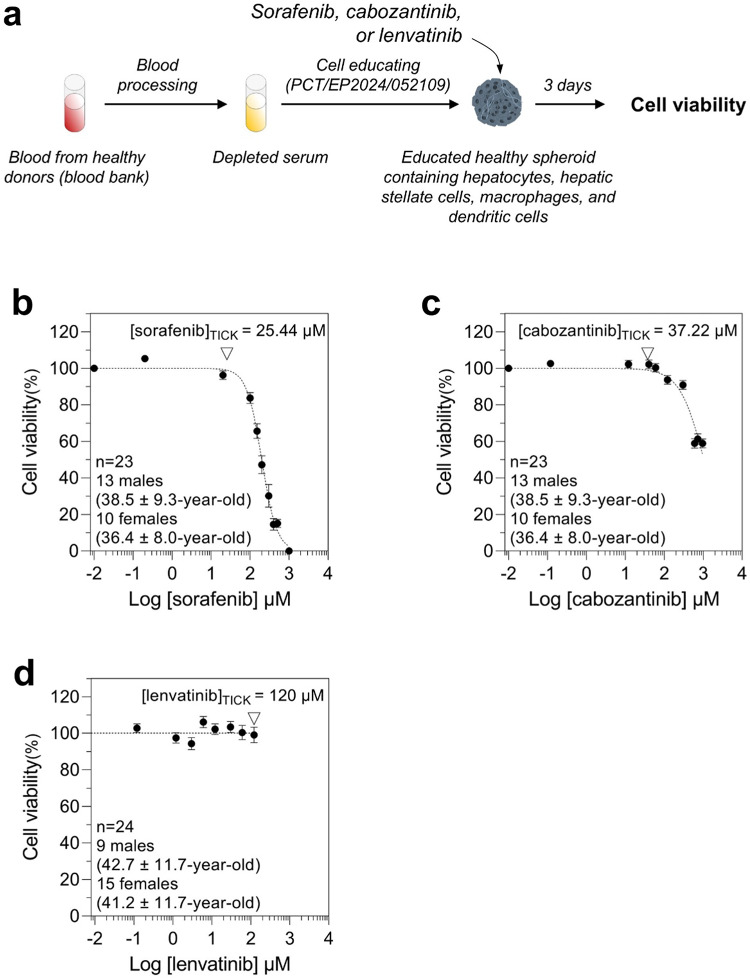
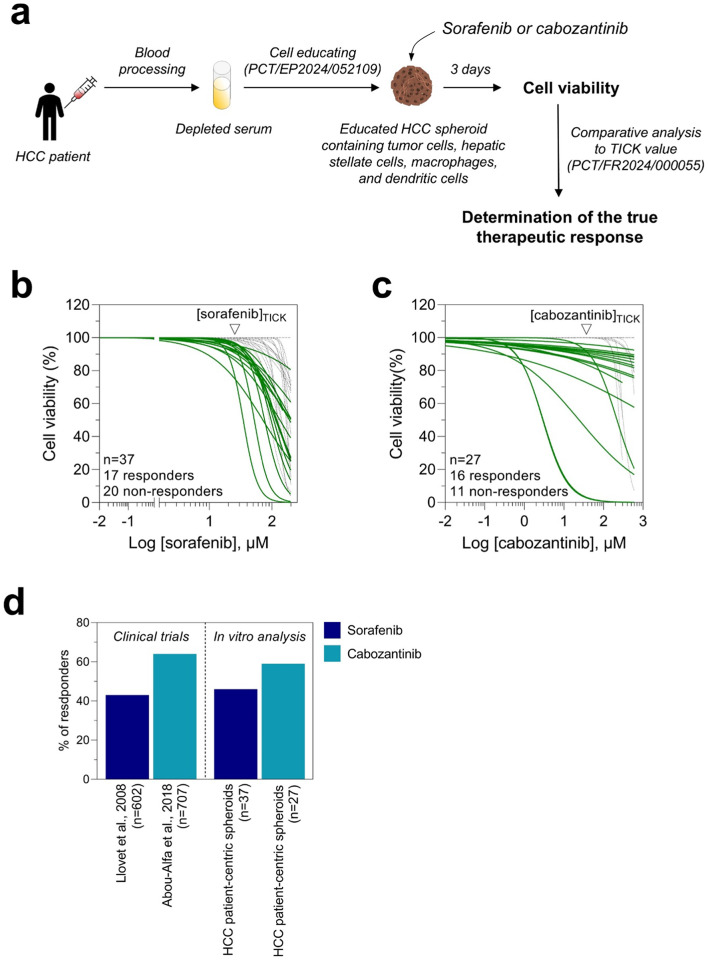
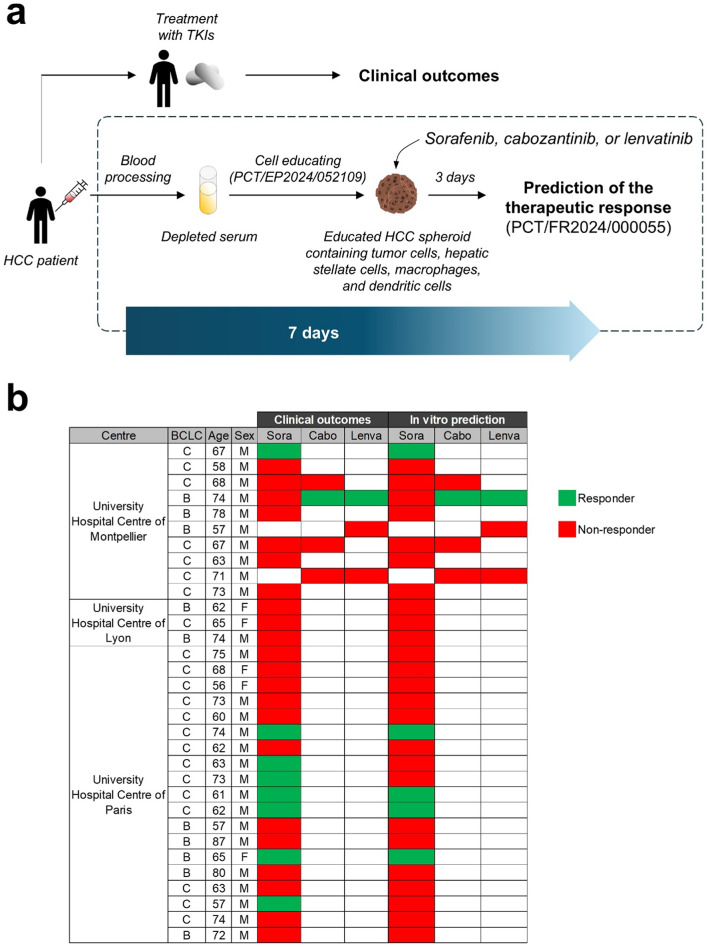
Hepatocellular carcinoma (HCC) is the third most common cause of cancer-related death worldwide. Treating HCC is challenging because of the poor drug effectiveness and the lack of tools to predict patient responses. To resolve these issues, we established a patient-centric spheroid model using HepG2, TWNT-1, and THP-1 co-culture, that mimics HCC phenotype. We developed a target-independent cell killing (TICK) exclusion strategy to monitor the therapeutic response. We demonstrated that our model reproduced the Barcelona Clinic Liver Cancer (BCLC) molecular classification, displayed known alterations of epigenetic players, and responded to tyrosine kinase inhibitors (TKIs) such as sorafenib, cabozantinib, and lenvatinib in a patient-dependent manner. Importantly, we reported for the first time that our model correctly predicted 34 clinical outcomes to TKIs out of 37 case studies on 32 HCC patients confirming that patient-centric spheroids, combined with our TICK exclusion strategy, are valuable models for drug discovery and opening a near perspective to personalized care.
Keywords: Hepatocellular carcinoma; Patient-centric spheroid model; Prediction of clinical outcomes; Targeted therapy; Tyrosine kinase inhibitors.
© 2024. The Author(s).
Conflict of interest statement
Declarations. Competing interests: S.C., S.R., and H.T.D. are employees of PredictCan Biotechnologies SAS. S.C. and H.T.D. are founders of PredictCan Biotechnologies SAS. The other authors have no competing interests. Ethical approval: The research protocol was conducted under French legal guidelines and fulfilled the requirements of the local institutional ethics committee. The study was approved by the “Direction Générale de la recherche et de l’innovation” (CODECOH, n°DC-2021-4779). This project does not involve the human person according to the legislation (article L1121-1 du code de la santé publique).
Figures
Similar articles
-
Differential effectiveness of tyrosine kinase inhibitors in 2D/3D culture according to cell differentiation, p53 status and mitochondrial respiration in liver cancer cells.Cell Death Dis. 2020 May 7;11(5):339. doi: 10.1038/s41419-020-2558-1. Cell Death Dis. 2020. PMID: 32382022 Free PMC article.
-
Tyrosine Kinase Inhibitors and Hepatocellular Carcinoma.Clin Liver Dis. 2020 Nov;24(4):719-737. doi: 10.1016/j.cld.2020.07.012. Epub 2020 Sep 28. Clin Liver Dis. 2020. PMID: 33012455 Review.
-
ST6GAL1 Is a Novel Serum Biomarker for Lenvatinib-Susceptible FGF19-Driven Hepatocellular Carcinoma.Clin Cancer Res. 2021 Feb 15;27(4):1150-1161. doi: 10.1158/1078-0432.CCR-20-3382. Epub 2020 Dec 7. Clin Cancer Res. 2021. PMID: 33288659
-
Lenvatinib: a potential breakthrough in advanced hepatocellular carcinoma?Future Oncol. 2016 Feb;12(4):465-76. doi: 10.2217/fon.15.341. Epub 2016 Jan 20. Future Oncol. 2016. PMID: 26785762 Review.
-
Lenvatinib and its use in the treatment of unresectable hepatocellular carcinoma.Future Oncol. 2018 Aug;14(20):2021-2029. doi: 10.2217/fon-2017-0689. Epub 2018 May 22. Future Oncol. 2018. PMID: 29783903 Review.
References
-
- Asafo-Agyei, K. O. & Samant, H. StatPearls (2023).
-
- Yang, C. et al. Evolving therapeutic landscape of advanced hepatocellular carcinoma. Nat. Rev. Gastroenterol. Hepatol.20, 203–222. 10.1038/s41575-022-00704-9 (2023). - PubMed
-
- da Fonseca, L. G., Reig, M. & Bruix, J. Tyrosine kinase inhibitors and hepatocellular carcinoma. Clin. Liver Dis.24, 719–737. 10.1016/j.cld.2020.07.012 (2020). - PubMed
-
- Llovet, J. M. et al. Sorafenib in advanced hepatocellular carcinoma. N. Engl. J. Med.359, 378–390. 10.1056/NEJMoa0708857 (2008). - PubMed
Publication types
MeSH terms
Substances
Grants and funding
LinkOut - more resources
Full Text Sources
Medical
