. 2025 Jan 7;15(1):1130.
doi: 10.1038/s41598-024-82577-3.

Nonlinear excitation of energetic particle driven geodesic acoustic mode by resonance overlap with Alfvén instability in ASDEX Upgrade

Collaborators, Affiliations

Nonlinear excitation of energetic particle driven geodesic acoustic mode by resonance overlap with Alfvén instability in ASDEX Upgrade

Hao Wang et al. Sci Rep. .

Abstract

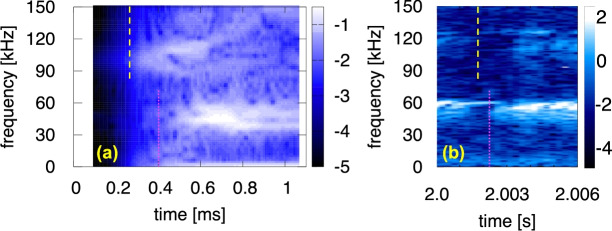
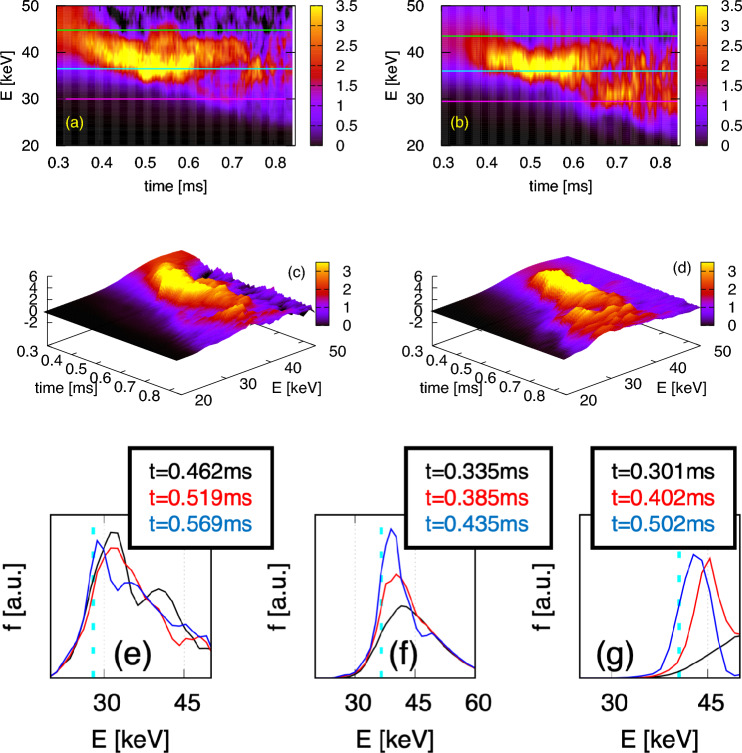
The Alfvén instability nonlinearly excited the energetic-particle-driven geodesic acoustic mode on the ASDEX-Upgrade tokamak, as demonstrated experimentally. The mechanism of the energetic-particle-driven geodesic acoustic mode excitation and the mode nonlinear evolution is not yet fully understood. In the present work, a first-principles simulation using the MEGA code investigated the mode properties in both the linear growth and nonlinear saturated phases. Here we show that the simulation successfully reproduced the excitation and coexistence of these two modes, and agreed with the experimental results well. Conclusive evidence showed that the resonance overlap is the excitation mechanism of the energetic-particle-driven geodesic acoustic mode. In the linear growth phase, energetic particles that satisfied different resonance conditions excited the Alfvén instability, which then caused energetic particle redistribution in phase space. These redistributed energetic particles caused resonance overlap, exciting the energetic-particle-driven geodesic acoustic mode in the nonlinear phase.


Conflict of interest statement

Declarations. Competing interests: The authors declare no competing interests.

Figures

Fig. 1
Fig. 1
The reproduction of experimental phenomena by simulation. The frequency spectrum of the Alfvén instability and EGAM are shown, where the Alfvén instability is the higher frequency mode and the EGAM is the lower frequency mode. Panel (a) shows the frequency spectrum in the simulation, the color bar represents the velocity perturbation normalized by Alfvén velocity and is plotted on a logarithmic scale. Panel (b) shows the experimental observation in shot #34924 of AUG. The color bar represents the soft X-ray emission power and is plotted on a logarithmic scale. Yellow dashed line and pink dotted line represent the excitation time of Alfvén instability and EGAM.
Fig. 2
Fig. 2
The resonance overlap illustrated by the energetic particle distribution ftotal in phase space. The ftotal in (Pϕ,E) phase space for different μ values at different times are shown. Pϕ is normalized to the product of particle charge eEP and the maximum ψ at the plasma center. From the top to the bottom, the three rows are plotted at t=0.304ms, 0.375ms, and 0.609ms, respectively. From the left to the right, the five columns represent different μ values of 1.62, 3.56, 5.51, 7.45 and 9.39 with unit keV/T, respectively. The black color represents the minimum ftotal value 0. The bright yellow color represents the maximum ftotal values, and in the five columns from the left to the right, they are 30, 12, 5, 4, and 2.5, respectively. The solid and dashed white curves represent respectively LAlv=1 and 0, and the green curve represents LEGAM=1. The two cyan dotted lines represent two constant E values. The constant Pϕ lines are not plotted because they are parallel to the vertical axis.
Fig. 3
Fig. 3
The resonance overlap illustrated by the energetic particle distribution ftotal with detailed time evolution. The time evolution of ftotal along (a) the left (or higher) E line of Fig. 2 and (b) the vertical line of Fig. 2 with a Pϕ/eEPψmax value of 0.778, are shown in details. The particle μ value is 7.45keV/T. These three horizontal lines from top to bottom represent three resonant layers of LAlv=1, LEGAM=1, and LAlv=0, respectively. To better understand the physical pictures described above, the bird’s-eye view 3-dimensional sub-figures are also presented. The sub-figures (c) and (d) correspond to the sub-figures (a) and (b), respectively, and their vertical axes represent ftotal. The sub-figures (eg) show the ftotal along Pϕ=const. at different times, the Pϕ/eEPψmax values are 0.994, 0.778, and 0.804, the maximum values of the vertical axis are 6.5, 3.5 and 3.5, and the particle μ values are 5.51, 7.45 and 9.39keV/T, respectively. The vertical dotted lines represent the resonant layers of LEGAM=1.
Fig. 4
Fig. 4
The resonance overlap illustrated by the energetic particle distribution δf in phase space. The δf in (Pϕ,E) phase space for different μ values at different times are shown. Pϕ is normalized to the product of particle charge eEP and the maximum ψ at the plasma center. From the top to the bottom, the three rows are plotted at t=0.375ms, 0.516ms and 0.656ms, respectively. From the left to the right, the five columns represent different μ values of 1.62, 3.56, 5.51, 7.45 and 9.39 with unit keV/T, respectively. The red color represents positive δf and the blue represents negative δf. The solid and dashed black curves represent respectively LAlv=1 and 0, and the red curve represents LEGAM=1. The two black dotted lines represent two constant E values. The constant Pϕ lines are not plotted because they are parallel to the vertical axis.

References

    1. Heidbrink, W. & Sadler, G. The behaviour of fast ions in tokamak experiments. Nucl. Fusion34, 535 (1994).
    1. Heidbrink, W. Basic physics of alfven instabilities driven by energetic particles in toroidally confined plasmas. Phys. Plasmas15, 055501 (2008).
    1. Chen, L. & Zonca, F. Physics of alfvén waves and energetic particles in burning plasma. Rev. Modern Phys.88, 015008 (2016).
    1. Todo, Y. Introduction to the interaction between energetic particles and alfven eigenmodes in toroidal plasmas. Rev. Mod. Plasma Phys.3, 1 (2019).
    1. Todo, Y.: Critical energetic particle distribution in phase space for the alfvén eigenmode burst with global resonance overlap. Nucl. Fusion, 096048 (2019)

LinkOut - more resources