. 2025 Jan 7;16(1):458.
doi: 10.1038/s41467-024-55784-9.

Activity of the mammalian DNA transposon piggyBat from Myotis lucifugus is restricted by its own transposon ends

Affiliations

Activity of the mammalian DNA transposon piggyBat from Myotis lucifugus is restricted by its own transposon ends

Alison B Hickman et al. Nat Commun. .

Abstract

Members of the piggyBac superfamily of DNA transposons are widely distributed in host genomes ranging from insects to mammals. The human genome has retained five piggyBac-derived genes as domesticated elements although they are no longer mobile. Here, we have investigated the transposition properties of piggyBat from Myotis lucifugus, the only known active mammalian DNA transposon, and show that its low activity in human cells is due to subterminal inhibitory DNA sequences. Activity can be dramatically improved by their removal, suggesting the existence of a mechanism for the suppression of transposon activity. The cryo-electron microscopy structure of the piggyBat transposase pre-synaptic complex showed an unexpected mode of DNA binding and recognition using C-terminal domains that are topologically different from those of the piggyBac transposase. Here we show that structure-based rational re-engineering of the transposase through the removal of putative phosphorylation sites and a changed domain organization - in combination with truncated transposon ends - results in a transposition system that is at least 100-fold more active than wild-type piggyBat.


Conflict of interest statement

Competing interests: This work was partially funded by a Collaborative Research and Development Agreement DK22-1043 between the NIDDK and SalioGen Therapeutics. M.H.W. previously served on the scientific advisory board of SalioGen. A.B.H., C.M.F., and F.D. have submitted a patent application (No. 63/632,275) that covers modifications to the piggyBat transposon system that increase its activity. The remaining authors declare no competing interests.

Figures

Fig. 1
Fig. 1. Model of transposition and DNAse I footprinting of Left End (LE) and Right End (RE) of the piggyBat transposon.
a Schematic of cut-and-paste transposition by piggyBac superfamily members. Created in BioRender. Hickman, A. (2024) https://BioRender.com/m03j615. b Representative SDS-PAGE gel showing purified piggyBat transposase (pBat) used for footprinting and EMSA assays (purification performed > 10X with similar results). M, molecular weight standards. MBP, maltose binding protein. Bands were visualized using SimplyBlue SafeStain (Novex). c Absorbance sedimentation c(s) profile for purified pBat transposase is consistent with a dimer. d Schematic of DNase I footprinting assay and footprinting profile of LE of piggyBat. Footprinting was carried out at room temperature by briefly incubating a fixed amount of purified DNA (~ 30 nM) with varying amounts of protein (30–1100 nM), followed by DNase I digestion and fragment analysis. Created in BioRender. Hickman, A. (2024) https://BioRender.com/a53z538. The green asterisk indicates the position of the fluorescent label. The black bar below the horizontal axis marks the flanking TTAA. Footprints are representative of at least three replicates. In the top trace, the red trace is with 340 nM purified pBat (shown schematically as a gray dimer), gray trace is without protein. Box with dashed outline shows protected region. In the bottom trace, the red trace is with 700 nM protein, gray trace is without protein. e DNase I footprinting profile of RE of piggyBat. Blue traces are with 340 nM protein (top), 700 nM (middle), or 900 nM (bottom) purified pBat; and matched gray traces without protein. f DNase I footprinting profile of LE of piggyBat in the presence of unlabeled RE. Red trace is with 340 nM protein, gray trace is without protein. g DNase I footprinting profile of RE of piggyBat in the presence of unlabeled LE. Blue trace is with 340 nM protein, gray trace is without protein. Source data are provided as a Source Data file.
Fig. 2
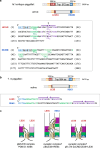
Fig. 2. Comparison of piggyBat and piggyBac transposons.
a Schematic of the piggyBat transposon. Created in BioRender. Hickman, A. (2024) https://BioRender.com/m03j615. The intact transposon and an active form with shorter ends comprised of 153 bp of the Left End (LE) sequence and 208 bp of the Right End (RE) sequence have been described. Box: The DNA sequence corresponding to LE153 is shown on top, with repeats shown in green (designated G1LE, G2LE, G3LE from the transposon tip and purple (P1LE, P2LE, and P3LE). The bases shown in purple may contribute to imperfect palindromes, as indicated by the purple arrows. The DNA sequence corresponding to RE208 is shown on the bottom, with possible repeats indicated in green. The four identical nucleotides at the transposon tips are in blue, and the originally reported 15 bp TIRs are underlined. Numbering corresponds to base pairs from each transposon end. b Schematic of the piggyBac transposon from Trichoplusia ni (GenBank J04364.2). Created in BioRender. Hickman, A. (2024) https://BioRender.com/m03j615. Box: Minimal transposon ends required for activity (LE35/RE63) are indicated, and repeated motifs are shown in green and purple. c Schematic representations of the cryo-EM structure of the pB transposase bound to two LE35 TIRs (from PDB 6x68) (left); proposed model for the pB synaptic complex (middle); and a redesigned hyperactive piggyBac system (right). Portions adapted from ref. .
Fig. 3
Fig. 3. Electromobility Shift Assays (EMSA) with piggyBat transposon end sequences.
a pBat transposase shows multiple interactions in an EMSA DNA binding assay. LE44 with increasing concentrations of pBat-D237A. A single shifted species was observed with LE44 (lanes 1–7; 1: 0 nM protein; 2: 12.5 nM; 3: 25 nM; 4: 50 nM; 5: 100 nM; 6: 200 nM; 7: 300 nM) but not with a random oligonucleotide of the same length (lanes 8–14; protein concentrations are the same as lanes 1–7). b LE88 with increasing concentrations of pBat-D237A. In this case, two major shifted species were observed with LE88 (lanes 1–7; protein concentrations as above); these were not observed with a random oligonucleotide of the same length (lanes 8–14; protein concentrations as above). The red and green asterisks indicate the color of the fluorescent label. c The effect on pBat-LE88 binding by scrambling (“scr”) the sequence of either the first 44 bp of LE88 (“scr1-44LE45-88”) or (d) bp 45–88 (“LE44scr45-88”). e pBat binding to 100 nM RE100. Left to right, lanes correspond to 0 nM protein, 50, 100, 200, 400, and 600 nM. Three shifted species were observed (indicated by arrows). f pBat binds independently to oligonucleotides containing the three repeated pairs of motifs on the Left End (LE44, LE45-88, and LE89-132). All experiments were performed at least two times with similar results. Source data are provided as a Source Data file.
Fig. 4
Fig. 4. Cryo-EM structure of pBat transposase bound to LE44.
a The two monomers of the pBat dimer are shown in gold and orange. The motifs on LE44 are colored blue (bp 1–7), green (bp 11–16), and purple (bp 19–30) as in Fig. 2a; bp 8–10, 17–18, and 31–35 are in gray. Zn2+ ions are shown as purple spheres, and their ligands are shown as purple sticks. Active site residues D237, D309, and D413 are shown as cyan sticks. CRD, cysteine-rich domain. b Structural comparison of pBat and pB bound to DNA. The coloring of pBat is as in (a), bound to piggyBat LE44, shown in dark blue; pB is shown in gray bound to a piggyBac LE35 hairpin (LE35hp), shown in light blue (PDB 6x68). c Close-up of transposon tips and the DDD catalytic triad for pBat bound to LE44; (d) pB bound to LE35hp. The red dots indicate the 3’-OH of LE44 and the phosphodiester bond that is broken upon hairpin opening by pB. The four bases of the TTAA hairpin are indicated for piggyBac LE35hp.
Fig. 5
Fig. 5. Structural features of the pBat-LE44 complex.
a Comparison of the structures of the C-terminal domains (CRD) of pBat and pB (PDB 6x68) bound to DNA, and the protein kinase C (PKC) C1 domain (PDB 7L92). CRD topological folds are shown schematically for pBat and pB where arrows represent β-strands and cylinders are α-helices. Zn2+ ions are shown as dark spheres. N and C denote the CRD termini. b Close-up of CRD1 binding to DNA. c Close-up of minor groove interactions involving pBat residues 495–506. d Close-up of the recognition of the GCGGGA motif (green in Fig. 2a).
Fig. 6
Fig. 6. piggyBat transposition in cultured human cells and the effect of truncating its transposon ends.
a Schematic of the plasmid-to-chromosome transposition assay in HEK293T cells. Created in BioRender. Hickman, A. (2024) https://BioRender.com/z01t408. b Transposition activity (as indicated by number of colonies) for active LE and RE of the piggyBat transposon with (white; n = 12 biological replicates) and without (gray; n = 8) protein in HEK293T cells. Data are presented as mean values +/− SD. No activity was detected with two LEs (LE/LE; n = 8 with transposase, n = 4 without) or two REs (RE/RE; n = 8 with transposase, n = 4 without) (as assessed by two-tailed unpaired t test, GraphPad Prism). ****, p < 0.0001. ns, not significant. c The effect on transposition activity in HEK293T cells of truncating the piggyBat transposon ends. LE/RE indicates LE153-RE208. 50X initial cell dilution for puromycin selection (n = 9 biological replicates). Data are presented as mean values +/− SD. ****, p < 0.0001 (two-tailed unpaired t test). d Transposition activity with 400X initial cell dilution (n = 3 biological replicates). Data are presented as mean values +/− SD. The experiment has been performed twice with similar results. Each data set was compared to LE/RE using a two-tailed unpaired t test. ****, p < 0.0001. Source data are provided as a Source Data file.
Fig. 7
Fig. 7. piggyBat transposition in cultured human cells and the effects of mutating predicted N-terminal casein kinase II phosphorylation sites and duplicating the CRD.
a pBat (top) and pB (bottom) N-terminal amino acid sequences highlighting the CKII phosphorylation motifs (underlined). The numbering above corresponds to the amino acid number of pBat. b Transposition activity for WT and phosphorylation mutant transposases. Data are presented as mean values +/− SD. Data for point mutants (n = 4 biological replicates) were compared to WT (n = 8) using two-tailed unpaired t tests. ****, p < 0.0001. The experiment has been performed twice with similar results. c Transposition activity for WT and 4StoA point mutant transposase on truncated ends (n = 4 biological replicates). Data are presented as mean values +/− SD. P-values were determined by a two-tailed unpaired t test. **, p = 0.002. The experiment has been performed twice with similar results. d Transposition activity of WT and pBat 4StoA compared to pB Δ74 2xCRD on piggyBac LE35/LE35. Data are presented as mean values +/− SD. P-values were determined by a two-tailed unpaired t test. ****, p = 0.0001. n = 4 biological replicates. The experiment has been performed twice with similar results. e Schematic representation of pBat-4StoA-2xCRDV1. Created in BioRender. Hickman, A. (2024) https://BioRender.com/v39k454. f Comparison of transposition activity of pBat-4StoA, pBat-4StoA-2xCRDV1, and pBat-4StoA-2xCRDV2 on truncated piggyBat transposon ends (n = 4 biological replicates); **, p = 0.0014. Data are presented as mean values +/− SD. The experiment has been performed twice with similar results. g Schematic representation of pBat-4StoA-2xCRDV2. Created in BioRender. Hickman, A. (2024) https://BioRender.com/v39k454. h Transposition activity of pBat-4StoA-2xCRDV2 on truncated piggyBat transposon ends (n = 2 biological replicates). The experiment has been performed twice with similar results. Source data are provided as a Source Data file.
Fig. 8
Fig. 8. Comparison of genome-wide insertion profiles showed comparable distribution of pBat WT and pBat-4StoA-2XCRDV1 transpositions.
Three biological replicates of independent transposition assays for WT and pBat-4StoA-2XCRDV1 in HCT116 cells were sequenced. A Sequence preferences of self-reported insertions by WT and pBat-4StoA-2XCRDV1 determined by Sequence Logo represent the preferred nucleotide at each position through the first 15 nucleotides (nt) including the transposon inverted repeat (TIR), followed by the duplicated target site (TSD), and the 3’ genomic region. Three biological replicates are shown for each condition. B Annotations of insertions by genomic features according to NCBI-RefSeq. The annotation of the entire genome is shown for comparison (first column). To account for the insertion preference into TTAA sites, we also calculated the distribution of TTAA for each feature (second column). The biological replicates for each condition show a comparable distribution of insertion sites by genomic annotation (CDS, coding sequence; UTR, untranslated region). C Distribution of insertions for each chromosome. The fraction of insertions was calculated for each chromosome and depicted as a heatmap. We observed insertions throughout the genome for all replicates except for the Y chromosome, reported to be lost from HCT116 cells. D The density of insertions is depicted for a representative genomic region on chromosome 7. Normalized insertion frequencies are shown in peaks per million (ppm), and individual insertion sites are indicated.
Fig. 9
Fig. 9. Model of the synaptic complex of pBat bound to its transposon ends.
The model was generated using the structure of the pBat dimer bound to LE44 (where only LE bp 1–35 were visible) twice, oriented to be separated by a 9-bp B-form DNA spacer corresponding to LE bp 36–44 generated by PyMOL. A model for RE bp 1–56 was also generated using PyMOL, G1LE, and G1RE were placed symmetrically around dimer1, and then the RE was adjusted using the Isolde feature of ChimeraX to roughly align G2LE and G3RE in dimer2 while avoiding protein-DNA clashes.

References

    1. Feschotte, C. & Pritham, E. J. DNA transposons and the evolution of eukaryotic genomes. Annu. Rev. Genet.41, 331–368 (2007). - PMC - PubMed
    1. Craig, N. L. in Mobile DNA III, ed. Craig, Chandler, Gellert, Lambowitz, Rice, & Sandmeyer, 3–39 (American Society of Microbiology, 2015).
    1. Ozata, D. M., Gainetdinov, I., Zoch, A., O’Carroll, D. & Zamore, P. D. PIWI-interacting RNAs: small RNAs with big functions. Nat. Rev. Genet.20, 89–108 (2019). - PubMed
    1. Fraser, M. J., Smith, G. E. & Summers, M. D. Acquisition of host cell DNA sequences by baculoviruses: Relationship between host DNA insertions and FP Mutants of Autographa californica and Galleria mellonella nuclear polyhedrosis viruses. J. Virol.47, 287–300 (1983). - PMC - PubMed
    1. Ivics, Z., Hackett, P. B., Plasterk, R. H. & Izsvák, Z. Molecular reconstruction of Sleeping Beauty, a Tc1-like transposon from fish, and its transposition in human cells. Cell91, 501–510 (1997). - PubMed

LinkOut - more resources